

Plasma proteome profiling discovers novel proteins associated with non-alcoholic fatty liver disease
- PMID: 30824564
- PMCID: PMC6396370
- DOI: 10.15252/msb.20188793
Plasma proteome profiling discovers novel proteins associated with non-alcoholic fatty liver disease
Abstract
Non-alcoholic fatty liver disease (NAFLD) affects 25% of the population and can progress to cirrhosis with limited treatment options. As the liver secretes most of the blood plasma proteins, liver disease may affect the plasma proteome. Plasma proteome profiling of 48 patients with and without cirrhosis or NAFLD revealed six statistically significantly changing proteins (ALDOB, APOM, LGALS3BP, PIGR, VTN, and AFM), two of which are already linked to liver disease. Polymeric immunoglobulin receptor (PIGR) was significantly elevated in both cohorts by 170% in NAFLD and 298% in cirrhosis and was further validated in mouse models. Furthermore, a global correlation map of clinical and proteomic data strongly associated DPP4, ANPEP, TGFBI, PIGR, and APOE with NAFLD and cirrhosis. The prominent diabetic drug target DPP4 is an aminopeptidase like ANPEP, ENPEP, and LAP3, all of which are up-regulated in the human or mouse data. Furthermore, ANPEP and TGFBI have potential roles in extracellular matrix remodeling in fibrosis. Thus, plasma proteome profiling can identify potential biomarkers and drug targets in liver disease.
Keywords: NAFLD; NASH; biomarker discovery; mass spectrometry; plasma proteome profiling.
© 2019 The Authors. Published under the terms of the CC BY 4.0 license.
Conflict of interest statement
The authors declare that they have no conflict of interest.
Figures
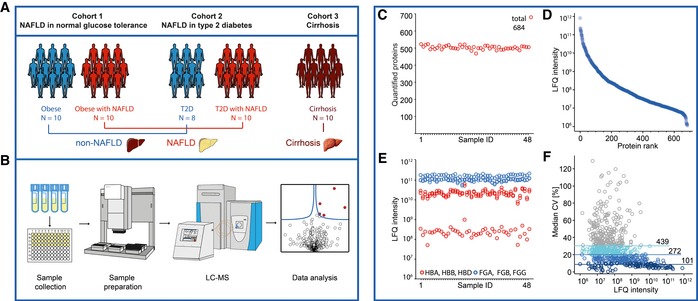
In total, 48 participants from three sub‐studies of either NAFLD or cirrhosis with the indicated numbers of patients were included in this study.
Fasting plasma was collected and distributed into a 96‐well plate for proteomic analysis. Proteins were denaturized, reduced, alkylated, and digested using the automated plasma proteome profiling pipeline, and purified peptides were analyzed in triplicate measurements in a randomization manner by LC‐MS/MS. The resulting 144 raw files were analyzed together with 168 library files by the MaxQuant and Perseus software programs.
Numbers of quantified proteins in the triplicate measurements.
Dynamic range of quantified proteins (LFQ, label‐free quantitation values).
Assessment of study quality by analyzing erythrocyte‐specific proteins (red circles) and coagulation markers (blue circles). HBA, HBB, HBD: hemoglobin subunits alpha, beta, delta; FGA, FGB, FGG: fibrinogen chains alpha, beta, gamma.
Assessment of quantitation accuracy of the LC‐MS/MS instrumentation by the number of proteins with a coefficient of variation (CV) below 30, 20, or 10%, respectively, within three technical replicates.
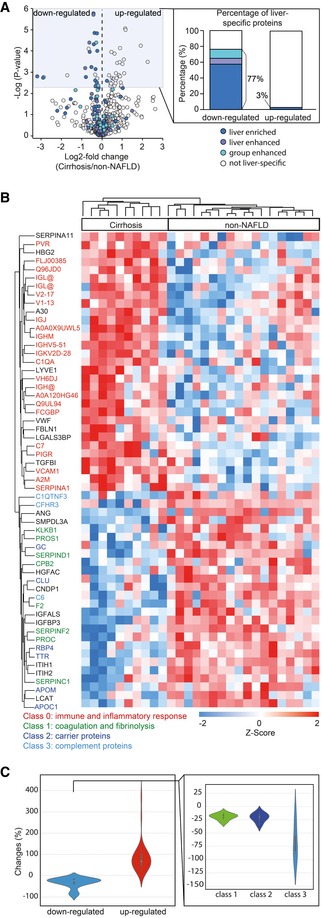
Volcano plot of statistical significance against log2‐fold change between the cirrhosis group (N = 10) and non‐NAFLD group (N = 18), showing significantly differentially expressed proteins shaded in blue and down‐regulated liver‐specific proteins color‐coded according to the classification of Human Protein Atlas (HPA). Significance was defined by independent two‐sample t‐test (two‐sided) corrected by permutation‐based FDR of 0.05. The percentage of down‐ and up‐regulated “liver‐specific” proteins is indicated.
Hierarchical clustering of significantly expressed proteins between the cirrhosis group and non‐NAFLD group. Intensities of proteins were log2‐transformed and Z‐scored to normalize across individuals. Proteins involved in different biological processes or belonging to different classes are indicated by color.
Violin plot of mean fold changes for down‐ and up‐regulated proteins. The fold changes of down‐regulated proteins were further calculated separately for the three protein classes indicated in panel B.
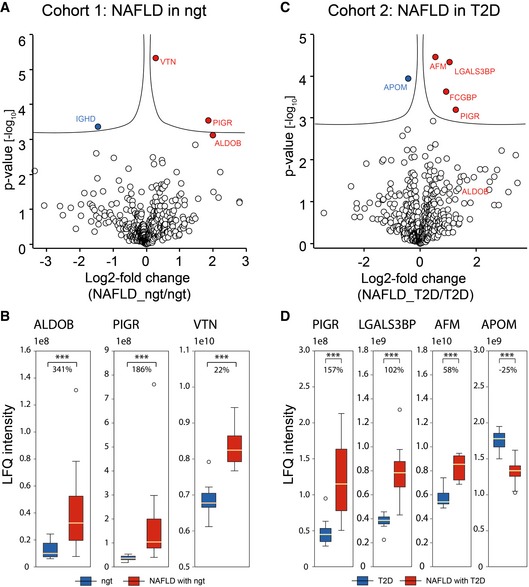
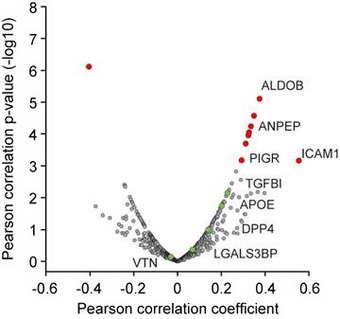
Volcano plot of statistical significance against log2‐fold change between NAFLD (N = 10) and controls (N = 10) in NAFLD subtype 1: NAFLD in normal glucose tolerance. Significance is controlled by P‐value (independent two‐sample t‐test, two‐sided) and minimum fold change (s0 parameter in Perseus) indicated by the cutoff curve, demonstrating significantly up‐regulation of PIGR, ALDOB, and VTN.
Box‐and‐whisker plot showing the distribution of mass spectrometric intensity values of three proteins in the first NAFLD cohort with median fold changes. The yellow line is the median, the top and the bottom of the box represent the upper and lower quartile values of the data and the whiskers represent the upper and lower limits for considering outliers (Q3+1.5*IQR, Q1‐1.5*IQR) where IQR is the interquartile range (Q3–Q1). ***, P < 0.001 (independent two‐sample t‐test, two‐sided). Number of replicates is defined in panel (A).
Volcano plot of statistical significance against log2‐fold change between NAFLD (N = 8) and controls in NAFLD (N = 10) subtype 2: NAFLD in T2D, showing that AFM, LGALS3BP, and PIGR are significantly up‐regulated and APOM significantly down‐regulated.
Box‐and‐whisker plot showing the distribution of mass spectrometric intensity values of four proteins in the second NAFLD cohort with median fold changes. Representation of boxes and whiskers is defined as in panel (B). Number of replicates is defined in panel (C).
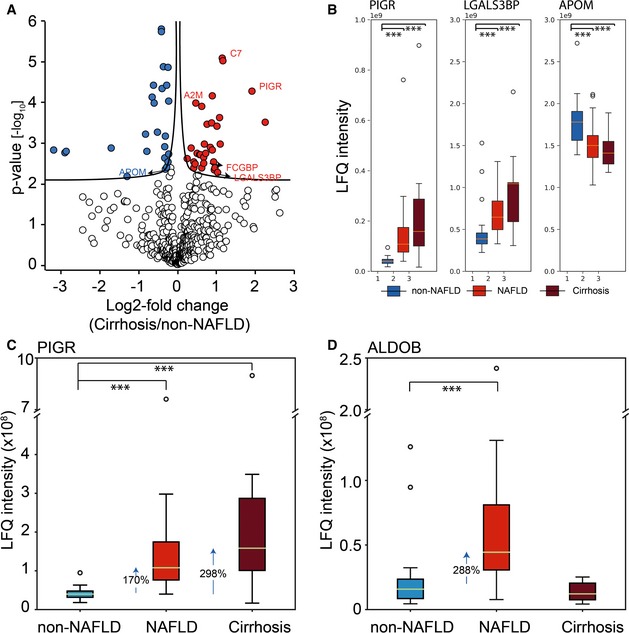
Volcano plot of statistical significance against log2‐fold change between the non‐NAFLD group and the cirrhosis group. Significance is controlled by P‐value and minimum fold change (s0 parameter in the Perseus software) indicated by the cutoff curve, highlighting proteins overlapped with two marker panels for NAFLD subtypes.
Box‐and‐whisker plot showing the distribution of LFQ intensity values of PIGR, LGALS3BP, and APOM in plasma. Number of replicates are 18, 20, and 10 in non‐NAFLD, NAFLD, and Cirrhosis, respectively. The yellow line is the median, the top and the bottom of the box represent the upper and lower quartile values of the data and the whiskers represent the upper and lower limits for considering outliers (Q3+1.5*IQR, Q1‐1.5*IQR) where IQR is the interquartile range (Q3–Q1). ***, P < 0.001. (independent two‐sample t‐test, two‐sided).
Box‐and‐whisker plot showing the distribution of LFQ intensity values of PIGR in plasma with median fold change indicated. Number of replicates in each group and representation of boxes and whiskers are defined as in panel (B).
Box‐and‐whisker plot showing the distribution of LFQ intensity values of ALDOB in with median fold change indicated. Number of replicates in each group and representation of boxes and whiskers are defined as in panel (B).
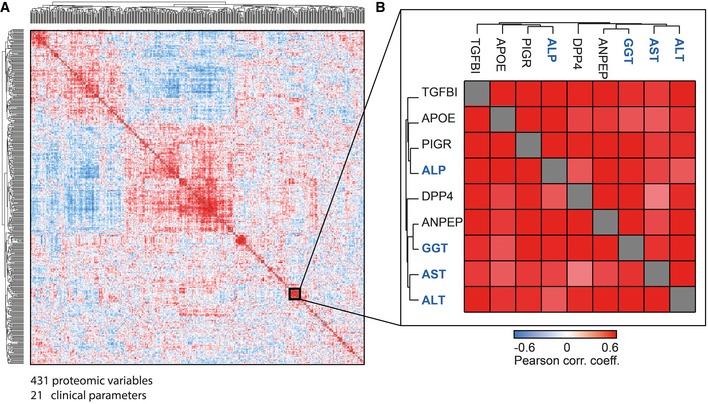
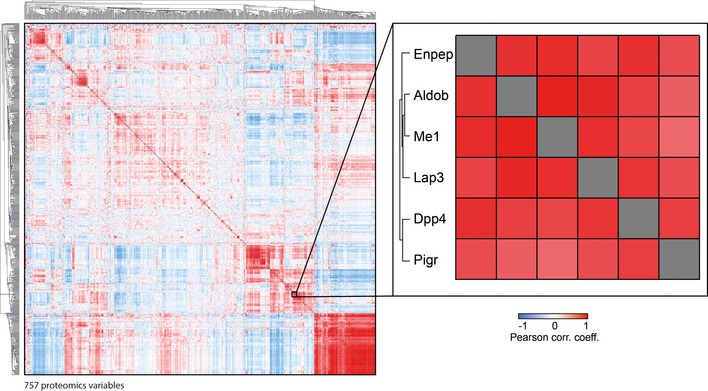
Pairwise correlation of proteins and clinical variables over the 48 study participants, resulting in a matrix of correlation coefficients where each variable is compared to all others. Variables with a high positive correlation to each other will cluster together in groups of red rectangles (high correlations). Negative correlation is indicated in blue patches.
The magnified area highlights a cluster of variables that contains the four main clinical measurements for liver diseases (blue names) as well as five proteins, which were quantified by plasma proteome profiling (black gene names).
- A–D
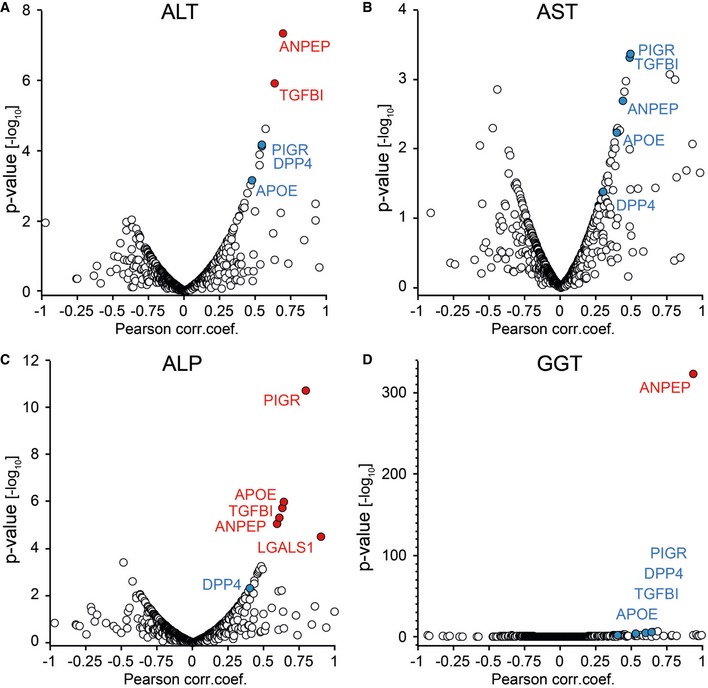
Four liver enzymes are ALT, AST, ALP, and GGT, and red color‐coded proteins are significant.
- A
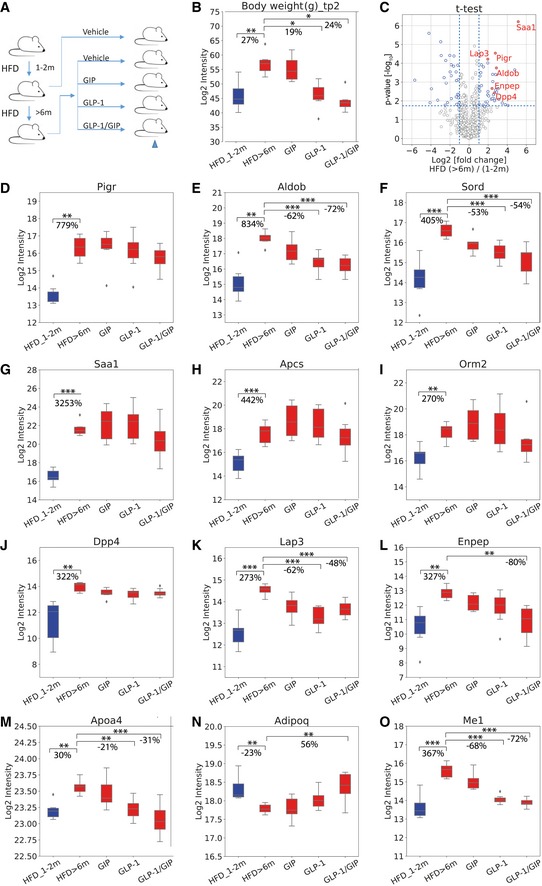
Mouse cohort design.
- B
Box‐and‐whisker plot showing the distribution of log2‐intensity values of body weight across five groups: HFD_1‐2 m (N = 6), HFD > 6 m (N = 6), GIP (N = 7), GLP‐1 (N = 8), and GLP‐1/GIP (N = 6).
- C
Volcano plot of statistical significance against log2‐fold change between mice on > 6 months of HFD and mice on 1–2 months of HFD. Significance is controlled by FDR‐corrected P‐value and minimum log2‐fold change of 1 indicated by the blue‐dotted line, demonstrating that Saa1, Pigr, Aldob, Lap3, Enpep, and Dpp4 are significantly up‐regulated.
- D–O
Box‐and‐whisker plot showing the distribution of log2‐intensity values of statistical significantly regulated proteins across five groups. Number of replicates is defined in panel (B). The yellow line is the median, the top and the bottom of the box represent the upper and lower quartile values of the data and the whiskers represent the upper and lower limits for considering outliers (Q3+1.5*IQR, Q1‐1.5*IQR) where IQR is the interquartile range (Q3–Q1).
References
-
- Aebersold R, Mann M (2003) Mass spectrometry‐based proteomics. Nature 422: 198–207 - PubMed
-
- Aebersold R, Mann M (2016) Mass‐spectrometric exploration of proteome structure and function. Nature 537: 347–355 - PubMed
-
- Altelaar AF, Munoz J, Heck AJ (2013) Next‐generation proteomics: towards an integrative view of proteome dynamics. Nat Rev Genet 14: 35–48 - PubMed
-
- Angulo P, Hui JM, Marchesini G, Bugianesi E, George J, Farrell GC, Enders F, Saksena S, Burt AD, Bida JP, Lindor K, Sanderson SO, Lenzi M, Adams LA, Kench J, Therneau TM, Day CP (2007) The NAFLD fibrosis score: a noninvasive system that identifies liver fibrosis in patients with NAFLD. Hepatology 45: 846–854 - PubMed
Publication types
MeSH terms
Substances
LinkOut - more resources
Full Text Sources
Other Literature Sources
Medical
Molecular Biology Databases
Research Materials
Miscellaneous
