. 2019 Mar 12;116(11):4779-4787.
doi: 10.1073/pnas.1817626116. Epub 2019 Mar 1.

Spatiotemporal coupling of attosecond pulses

Affiliations

Spatiotemporal coupling of attosecond pulses

Hampus Wikmark et al. Proc Natl Acad Sci U S A. .

Abstract

The shortest light pulses produced to date are of the order of a few tens of attoseconds, with central frequencies in the extreme UV range and bandwidths exceeding tens of electronvolts. They are often produced as a train of pulses separated by half the driving laser period, leading in the frequency domain to a spectrum of high, odd-order harmonics. As light pulses become shorter and more spectrally wide, the widely used approximation consisting of writing the optical waveform as a product of temporal and spatial amplitudes does not apply anymore. Here, we investigate the interplay of temporal and spatial properties of attosecond pulses. We show that the divergence and focus position of the generated harmonics often strongly depend on their frequency, leading to strong chromatic aberrations of the broadband attosecond pulses. Our argument uses a simple analytical model based on Gaussian optics, numerical propagation calculations, and experimental harmonic divergence measurements. This effect needs to be considered for future applications requiring high-quality focusing while retaining the broadband/ultrashort characteristics of the radiation.

Keywords: Gaussian optics; attosecond pulse; focusing of XUV radiation; high-order harmonic generation; spatiotemporal coupling.


Conflict of interest statement

The authors declare no conflict of interest.

Figures

Fig. 1.
Fig. 1.
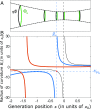
Illustration of spatiotemporal coupling for an attosecond pulse: different frequencies (harmonic orders 31, 35, 59, and 67, with red, orange, green, and blue colors respectively), generated with varying wavefront curvatures and different divergences, as indicated in Inset, will be refocused by XUV optics (here represented as a lens) at different positions, leading to strong chromatic aberrations and an extended focus, both transversally and longitudinally. The fundamental driving field is indicated by the dark brown/black line.
Fig. 2.
Fig. 2.
Emitted XUV frequency as a function of return time for two laser intensities, corresponding to the solid and dashed blue/red curves. The blue curves describes the short trajectories, while the red lines refer to the long trajectory. tts,t are the return times for the short and long electron trajectories leading to the threshold frequency Ωp. tc is the return time for the trajectory leading to the cutoff frequency Ωc. tpi and tci (i = s, ) are return times obtained by approximating Ω(t) as piecewise straight lines. Values for these return times are indicated in Table 1.
Fig. 3.
Fig. 3.
(A) Representation of different contributions to the harmonic wavefront, due to the fundamental (black) and due to the dipole phase for the short trajectory (green) at different generation positions (z). The fundamental beam profile variation is indicated by the thick black dashed line. (B) Radius of curvature of the 23rd harmonic as a function of generation position. The laser wavelength is 800 nm, and the peak intensity at focus is 3×10¹⁴ Wcm−2. The blue (red) solid line is obtained for the short (long) trajectory. The thin solid line shows the radius of curvature of the fundamental. At the position Z+, where R(z)=z0/μs, Rs/z0 diverges. As can be seen in A, this is when the two phase contributions cancel out, as shown by the horizontal blue dashed line. In both A and B, the vertical thin dashed lines indicate the position of the harmonic focus (for the short trajectory, in blue) and the fundamental focus (black). The symbols are defined in the text; Eqs. 7, 10, and 12.
Fig. 4.
Fig. 4.
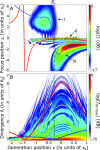
Position of the focus of the 23rd harmonic relative to the generation position (A) and far-field divergence (B) as a function of the generation position relative to the laser focus. The results for the short and long trajectory are indicated by the blue and red curves, respectively. The dashed line corresponds to the position Z+, where the radius of curvature for the short trajectory diverges. The color plots indicate results of a calculation based on the solution of the TDSE, where HHG is assumed to occur in an infinitely thin plane. In A, the on-axis intensity at a certain position along the propagation axis is plotted as a function of generation position on a logarithmic scale. Three different focal regions, labeled I–III can be identified. In B, the radial intensity calculated at a distance of 50z0 from the generation position, long enough to reach the far field, and normalized to the fundamental radial intensity at the same distance is indicated.
Fig. 5.
Fig. 5.
Results of propagation calculations for the 23rd harmonic for a 5.4-mm-long (A), 30-mm-long (B), and 60-mm-long (C) gas cell. The on-axis intensity at a certain position along the propagation axis is plotted as a function of generation position on a logarithmic scale. The results of the Gaussian model are indicated by the blue and red solid lines for the short and long trajectories and are identical to those of Fig. 4A.
Fig. 6.
Fig. 6.
(A) Spatial widths of harmonics 13–19 generated in Ar and measured approximately 6 m after generation as a function of the cell position. The solid lines are fit to the experimental data indicated by the circles. (BD) Spatial widths of the same harmonics as a function of generation position, obtained by the numerical simulations solving the TDSE and the propagation equations (B) and predicted by the Gaussian model for the short trajectory (C) and the same model using a truncated Gaussian beam (D). The peak intensity in vacuum is 2.5 ×10¹⁴ Wcm−2, and the laser beam waist is 220 μm.
Fig. 7.
Fig. 7.
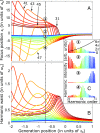
Position of harmonic focus zi (A) and waist (B) as a function of generation position for harmonics 31–71. The different harmonic orders are indicated by different rainbow color codes, from brown (31) to dark blue (71). C shows harmonic spectra at four different positions along zi, indicated from top to bottom by the numbered circles, for the generation position marked by the dashed line in A. The spectral phase of the attosecond pulse is shown in black for the first observation point, being largely independent of the observation position. arb. units, arbitrary units.
Fig. 8.
Fig. 8.
(A and B) Graphs show the on-axis spectral and temporal intensity, respectively, in logarithmic scales, as a function of the observation position, when generating at z=0.75z0. The positions ② and ③ (see Fig. 7A) are indicated by dashed lines. C and D show retrieved attosecond pulses at two different detection positions, i.e., ② and ③ in Fig. 7A, in a linear scale.

References

    1. Akturk S, Gu X, Bowlan P, Trebino R. Spatio-temporal couplings in ultrashort laser pulses. J Opt. 2010;12:093001–093020.
    1. Miranda M, et al. Spatiotemporal characterization of ultrashort laser pulses using spatially resolved Fourier transform spectrometry. Opt Lett. 2014;39:5142–5145. - PubMed
    1. Pariente G, Gallet V, Borot A, Gobert O, Quéré F. Space–time characterization of ultra-intense femtosecond laser beams. Nat Photon. 2016;10:547–553.
    1. Harth A, et al. Compact 200 kHz HHG source driven by a few-cycle OPCPA. J Opt. 2017;20:014007.
    1. Vincenti H, Quéré F. Attosecond lighthouses: How to use spatiotemporally coupled light fields to generate isolated attosecond pulses. Phys Rev Lett. 2012;108:113904. - PubMed

Publication types