. 2019 Mar 1;10(3):213.
doi: 10.1038/s41419-019-1445-0.

Quantitative proteomic analyses of dynamic signalling events in cortical neurons undergoing excitotoxic cell death

Affiliations

Quantitative proteomic analyses of dynamic signalling events in cortical neurons undergoing excitotoxic cell death

Ashfaqul Hoque et al. Cell Death Dis. .

Abstract

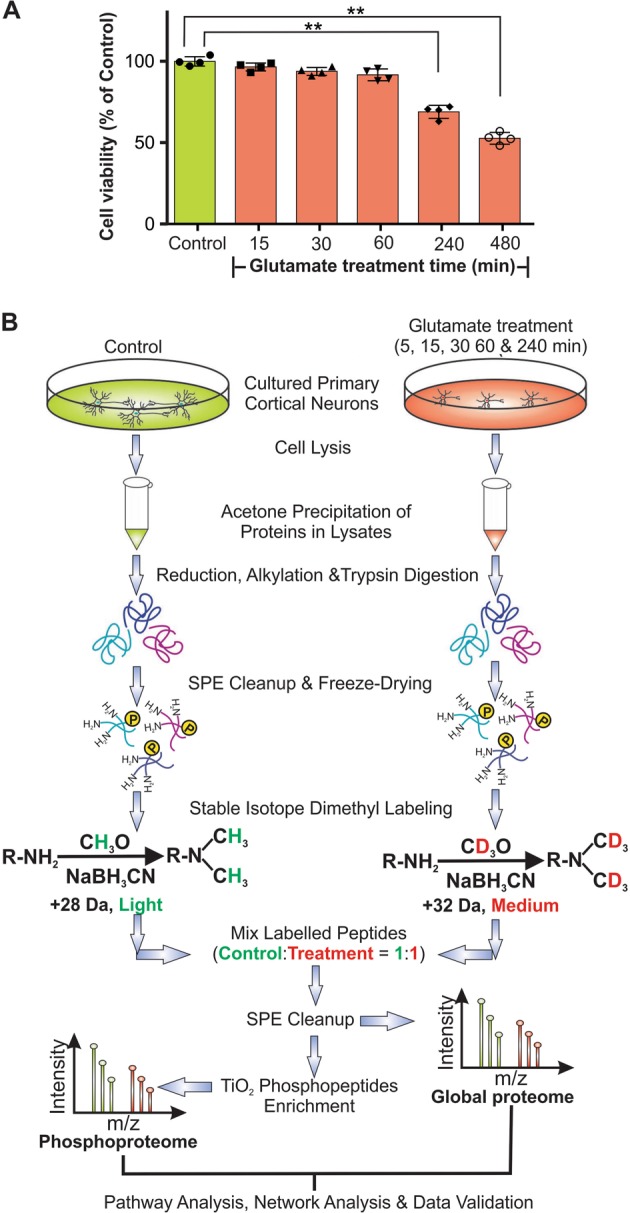
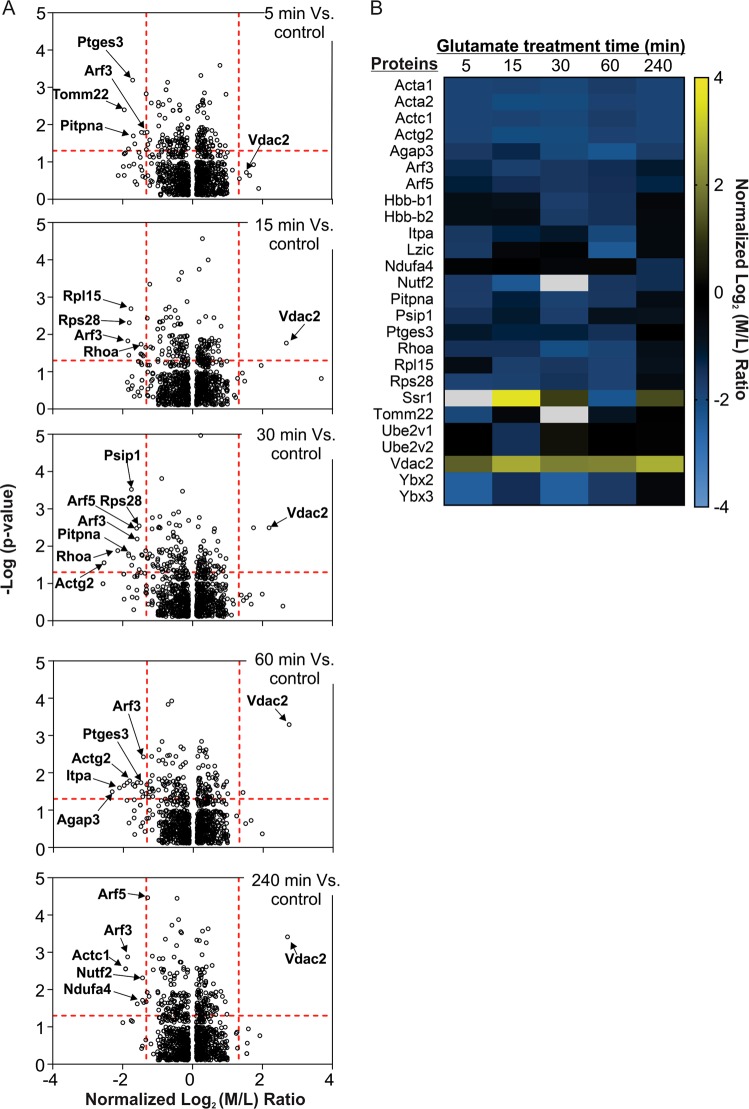
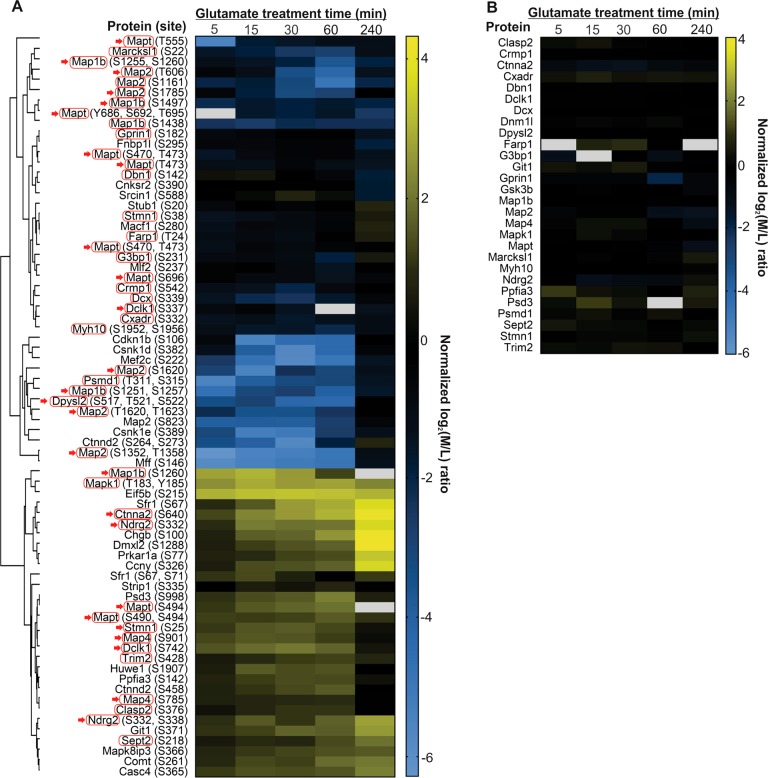
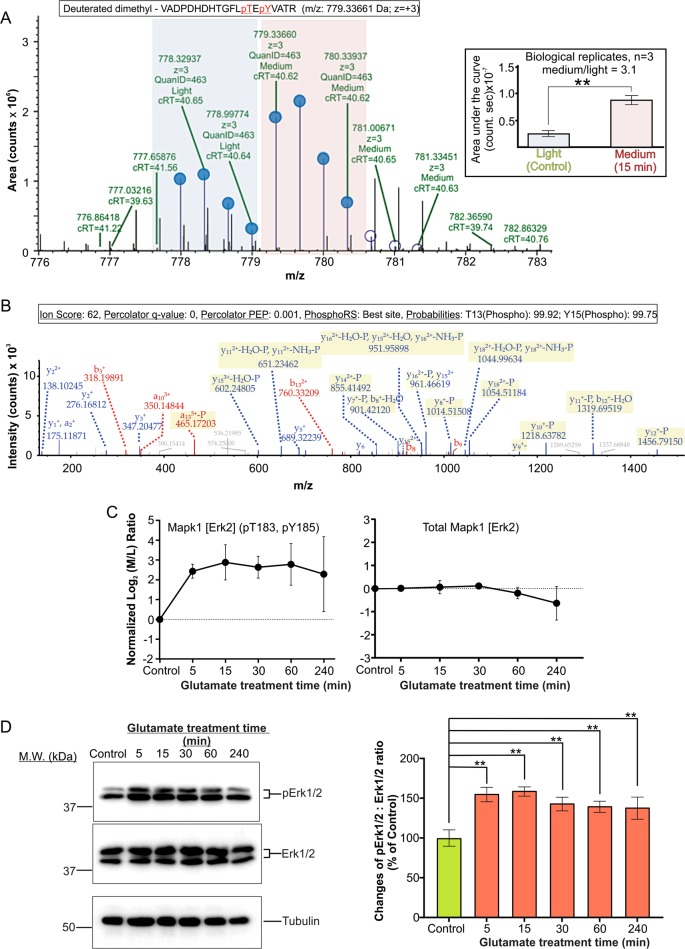
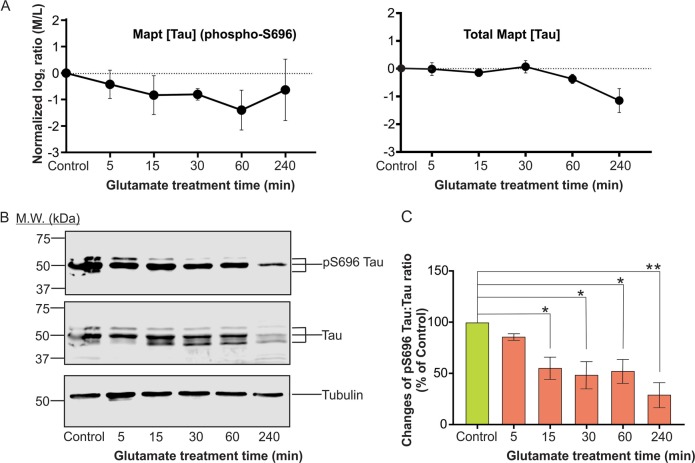
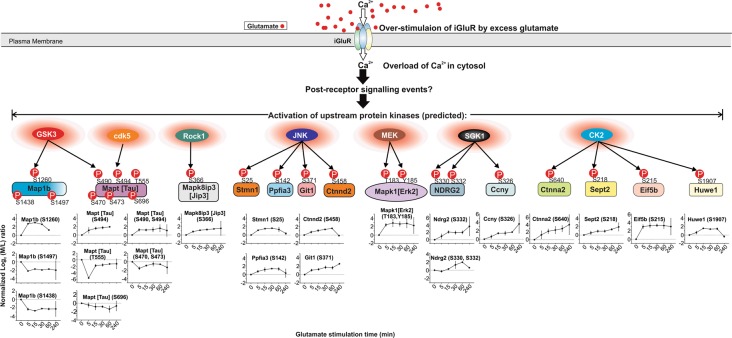
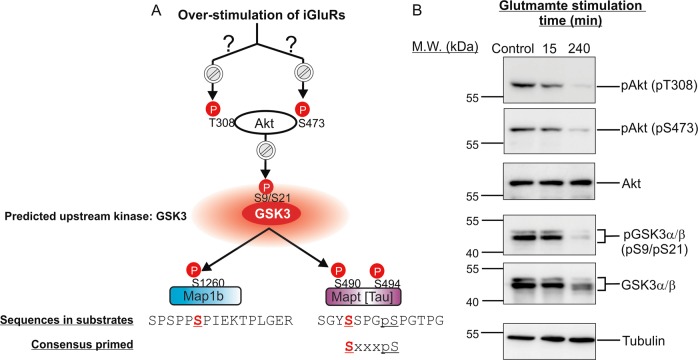
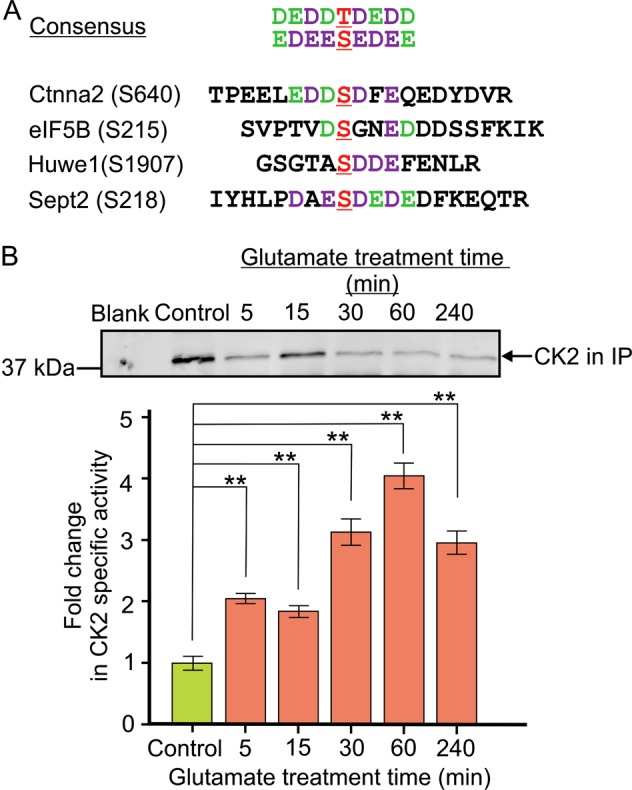
Excitotoxicity, caused by overstimulation or dysregulation of ionotropic glutamate receptors (iGluRs), is a pathological process directing neuronal death in many neurological disorders. The aberrantly stimulated iGluRs direct massive influx of calcium ions into the affected neurons, leading to changes in expression and phosphorylation of specific proteins to modulate their functions and direct their participation in the signalling pathways that induce excitotoxic neuronal death. To define these pathways, we used quantitative proteomic approaches to identify these neuronal proteins (referred to as the changed proteins) and determine how their expression and/or phosphorylation dynamically changed in association with excitotoxic cell death. Our data, available in ProteomeXchange with identifier PXD008353, identified over 100 changed proteins exhibiting significant alterations in abundance and/or phosphorylation levels at different time points (5-240 min) in neurons after glutamate overstimulation. Bioinformatic analyses predicted that many of them are components of signalling networks directing defective neuronal morphology and functions. Among them, the well-known neuronal survival regulators including mitogen-activated protein kinases Erk1/2, glycogen synthase kinase 3 (GSK3) and microtubule-associated protein (Tau), were selected for validation by biochemical approaches, which confirmed the findings of the proteomic analysis. Bioinformatic analysis predicted Protein Kinase B (Akt), c-Jun kinase (JNK), cyclin-dependent protein kinase 5 (Cdk5), MAP kinase kinase (MEK), Casein kinase 2 (CK2), Rho-activated protein kinase (Rock) and Serum/glucocorticoid-regulated kinase 1 (SGK1) as the potential upstream kinases phosphorylating some of the changed proteins. Further biochemical investigation confirmed the predictions of sustained changes of the activation states of neuronal Akt and CK2 in excitotoxicity. Thus, future investigation to define the signalling pathways directing the dynamic alterations in abundance and phosphorylation of the identified changed neuronal proteins will help elucidate the molecular mechanism of neuronal death in excitotoxicity.


Conflict of interest statement

The authors declare that they have no conflict of interest.

Figures

Fig. 1
Fig. 1. Workflow to quantitatively measure the temporal changes of global and phospho-proteomes of neurons induced by glutamate treatment.
a Cultured cortical neurons at DIV7 (cell number: ~6 × 105) were treated with 100 μM of glutamate. MTT cell viability assay showing the time-dependent changes in cell viability of cultured neurons in response to glutamate treatment (orange bars) and control (green bar) untreated neurons. The viability of the glutamate-treated neurons compared with that of the control neurons is presented as mean ± SD (n = 4, ** indicates p < 0.01, one-way ANOVA with Dunnett’s multiple comparison test). The morphological changes of the neurons at 5, 15, 30, 60 and 240 min after glutamate treatment are presented in Figures S1 and S2. b Workflow of proteomic analysis of cultured primary cortical neurons treated with glutamate for 5, 15, 30, 60 and 240 min. Cell lysis was performed on glutamate treated and untreated (control) neurons using RIPA buffer. Total proteins from these neuronal lysates were precipitated with acetone followed by reduction, alkylation and digestion with trypsin. The resultant tryptic peptides were purified by reverse-phase solid phase extraction cartridges (SPE) and freeze-dried prior to stable isotope dimethyl labelling with formaldehyde (CH2O, light label, green) for peptides derived from the untreated neurons and deuterated formaldehyde (CD2O, medium label, red) for peptides derived from the treated neurons in the presence of sodium cyanoborohydride (NaBH3CN). Around 200 μg of proteins from neuronal lysates were used as starting material. After tryptic digestion and differentiated isotopic dimethyl labelling, equal amounts of the derivatized peptides from proteins in the lysates of both treated and untreated neurons were mixed (i.e., control: treatment, 1:1). Aliquots of 50 μg of mixed labelled tryptic peptides were used for global proteomic analysis. An aliquot of mixed labelled peptides was set aside and later injected to LTQ Orbitrap Elite mass spectrometer for LC-MS/MS analysis. The data obtained (global proteome) reveals the temporal global proteome changes of neurons induced by glutamate treatment. The remaining portions of the mixed labelled peptides were enriched for phosphopeptides using TiO2 micro-columns prior to injection to LTQ Orbitrap Elite mass spectrometer for LC-MS/MS analysis. The data obtained (phosphoproteome) reveals the temporal phosphoproteome changes of neurons induced by glutamate treatment. *n = 3 for all time points from 5 min to 60 min and n = 6 for 240 min
Fig. 2
Fig. 2. Neuronal proteins exhibiting significant temporal changes in abundance in response to glutamate overstimulation.
a Volcano plots depicting the distribution of quantified neuronal proteins identified at 5, 15, 30, 60 and 240 min of glutamate treatment. Selected neuronal proteins showing significant changes (±2.5-fold changes, p ≤ 0.05) in abundance are also highlighted b Heatmap depicting the time-dependent changes in abundance of selected neuronal proteins in response to glutamate treatment. Only proteins exhibiting ± 2.5-fold differences in abundance in at least one of the five time points are selected for presentation. The temporal changes (abundance ratios) of all identified proteins are presented in Table S1. White boxes indicate that the abundance ratio information is missing for those given proteins in any of the replicate samples
Fig. 3
Fig. 3. Temporal changes in phosphorylation states of neuronal proteins in response to glutamate overstimulation.
a Heatmap depicting the time-dependent changes of phosphorylation levels of specific phosphosites in selected neuronal proteins in response to glutamate treatment. Phosphoproteins of which the relative protein level abundance information are available from global proteome data are labelled with red box. Phosphoproteins with more than one identified phosphosite are marked with red arrows. Phosphosites exhibiting similar patterns of temporal changes are grouped in clusters. b Heatmap depicting the changes in abundance of the neuronal proteins depicted in panel a. White boxes indicate that the abundance ratio information is missing for those given proteins in any of the replicate samples obtained at that selected time points
Fig. 4
Fig. 4. Validation of the proteomic result indicating activation of neuronal Erk1/2 by glutamate overstimulation.
a Extracted ion chromatogram (XIC) showing isotopic clusters used for MS1 quantification of the dimethyl- (light, blue shaded region) and deuterated dimethyl-labelled (medium, pink shaded region) tryptic phosphopeptides derived from phosphorylated Erk2 extracted from the control and 15 min glutamate-treated neurons. The calculated average median value of the medium: light ratios from three biological replicates = 3.1 (data presented as mean of the area under the curves ± SD, **p < 0.01) b The MS2 spectrum used for identification of this unique phosphopeptide with a Mascot ion score of 62. c Plots of the time-dependent changes in abundance of total Mapk1 (also referred to as Erk2) and the abundance of the tryptic phosphopeptide consisting phospho-T183 and phospho-Y185 derived from Mapk1 (Erk2). The ratios of the peptides derived from Mapk1 (Erk2) of the treated neurons relative to those of the control neurons are presented as the mean of normalised log2 medium/light ratios at different time points following glutamate treatment. Data presented as mean ± SD, n = 3 for the 5–60 min time points and n = 6 for the 240 min time point. d Left panel western blot analysis of the phosphorylation state of Mapk3/1 (Erk1/2). Right panel: Changes of the ratio of the densitometric units of the signal of phospho-Erk1/2 (pErk1/2) versus those of the signal of total Erk1/2. A value of 100% is assigned to the pErk1/2:Erk1/2 ratio of the control neurons. Data presented as mean ± SD, n = 3 and ** indicates p < 0.01, one-way ANOVA with Dunnett’s multiple comparison test
Fig. 5
Fig. 5. Validation of the proteomic data showing time-dependent changes in the abundance and the level of phosphorylation at Ser-696 of Mapt (Tau).
a The changes in abundance of the tryptic phosphopeptide consisting of phosphorylated Ser-696 (derived from phosphoproteome data) and the unique tryptic peptide(s) used for the identification of total Tau following glutamate treatment at different time points. The abundance of the tryptic peptides is presented as mean of the normalized log2 ratios of the medium labelled versus light labelled (M/L) dimethyl derivatized tryptic peptides, error bars represent standard deviations. b Western blot analysis to follow the total Tau and phospho-Ser-696 level of control neurons and neurons at varying time points after glutamate overstimulation. c Ratios of the densitometric units of the signals of phospho-Tau at Ser-696 versus those of the signal of total Tau in the control and glutamate-treated neurons were calculated. The changes in the ratio of the glutamate-treated neurons in comparison with that of control are presented. Data presented as mean ± SD, n = 3, ** indicates p < 0.01 and * indicates p < 0.05, one-way ANOVA with Dunnett’s multiple comparison test
Fig. 6
Fig. 6. Predicted protein kinases contributing to the temporal changes of phosphorylation states of selected proteins in neurons undergoing excitotoxic cell death.
Temporal changes of the phosphorylation states of neuronal Map1b, Tau, Jip3, Git1, Stmn1, Ppfia3, Erk1/2, Ndrg2, cyclin Y, Eif5b, Ctnna2 and Ctnnd2 at 5, 15, 30, 60 and 240 min after glutamate overstimulation. These proteins have at least one phosphosite exhibiting time-dependent increase in phosphorylation level. The upstream protein kinases targeting these sites are predicted by comparing the phosphosite sequences with the known optimal phosphorylation sequences of protein kinases and literature-curated knowledge. These predicted upstream kinases including GSK3, cdk5, Rock1, JNK, MEK, SGK1 and CK2 are activated by specific post-receptor signalling events initiated by overstimulation of the neuronal iGluRs. The question mark indicates that the post-receptor signalling events directing activation of the predicted upstream kinases remain unclear. All data shown in the plots are the mean of normalised log2 medium/light ratios at different time points following glutamate treatment. The error bars denote standard deviations. The plot depicting the time-dependent changes of the phosphorylation of Mapt (Tau) at Ser-696 in excitotoxicity is also shown in Fig. 5a
Fig. 7
Fig. 7. Confirmation of the perturbation of GSK3 and Akt signalling activities in excitotoxicity predicted by changes of the phosphorylation states of Map1b and Mapt (Tau).
a A model depicting how glutamate overstimulation leads to inactivation of Akt and activation of GSK3 in neurons in excitotoxicity (top panel). GSK3 was previously found to phosphorylate Ser-1260 of Map1b and Ser-490 of Tau in vitro and in cells. GSK3 phosphorylation of Ser-490 of Tau is dependent on prior phosphorylation of Ser-494 by Cdk5. The sequences around Ser-1260 of Map1b and Ser-490 of Tau as well as the consensus phosphorylation-primed optimal sequences of GSK3 protein substrates are shown. The plots showing changes in phosphorylation states at Ser-1260 of Map1b and Ser-490/Ser-494 of Tau, presented as normalized log2 ratios of medium-versus light-labelled dimethyl derivatized tryptic phosphopeptides, are shown in Fig. 6. b Western blot analysis to follow the changes of phosphorylation states of the activating phosphorylation sites (Thr-308 and Ser-473) of Akt, and the inhibitory phosphorylation site (Ser-21 and Ser-9 of GSK3α and GSK3β) of the two GSK3 isoforms at 15 and 240 min after glutamate overstimulation. Besides the western blots probed with the phospho-specific antibodies, the western blots of total Akt, total GSK3α/β and tubulin are also presented
Fig. 8
Fig. 8. Confirmation of the activation of neuronal CK2 in excitotoxicity predicted by the changes of phosphorylation states of Ctnna2, eIF5B, Huwe1 and Sept2.
a Sequences of the perturbed phosphosites in Ctnna2, eIF5B, Huwe1 and Sept2 show significant conformity to the consensus phosphorylation sequence of CK2 defined by the peptide library approaches. The phosphorylation sites (S and T) are in red fonts and underlined. The preferred residues in each position of the consensus CK2 phosphorylation sequence are in purple and green fonts. The peptide library approach revealed that CK2 exhibited a higher preference for residues labelled in purple than those labelled in green. b Upper panel: Part of the western blot showing the amounts of CK2 immunoprecipitated from lysates of control and glutamate treated neurons for determination of CK2 specific kinase activity. The image of the whole blot is shown in Figure S10. The amounts of CK2 in the immunoprecipitates were measured by densitometric analysis of the anti-CK2 signals of the western blot. Lower panel: comparison of the specific activity of CK2 in untreated neurons (control) and neurons after 5–240 min after glutamate overstimulation. The kinase activity of the immunoprecipitated CK2 was measured by the efficiency of its phosphorylation of the CK2-specific peptide substrate CK2-tide modelled after the consensus phosphorylation sequence of CK2 (Fig. 8a). The specific activity of the immunoprecipitated CK2 was expressed as the rate of phosphorylation of the CK2-tide per densitometric unit of the anti-CK2 immunoreactive signal. The results are presented as the ratios of the specific kinase activity of immunoprecipitated CK2 of the glutamate-treated neurons versus those of the untreated (control) neurons. Data presented as a fold-change increase in specific CK2 activity in control and treated neuronal lysates. Data are presented as mean ± SD; n = 3; ** indicates p < 0.01, one-way ANOVA with Dunnett’s multiple comparison test

References

    1. Choi DW, Maulucci-Gedde M, Kriegstein AR. Glutamate neurotoxicity in cortical cell culture. J. Neurosci. 1987;7:357–368. doi: 10.1523/JNEUROSCI.07-02-00357.1987. - DOI - PMC - PubMed
    1. Hardingham GE, Bading H. Synaptic versus extrasynaptic NMDA receptor signalling: implications for neurodegenerative disorders. Nat. Rev. Neurosci. 2010;11:682–696. doi: 10.1038/nrn2911. - DOI - PMC - PubMed
    1. Costa, V. V. et al. N-Methyl-d-Aspartate (NMDA) receptor blockade prevents neuronal death induced by Zika virus infection. MBio8, 10.1128/mBio.00350-17 (2017). - PMC - PubMed
    1. Olmo IG, et al. Zika virus promotes neuronal cell death in a non-cell autonomous manner by triggering the release of neurotoxic factors. Front. Immunol. 2017;8:1016. doi: 10.3389/fimmu.2017.01016. - DOI - PMC - PubMed
    1. Gaburro J, et al. Zika virus-induced hyper excitation precedes death of mouse primary neuron. Virol. J. 2018;15:79. doi: 10.1186/s12985-018-0989-4. - DOI - PMC - PubMed

Publication types

MeSH terms