. 2019 Mar 1;9(1):3301.
doi: 10.1038/s41598-019-38934-8.

Anti-VEGF injection frequency correlates with visual acuity outcomes in pro re nata neovascular AMD treatment

Affiliations

Anti-VEGF injection frequency correlates with visual acuity outcomes in pro re nata neovascular AMD treatment

Thomas Wecker et al. Sci Rep. .

Abstract

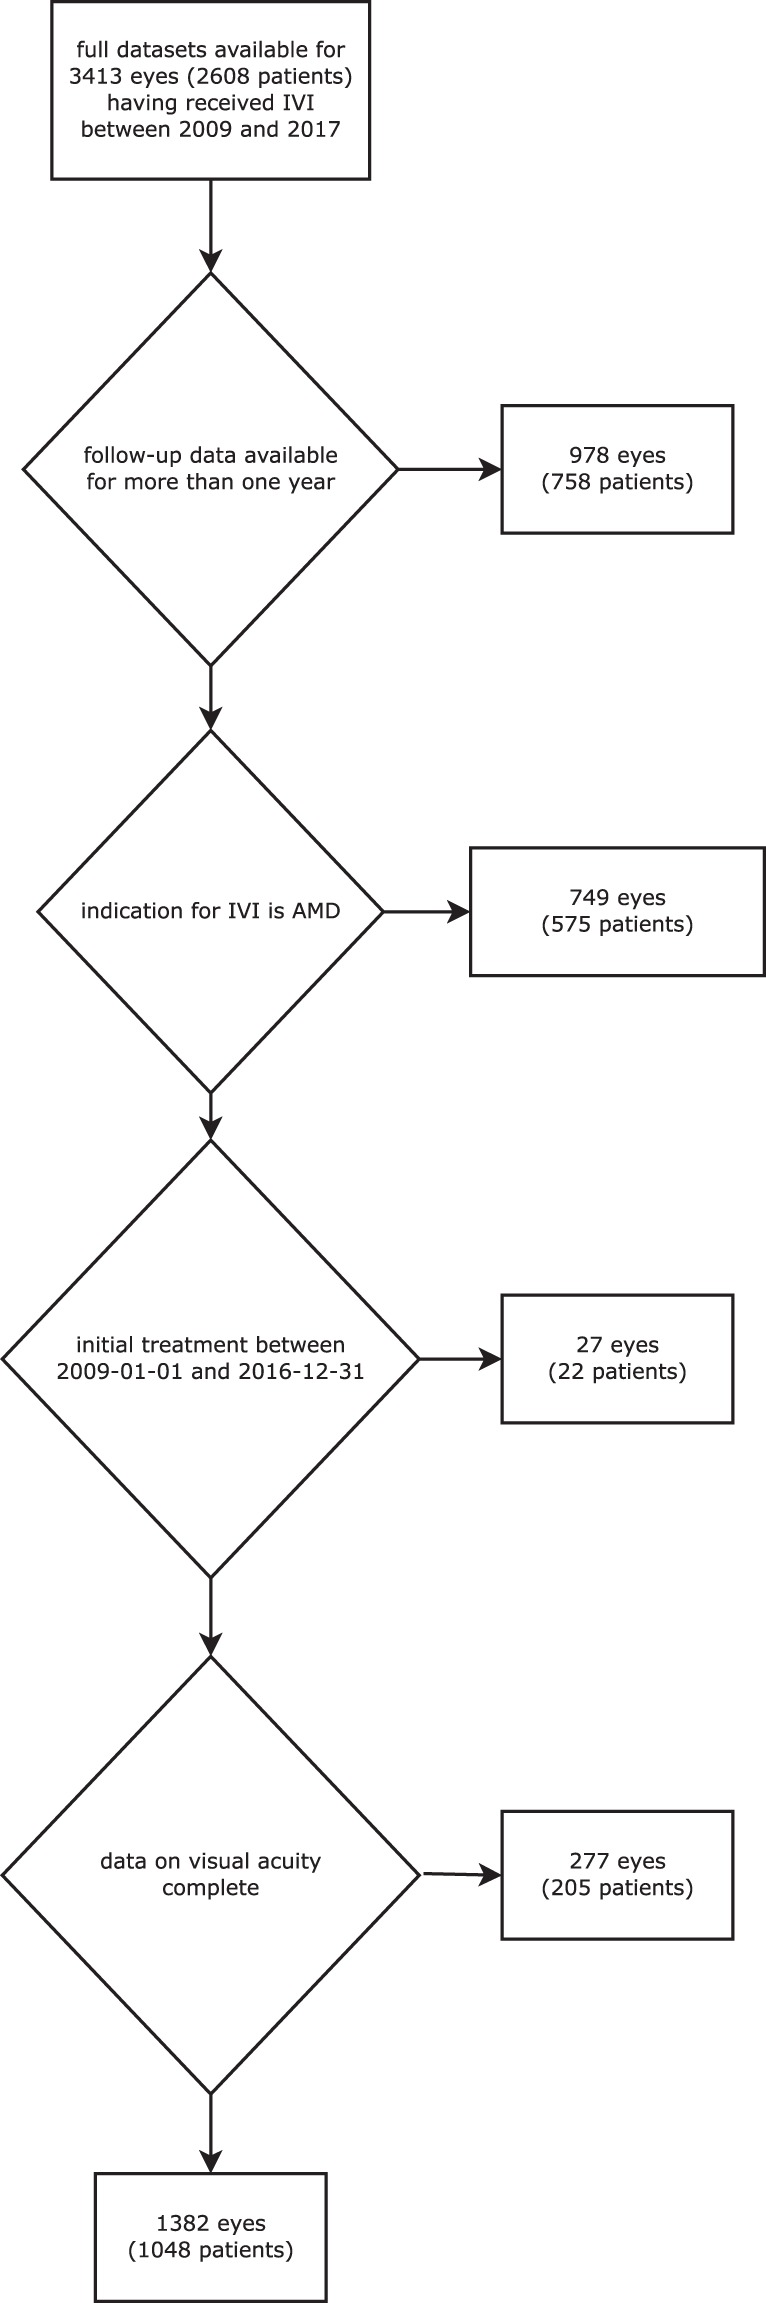
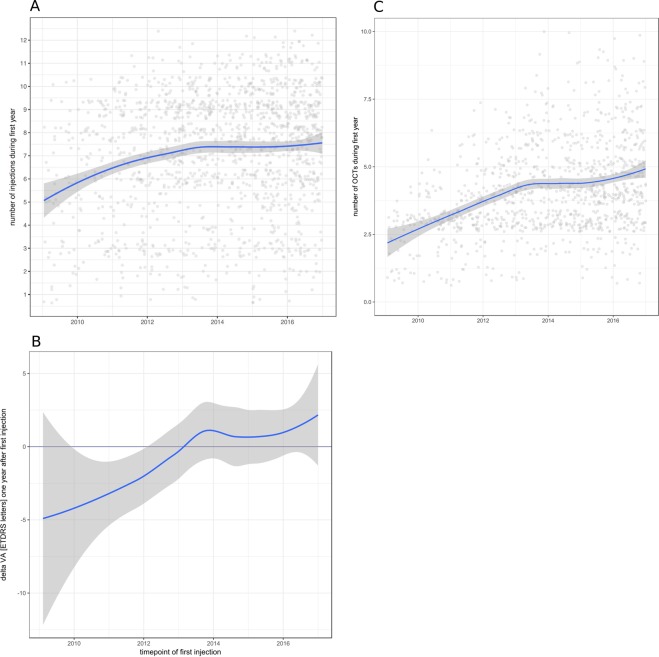
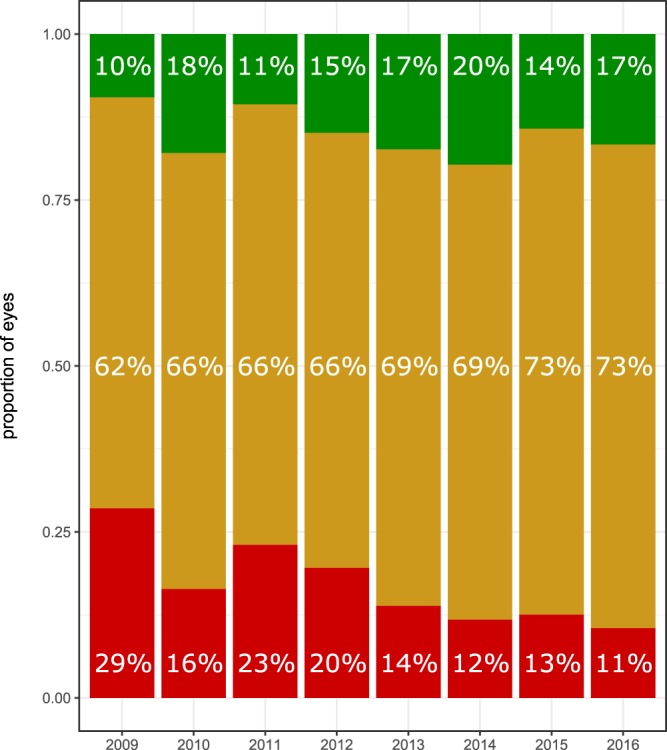
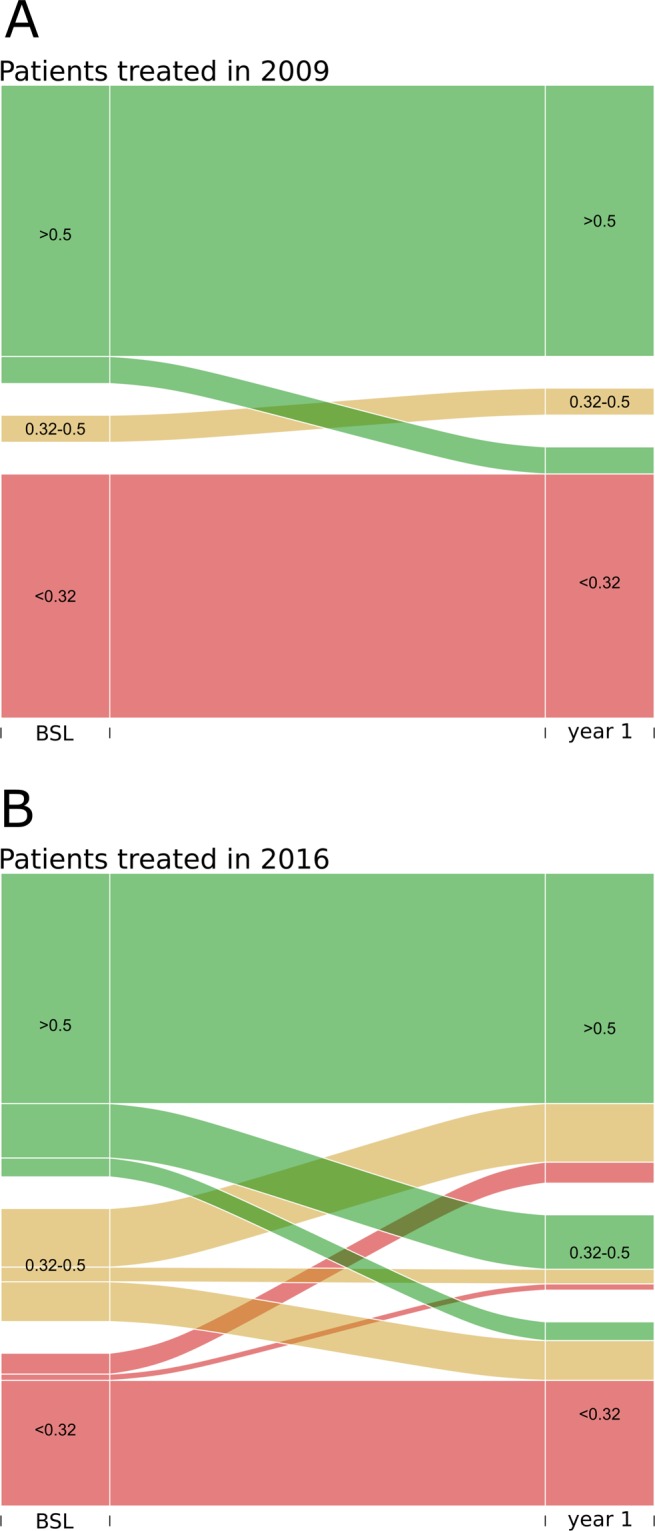
Clinical trials report substantial gains in visual acuity (VA) for eyes treated with intravitreal anti-VEGF for neovascular AMD (nAMD). In clinical reality, VA outcomes are more variable. Here we investigate pro-re nata treatment frequencies and VA in a real-life cohort of 1382 eyes (1048 patients). Patients with nAMD and one year complete follow-up treated with pro-re nata anti-VEGF between 2009 and 2016 were included. Injection frequency and VA was analyzed clustered by year of first treatment. Baseline parameters were compared between years. Median injection frequency in the first year was 5 with an IQR (interquartile range) of 5 for patients treated in 2009 and 8 with an IQR of 3 for patients treated from 2012 onwards. Median VA outcomes at one year were -5 to ±0 letters for patients treated between 2009 and 2013 and ±0 to +2 letters for patients treated from 2013 onwards. This cohort comprises all severities and subtypes of nAMD. 39% of patients had baseline VA outside the range for the MARINA or ANCHOR clinical trials. Higher treatment frequency was associated with improved VA in our real-life nAMD cohort. With adequate injection frequency, almost 90% of eyes had stable or improved VA over one year. Median VA gains, however, were lower compared to clinical trials. This may be due to a wider range of baseline characteristics in real-life cohorts.


Conflict of interest statement

T.W. has received speaker fees from Novartis. H.A. has received research funds from Novartis as well as honoraria/speaker fees/advisory fees from Roche, Allergan, Zeiss, Bayer Healthcare. A.S. has received research funds from Novartis Germany as well as honoraria/speaker fees/advisory fees from Allergan, Bayer, Boehringer Ingelheim, Novartis, Orphan Europe. The other authors declare no competing interest.

Figures

Figure 1
Figure 1
Flow chart of all patients included in the analysis.
Figure 2
Figure 2
Development of injection frequencies and VA outcomes over time. (A) The number of injections in the first year of treatment increased over time. Eyes with their first injection in 2009 received a mean of 5 to 6 injections (median 5). Eyes with treatment initiated after 2013 received a mean of 7.5 injections (median 8) and PRN injection frequencies did not increase further. Graph shows mean injection numbers in blue with 95% confidence interval in grey. Individual eyes are represented by light grey dots. x-axis represents year of first treatment. (B) Mean visual acuity at the end of the first treatment year shows a decrease of up to five letters for eyes treated between 2009 and 2013. Eyes treated from 2013 onwards gained on average 0 to 2 letters. Graph shows mean VA acuity change in blue with 95% confidence interval in grey. Individual eyes are represented by light grey dots. x-axis represents year of first treatment. (C) Mean number of OCT exams performed in the first treatment year increases over the years mirroring the increase in injection numbers and VA. Graph shows mean number of OCT exams in blue with 95% confidence interval in grey. Individual eyes are represented by light grey dots. x-axis represents year of first treatment. Y-axis is cut at 10 for better visualization; 11 eyes had more than 10 OCTs in the first year (max. 18).
Figure 3
Figure 3
Proportion of eyes with significant VA change. The proportion of eyes with VA gain ≥3 lines (green) was between 10 and 20% in all treatment years with a tendency towards higher proportions from 2013 onwards. The majority of eyes in all years remained within ±3 lines (yellow). The proportion of eyes with VA loss ≥3 lines (red) was between 11 and 29% with a trend towards lower proportions from 2013 onwards.
Figure 4
Figure 4
Eyes grouped by VA categories at baseline and end of treatment year. In both exemplary years analyzed, most eyes remained in their baseline treatment categories (green = good VA, yellow = intermediate VA, red = poor VA). In 2009, few eyes from the good VA group deteriorated to poor VA at the end of year one while no eye increased from poor to intermediate or good VA. In 2016, more eyes changed VA groups going from good to intermediate or poor VA and vice versa. Eyes with intermediate VA at baseline improved or deteriorated in comparable proportions while only a minority of eyes remained in the intermediate category.
Figure 5
Figure 5
Patient age and VA at baseline. (A) Patient age at first treatment slightly increased over the years. Patients from 2012 onwards were statistically significantly older compared to 2009 (*p < 0.05, Dunnet’s t-test). (B) Baseline VA did not differ over the years. Horizontal lines show VA inclusion limits for MARINA and ANCHOR clinical trials. Note that only 60.6% of our real life cohort falls into the VA inclusion criteria of these clinical trials. Baseline VA for this analysis was adjusted for differences between decimal and ETDRS measurements based on Falkenstein et al..

References

    1. IVAN Study Investigators et al. Ranibizumab versus bevacizumab to treat neovascular age-related macular degeneration: one-year findings from the IVAN randomized trial. Ophthalmology. 2012;119:1399–1411. doi: 10.1016/j.ophtha.2012.04.015. - DOI - PubMed
    1. Wecker T, et al. Five-year visual acuity outcomes and injection patterns in patients with pro-re-nata treatments for AMD, DME, RVO and myopic CNV. Br J Ophthalmol. 2017;101:353–359. - PMC - PubMed
    1. Lange C, Feltgen N, Junker B, Schulze-Bonsel K, Bach M. Resolving the clinical acuity categories ‘hand motion’ and ‘counting fingers’ using the Freiburg Visual Acuity Test (FrACT) Graefes Arch. Clin. Exp. Ophthalmol. 2009;247:137–142. doi: 10.1007/s00417-008-0926-0. - DOI - PubMed
    1. Falkenstein IA, et al. Comparison of visual acuity in macular degeneration patients measured with snellen and early treatment diabetic retinopathy study charts. Ophthalmology. 2008;115:319–323. doi: 10.1016/j.ophtha.2007.05.028. - DOI - PMC - PubMed
    1. Kaiser PK. Prospective evaluation of visual acuity assessment: a comparison of snellen versus ETDRS charts in clinical practice (An AOS Thesis) Trans Am Ophthalmol Soc. 2009;107:311–324. - PMC - PubMed

Publication types

Substances