

Predicting seasonal influenza epidemics using cross-hemisphere influenza surveillance data and local internet query data
- PMID: 30824756
- PMCID: PMC6397245
- DOI: 10.1038/s41598-019-39871-2
Predicting seasonal influenza epidemics using cross-hemisphere influenza surveillance data and local internet query data
Abstract
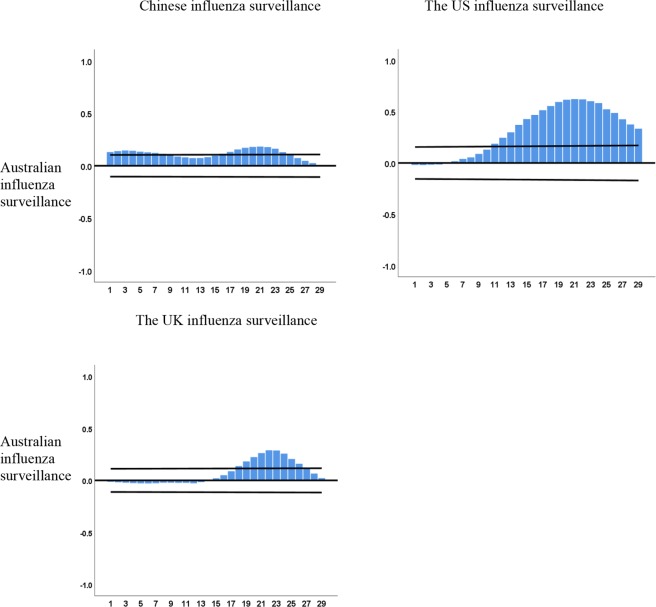
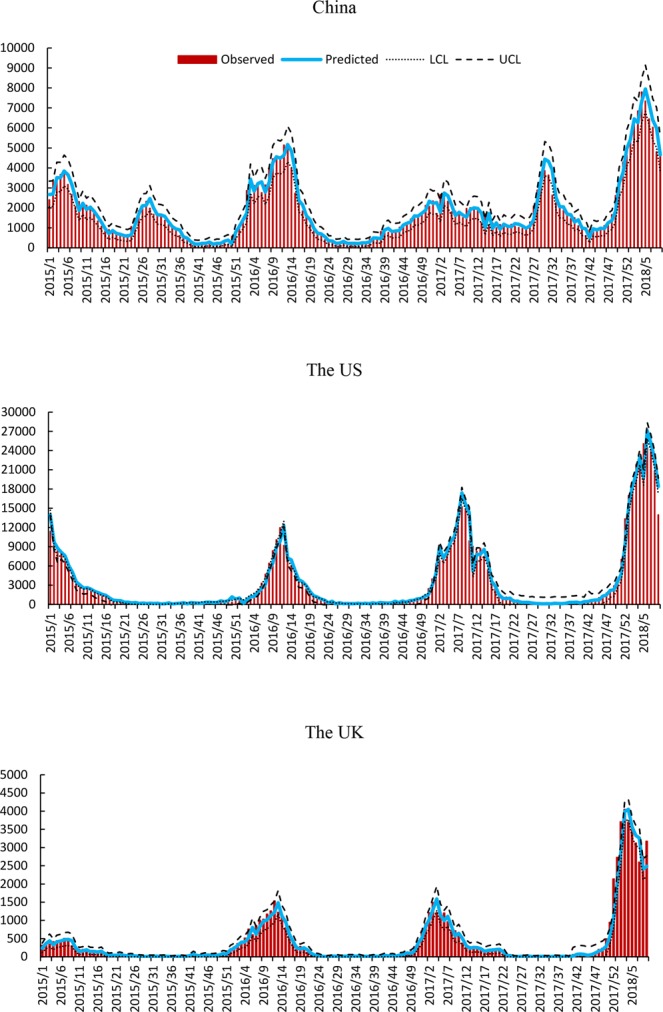
Can early warning systems be developed to predict influenza epidemics? Using Australian influenza surveillance and local internet search query data, this study investigated whether seasonal influenza epidemics in China, the US and the UK can be predicted using empirical time series analysis. Weekly national number of respiratory cases positive for influenza virus infection that were reported to the FluNet surveillance system in Australia, China, the US and the UK were obtained from World Health Organization FluNet surveillance between week 1, 2010, and week 9, 2018. We collected combined search query data for the US and the UK from Google Trends, and for China from Baidu Index. A multivariate seasonal autoregressive integrated moving average model was developed to track influenza epidemics using Australian influenza and local search data. Parameter estimates for this model were generally consistent with the observed values. The inclusion of search metrics improved the performance of the model with high correlation coefficients (China = 0.96, the US = 0.97, the UK = 0.96, p < 0.01) and low Maximum Absolute Percent Error (MAPE) values (China = 16.76, the US = 96.97, the UK = 125.42). This study demonstrates the feasibility of combining (Australia) influenza and local search query data to predict influenza epidemics a different (northern hemisphere) scales.
Conflict of interest statement
The authors declare no competing interests.
Figures

References
-
- Australian Government. Australian Influenza Surveillance Report and Activity Updates, http://www.health.gov.au/internet/main/publishing.nsf/Content/cda-survei... (2017).
-
- Centers for Disease Control and Prevention. Weekly U.S. Influenza Surveillance Report, https://www.cdc.gov/flu/weekly/index.htm#OISmap (2018).
Publication types
MeSH terms
LinkOut - more resources
Full Text Sources
Medical
