. 2019 Mar 1;10(1):1005.
doi: 10.1038/s41467-019-08745-6.

State-of-the-art global models underestimate impacts from climate extremes

Affiliations

State-of-the-art global models underestimate impacts from climate extremes

Jacob Schewe et al. Nat Commun. .

Abstract

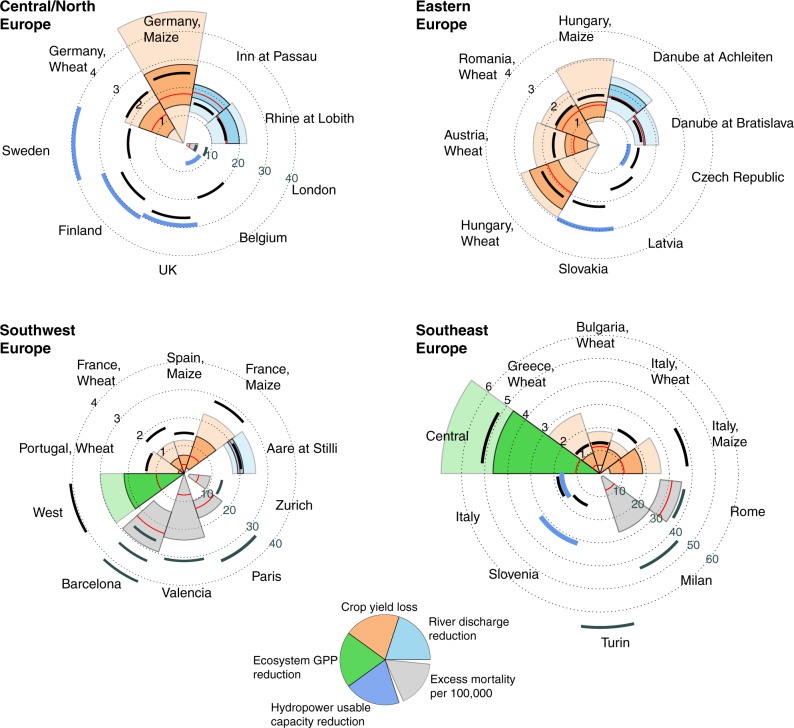
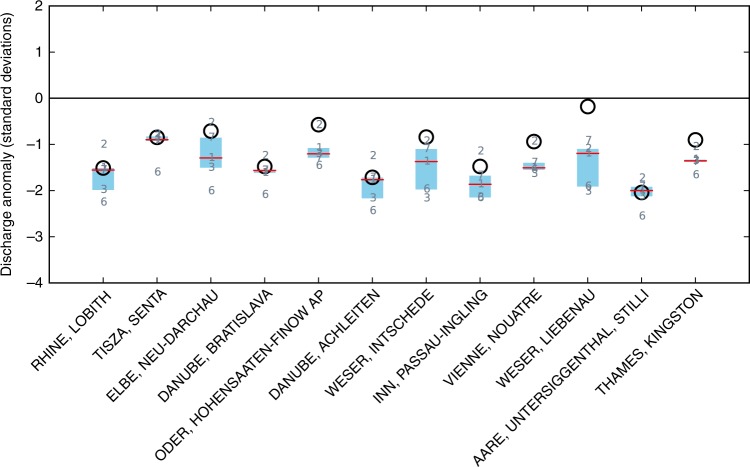
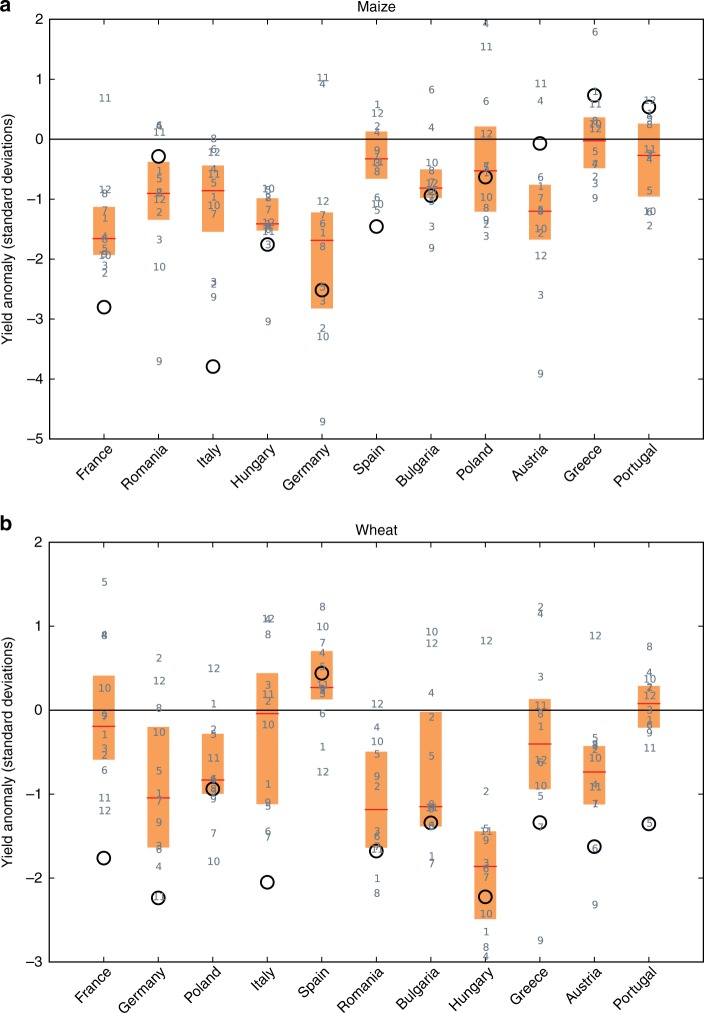
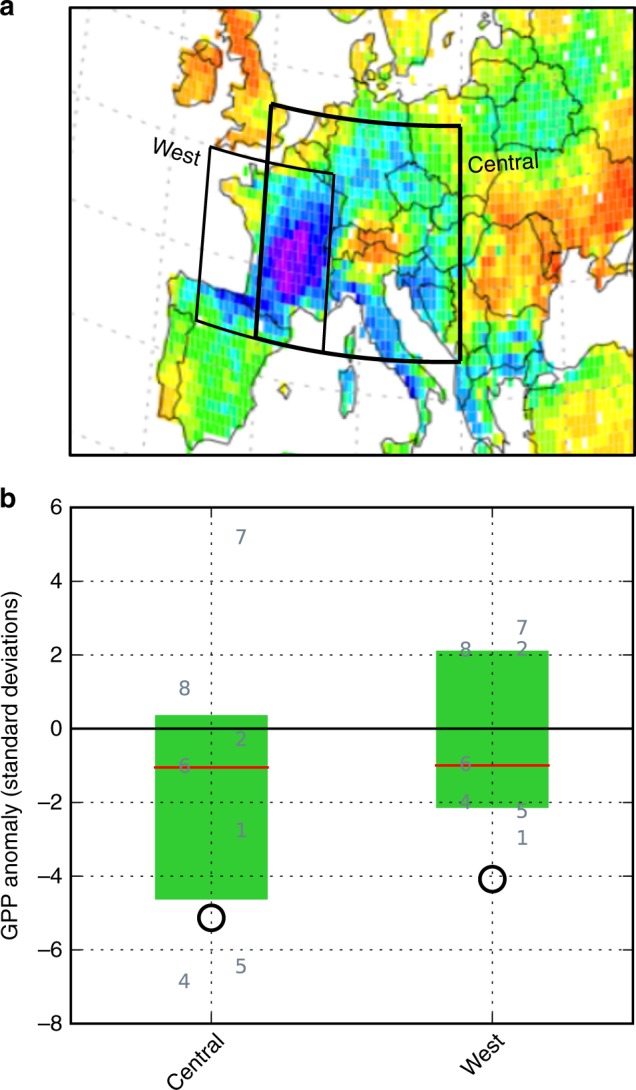
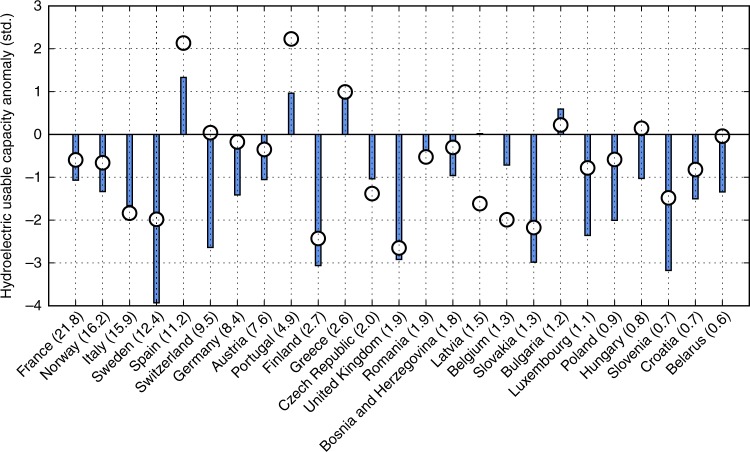
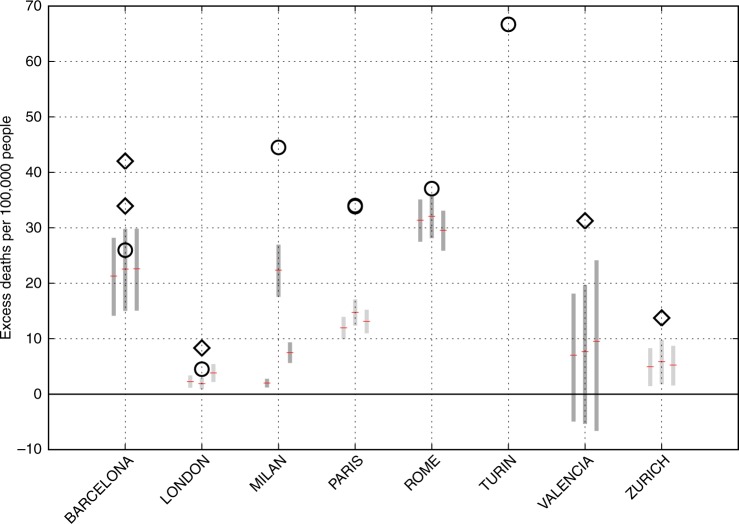
Global impact models represent process-level understanding of how natural and human systems may be affected by climate change. Their projections are used in integrated assessments of climate change. Here we test, for the first time, systematically across many important systems, how well such impact models capture the impacts of extreme climate conditions. Using the 2003 European heat wave and drought as a historical analogue for comparable events in the future, we find that a majority of models underestimate the extremeness of impacts in important sectors such as agriculture, terrestrial ecosystems, and heat-related human mortality, while impacts on water resources and hydropower are overestimated in some river basins; and the spread across models is often large. This has important implications for economic assessments of climate change impacts that rely on these models. It also means that societal risks from future extreme events may be greater than previously thought.


Conflict of interest statement

The authors declare no competing interests.

Figures

Fig. 1
Fig. 1
Multi-sector impacts of the 2003 EHWD. Black arcs represent observations, and colours represent model results. Units are standard deviations (black axis labels), except for human mortality which is given in excess deaths per 100,000 (grey axis labels). For river discharge, crop yields and ecosystem GPP, the thin red line marks the multi-model median; the dark-coloured segment marks the interquartile range; and the light-coloured segment marks the full range of model results. For hydropower, only one model is available which is marked by the thick blue arcs. For mortality, the red line and grey segments mark the median and the full range, respectively, across three climate forcing data sets and three different heat-mortality relations. Note the larger axis range for Southeast Europe. This figure only includes river discharge, crop yield, GPP and hydropower results for those locations where a negative anomaly larger than 1 standard deviation was observed. Figures 2–6 include further details on the data shown here, as well as additional data for locations with smaller or positive anomalies. The West and Central regions used for ecosystem GPP are defined in Methods
Fig. 2
Fig. 2
August average river discharge anomalies in 2003. Black circles are observed (GRDC) data. Grey numbers are the global hydrological models (see Methods); red lines indicate the median, and blue boxes the interquartile range, of the model ensemble. Stations are ordered by catchment size; the smallest catchment (Thames river at Kingston) has an area of about 10,000 km2, which corresponds to the size of four model grid cells
Fig. 3
Fig. 3
Crop yield anomalies in 2003. a Maize, b wheat. Black circles are observed data from FAOSTAT. Grey numbers are the 12 global gridded crop models; red lines indicate the median, and orange boxes the interquartile range, of the model ensemble. Countries are ordered by their total production (http://ec.europa.eu/eurostat/web/agriculture/data/database) in 2010, decreasing from left to right
Fig. 4
Fig. 4
Summer (June–August) gross primary productivity (GPP) anomaly in 2003. a Outlines of the West and Central regions, overlaid on a map of the observed GPP anomaly; see Supplementary Fig. 10 for a more detailed version of this map. b Regionally averaged anomaly. Black circles show MODIS remote-sensing-derived estimates. Grey numbers are the global vegetation models; numbers offset to the left represent models that were run without considering any human influence except climate change, while numbers offset to the right represent models that accounted for historical land-use patterns and, in some cases, anthropogenic water withdrawal. Red lines indicate the median, and green boxes the interquartile range, of the model ensemble. One model (no. 4) did not report total GPP but only GPP for individual plant functional types (PFTs); for this model, we show the sum of the four dominant PFTs in the relevant region
Fig. 5
Fig. 5
Hydropower anomalies in 2003. Black circles show anomalies in annual hydropower generation reported by EIA (Methods). Blue bars show anomalies in simulated annual hydroelectric usable capacity. Countries are ordered by installed capacity (in GW) as included in the model, indicated in parentheses
Fig. 6
Fig. 6
City-specific estimates of the excess mortality attributable to the 2003 EHWD. Black symbols are observed estimates from the literature (Supplementary Table 3; note two very similar estimates for Paris). Circles denote studies that have reported both the number of excess deaths and the baseline population; diamonds denote studies which have only reported the number of excess deaths and where we have used the corresponding city population reported for 2003 in official statistics as a baseline. Grey bars and red lines are results from this study, for three different climate forcing datasets (left: GSWP3, middle: PGFv2, right: WFDEI). The bars indicate the results obtained by using the lower and upper 95% confidence intervals for the linear exposure response function slopes from ref. , and the red line indicates the result obtained using the central estimate for the slope

References

    1. Rosenzweig C, et al. Assessing agricultural risks of climate change in the 21st century in a global gridded crop model intercomparison. Proc. Natl Acad. Sci. USA. 2014;14:1–6. - PMC - PubMed
    1. Schewe, J. et al. Multimodel assessment of water scarcity under climate change. Proc. Natl Acad. Sci. USA111, 3245–3250 (2014). - PMC - PubMed
    1. van Vliet MTH, et al. Multi-model assessment of global hydropower and cooling water discharge potential under climate change. Glob. Environ. Chang. 2016;40:156–170. doi: 10.1016/j.gloenvcha.2016.07.007. - DOI
    1. Whitmee S, et al. Safeguarding human health in the Anthropocene epoch: report of The Rockefeller Foundation–Lancet Commission on planetary health. Lancet. 2015;386:1973–2028. doi: 10.1016/S0140-6736(15)60901-1. - DOI - PubMed
    1. Pecl GT, et al. Biodiversity redistribution under climate change: Impacts on ecosystems and human well-being. Science (80-) 2017;355:eaai9214. doi: 10.1126/science.aai9214. - DOI - PubMed

Publication types