. 2019 Mar 1;10(1):994.
doi: 10.1038/s41467-019-08912-9.

Prioritizing Parkinson's disease genes using population-scale transcriptomic data

Affiliations

Prioritizing Parkinson's disease genes using population-scale transcriptomic data

Yang I Li et al. Nat Commun. .

Abstract

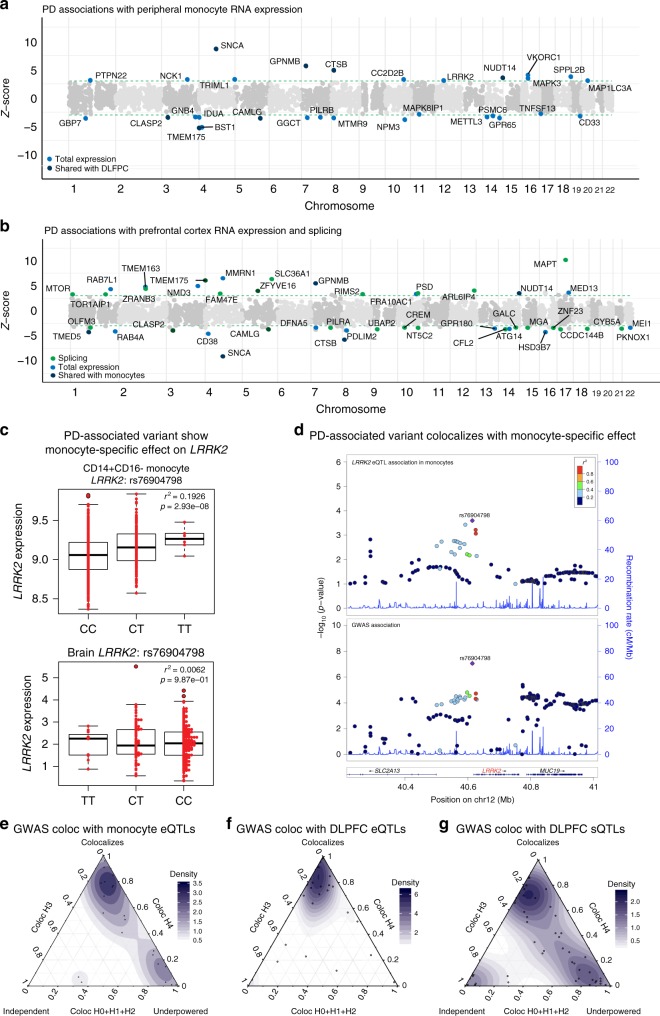
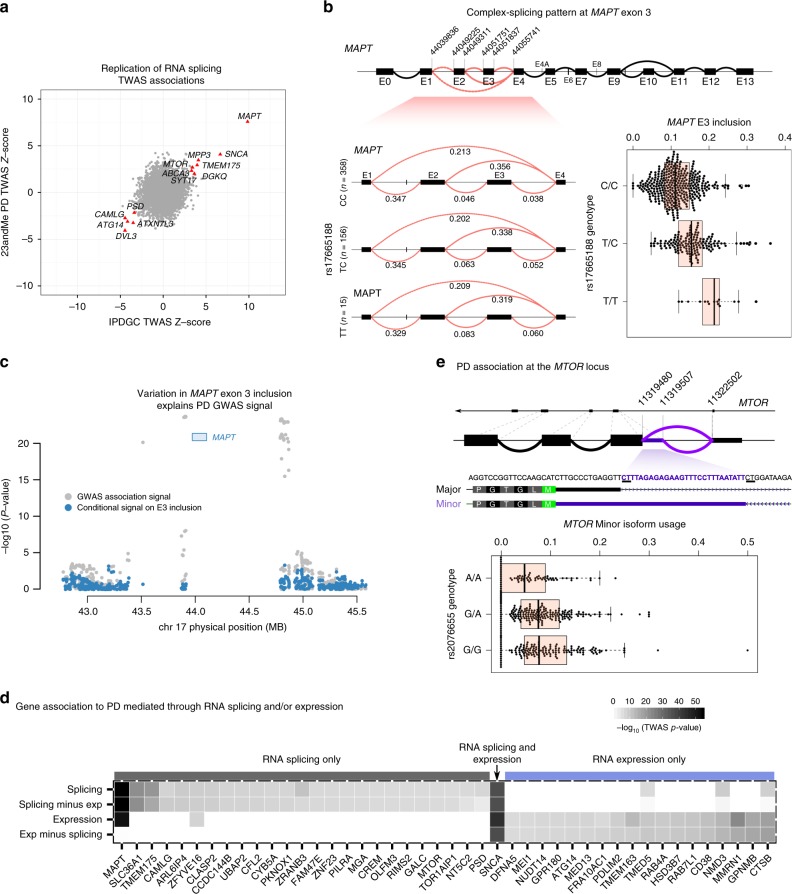
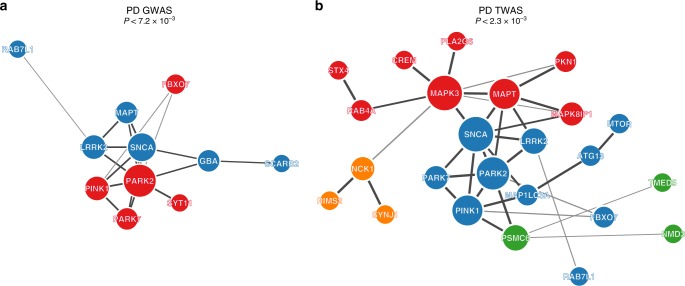
Genome-wide association studies (GWAS) have identified over 41 susceptibility loci associated with Parkinson's Disease (PD) but identifying putative causal genes and the underlying mechanisms remains challenging. Here, we leverage large-scale transcriptomic datasets to prioritize genes that are likely to affect PD by using a transcriptome-wide association study (TWAS) approach. Using this approach, we identify 66 gene associations whose predicted expression or splicing levels in dorsolateral prefrontal cortex (DLFPC) and peripheral monocytes are significantly associated with PD risk. We uncover many novel genes associated with PD but also novel mechanisms for known associations such as MAPT, for which we find that variation in exon 3 splicing explains the common genetic association. Genes identified in our analyses belong to the same or related pathways including lysosomal and innate immune function. Overall, our study provides a strong foundation for further mechanistic studies that will elucidate the molecular drivers of PD.


Conflict of interest statement

The authors declare no competing interests.

Figures

Fig. 1
Fig. 1
Enrichment of tissues and cell types in Parkinson’s disease (PD). a Study design. Using PD genome-wide association studies (GWAS) summary statistics and gene expression datasets to: (1) identify tissues and cell types enriched in PD GWAS signal, and (2) to identify genes and mechanisms through which PD-associated loci act to affect disease risk. b Linkage disequilibrium (LD) score regression in specifically expressed genes (LD-SEG) analysis applied to late-onset AD (17,008 cases and 37,154 controls) and PD (13,708 cases and 95,282 controls) GWAS summary statistics. Top panel: Regions of the genome with specific expression in central nervous system (CNS) tissues are highly enriched for PD GWAS signal, among 53 tissues obtained from the Genotype-Tissue expression project (GTEx). Shown in red bars are CNS tissues. Six CNS tissues (amygdala, substantia nigra, anterior cingulate cortex, frontal cortex, hypothalamus, and cervical (C1) spinal cord) are significant at 5% false discovery rate (FDR) (dotted line). Bottom panel: LD-SEG analysis using immune cells from the ImmGen Consortium. c Enrichment of gene expression, splicing, methylation and chromatin quantitative loci (QTL) in PD GWAS (p value < 10–5) across tissues and cell types with GARFIELD. GARFIELD leverages GWAS signal with functional annotations to find features such as QTL annotations relevant to a phenotype of interest. All molecular QTLs were enriched in PD-associated variants, and that brain splicing QTLs (sQTLs) showed the strongest enrichment in PD-associated variants among all molecular QTLs
Fig. 2
Fig. 2
Transcriptome-wide association study of Parkinson’s disease (PD). a Manhattan plot of PD transcriptome-wide association study (TWAS) using gene expression models from peripheral monocytes,,. Each point represents a single gene tested, with physical position plotted on the x-axis and Z-score of association between gene expression or intronic splicing with PD plotted on the y-axis. Colored (black or blue) points represent significant association to PD at 5% false discovery rate (FDR). Genes that are also identified with TWAS models from prefrontal cortex are labeled with black points. b Manhattan plot of PD TWAS using expression and splicing models from dorsolateral prefrontal cortex (CommonMind Consortium (CMC)). Genes associated through variation in gene expression and splicing are labeled with blue and green points, respectively. Genes that are also identified with TWAS models from monocytes are labeled with black points. c Boxplot showing the association between a single-nucleotide polymorphism (SNP) (rs76904798) that tags the PD genome-wide association studies (GWAS) risk loci at LRRK2 and gene expression level of LRRK2 in monocytes (top) and dorsolateral prefrontal cortex (DLPFC) (bottom). rs76904798 is significantly associated with the expression level of LRRK2 in monocytes, but not in DLFPC. d LocusZoom plot for the region surrounding LRRK2 shows colocalization of the monocytes LRRK2 expression quantitative loci (eQTL) (top) and PD GWAS association signal (bottom). eg Ternary plots showing coloc posterior probabilities that TWAS loci found using RNA expression in monocytes, RNA expression in DLPFC, and RNA splicing in DLPFC, respectively, belong to different sharing configurations (colocalizing, independent, or underpowered). We considered H0 + H1 + H2 as evidence for the lack of test power. H0: no causal variant, H1: causal variant for PD GWAS only, H2: causal variant for QTL only, H3: two distinct causal variants, H4: one common causal variant
Fig. 3
Fig. 3
Parkinson’s disease (PD) risk alleles affect splicing of nearby genes. a Replication of transcriptome-wide association study (TWAS) Z-score across two PD cohorts (23andMe and IPDGC). b TWAS signal at the MAPT locus is explained by the single-nucleotide polymorphisms (SNP) rs17665188, which is associated with MAPT exon 3 inclusion levels. rs17665188 tags the known H1/H2 haplotypes, which have been shown to be associated with PD. The T allele, which tags the H2 haplotype, doubles inclusion of exon 3 and is associated with increased risk for PD. c PD TWAS signal at the MAPT locus (gray) and TWAS signal after removing the effect of MAPT exon 3 inclusion (cyan). This analysis shows that the association is largely explained by MAPT exon 3 inclusion. d Heatmap of genes identified from our TWAS analysis using imputed RNA splicing and expression (splicing and expression, respectively). The rows “splicing minus exp” and “exp minus splicing” denote association strengths after conditioning on expression and splicing, respectively. SNCA is the only gene associated with PD through both a genetic effect on RNA splicing and expression. e PD-associated variants at the MTOR locus are associated with an increase in a minor MTOR isoform that extends the 5′ of an exon in the 5′-untranslated region (5′-UTR)
Fig. 4
Fig. 4
Proteins nominated by Parkinson’s disease transcriptome-wide association study (PD TWAS) form expanded protein-protein interaction (PPI) and are enriched in the lysosomal pathway. a The PPI network connectivity are statistically significant (p < 7.2 × 10−3) and form two communities (represented by blue and red nodes). b We also applied GeNets to evaluate PPI network connectivity between protein products nominated by PD TWAS and monogenic genes. We found that they form a significantly expanded PPI (p < 2.3 × 10−3) network with known PD genes with four communities (represented by blue, green, orange, and red nodes)

References

    1. Spillantini MG, Crowther RA, Jakes R, Hasegawa M, Goedert M. α-Synuclein in filamentous inclusions of Lewy bodies from Parkinson’s disease and dementia with Lewy bodies. Proc. Natl. Acad. Sci. USA. 1998;95:6469–6473. doi: 10.1073/pnas.95.11.6469. - DOI - PMC - PubMed
    1. Lesage S, Brice A. Parkinson’s disease: from monogenic forms to genetic susceptibility factors. Hum. Mol. Genet. 2009;18:R48–R59. doi: 10.1093/hmg/ddp012. - DOI - PubMed
    1. Chang D, et al. A meta-analysis of genome-wide association studies identifies 17 new Parkinson’s disease risk loci. Nat. Genet. 2017;49:1511–1516. doi: 10.1038/ng.3955. - DOI - PMC - PubMed
    1. Lewis PA, Cookson MR. Gene expression in the Parkinson’s disease brain. Brain Res. Bull. 2012;88:302–312. doi: 10.1016/j.brainresbull.2011.11.016. - DOI - PMC - PubMed
    1. Latourelle JC, Dumitriu A, Hadzi TC, Beach TG, Myers RH. Evaluation of Parkinson disease risk variants as expression-QTLs. PLoS ONE. 2012;7:e46199. doi: 10.1371/journal.pone.0046199. - DOI - PMC - PubMed

Publication types