. 2019 Mar 1;9(1):3241.
doi: 10.1038/s41598-019-40092-w.

Lifeact-GFP alters F-actin organization, cellular morphology and biophysical behaviour

Affiliations

Lifeact-GFP alters F-actin organization, cellular morphology and biophysical behaviour

Luis R Flores et al. Sci Rep. .

Erratum in

Abstract

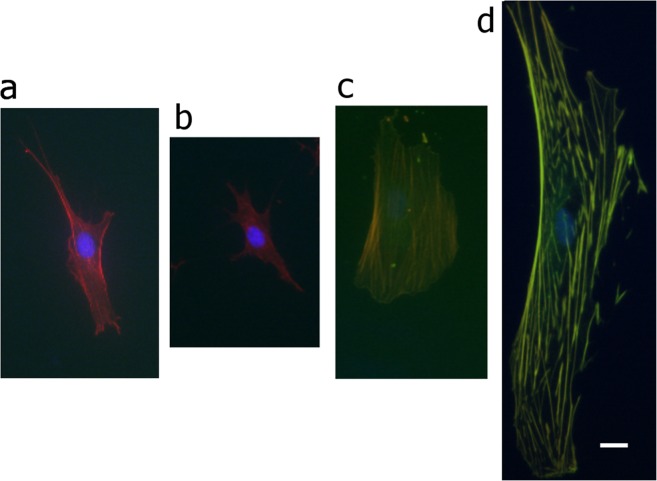
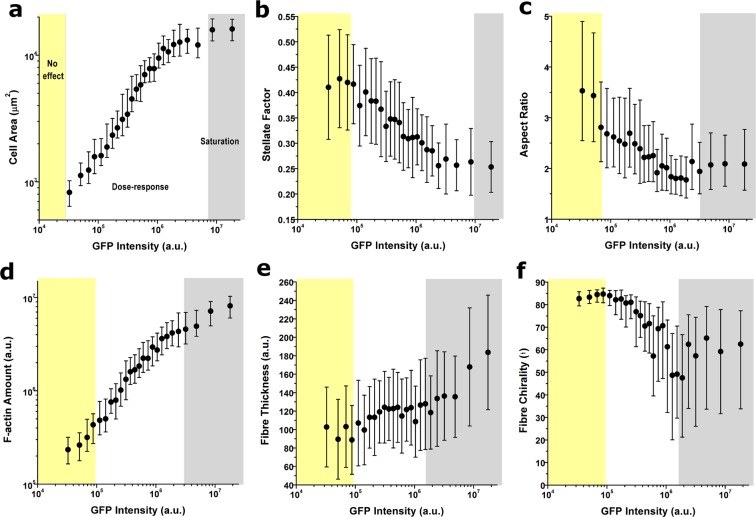
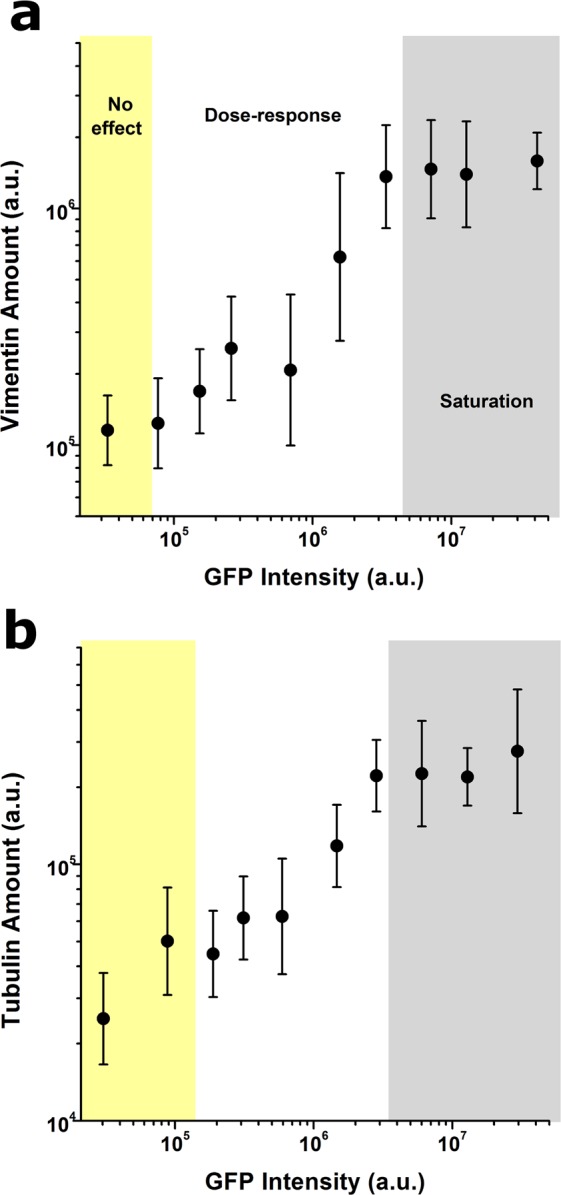
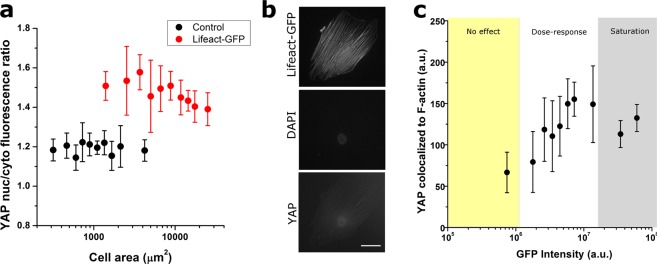
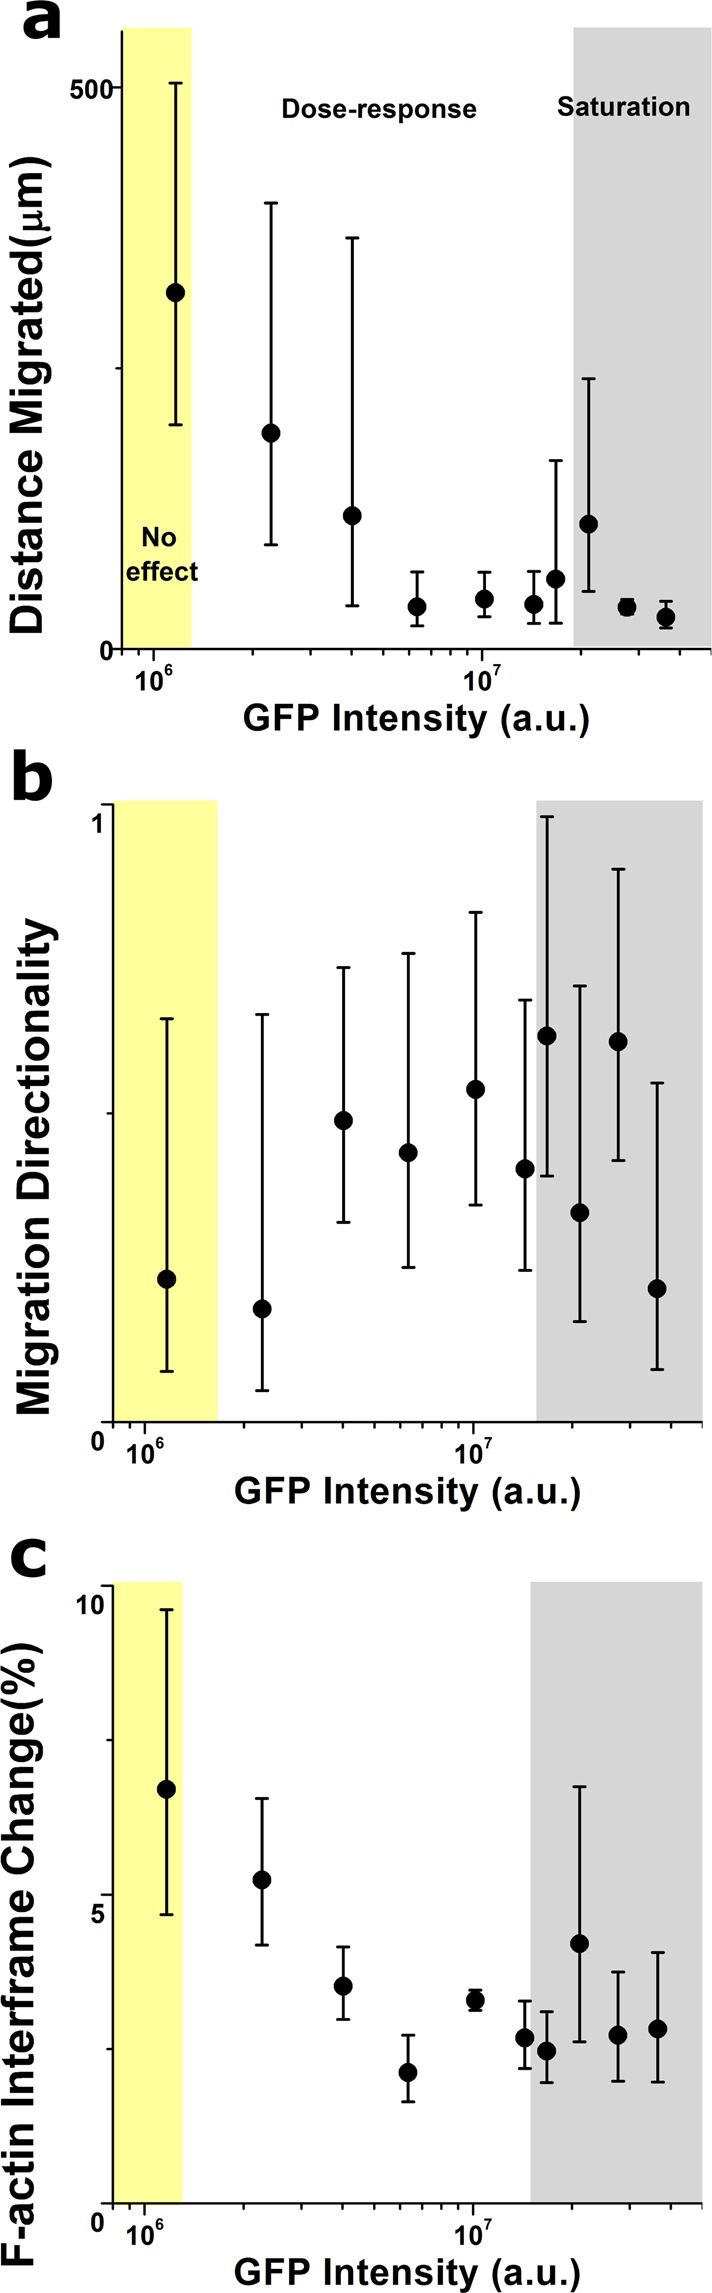
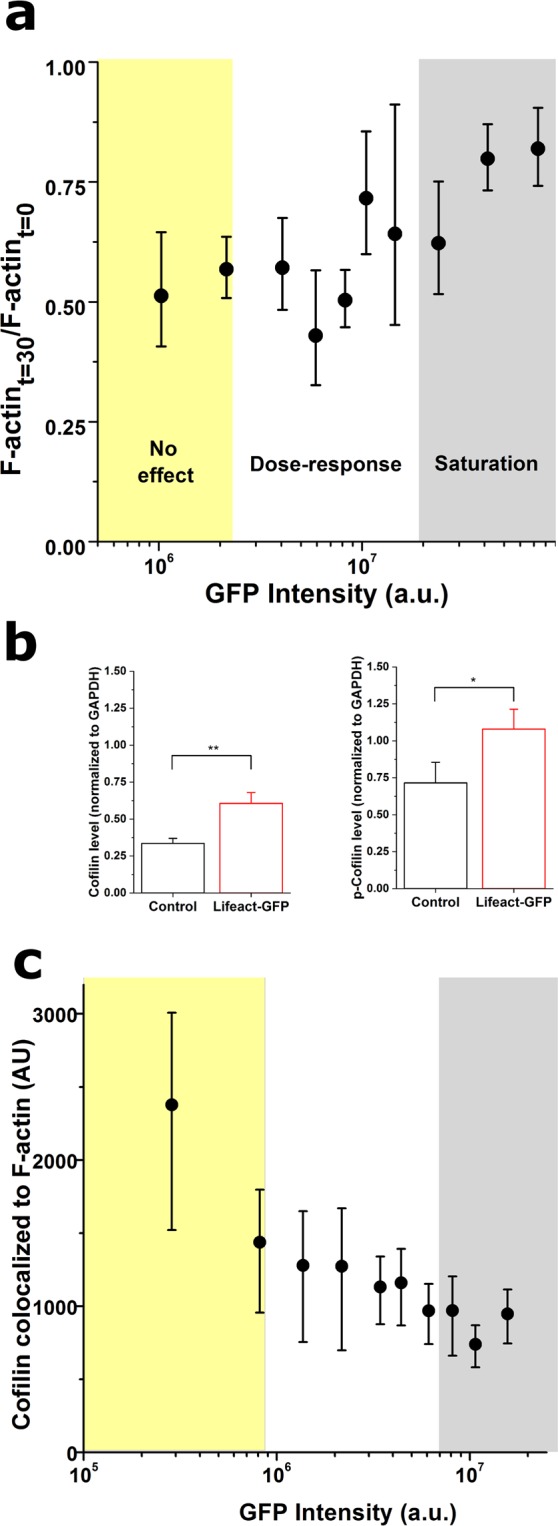
Live-imaging techniques are at the forefront of biology research to explore behaviour and function from sub-cellular to whole organism scales. These methods rely on intracellular fluorescent probes to label specific proteins, which are commonly assumed to only introduce artefacts at concentrations far-exceeding routine use. Lifeact, a small peptide with affinity for actin microfilaments has become a gold standard in live cell imaging of the cytoskeleton. Nevertheless, recent reports have raised concerns on Lifeact-associated artefacts at the molecular and whole organism level. We show here that Lifeact induces dose-response artefacts at the cellular level, impacting stress fibre dynamics and actin cytoskeleton architecture. These effects extend to the microtubule and intermediate filament networks as well as the nucleus, and ultimately lead to altered subcellular localization of YAP, reduced cell migration and abnormal mechanical properties. Our results suggest that reduced binding of cofilin to actin filaments may be the underlying cause of the observed Lifeact-induced cellular artefacts.


Conflict of interest statement

The authors declare no competing interests.

Figures

Figure 1
Figure 1
Characteristic phenotypes of cells expressing increasing amounts of Lifeact-TagGFP2 and co-stained with phalloidin-TRITC and DAPI. (a) Cell cultured on a coverslip dish that was not transduced, (b) cell sorted as ‘no-effect regime’, (c) cell sorted as ‘dose-response-regime’, (d) cell sorted as ‘saturation plateau’. Scale bar corresponds to 15 µm and is the same for all cells pictured.
Figure 2
Figure 2
Dose-response curves quantifying the effect of Lifeact expression in cell spread area (a), cell perimeter stellate factor (b), aspect ratio (c), f-actin amount (d), fibre thickness (d) and chirality of fibres (f). Values for >100 cells were pooled together to compute each individual data point. Data is presented as geometric mean (a,d), mean (b,e) or median (c,f) error bars indicate geometric standard deviation, standard deviation or Q1-Q3, accordingly. Background colours indicate the regimes where cells display no Lifeact-induced effect (yellow background), a dose-response trend (white background) and a saturation plateau (gray background), as identified from analyses of peak changes in variability in the neighbourhood of each point for each parameter plotted.
Figure 3
Figure 3
Lifeact-driven effects extend to non-actin-based cytoskeletal networks. Quantification of Lifeact effects on intermediate filaments assembly (a) and microtubule assembly (b). Values for >40 cells were pooled together to compute each individual data point. Data is presented as geometric mean, error bars indicate geometric standard deviation. Background colours indicate the regimes where cells display no Lifeact-induced effect (yellow background), a dose-response trend (white background) and a saturation plateau (gray background), as identified from analyses of peak changes in variability in the neighbourhood of each point for each parameter plotted.
Figure 4
Figure 4
Lifeact-driven effects modulate nuclear state. Quantification of Lifeact effects on nuclear volume (a) nuclear Poisson’s Ratio (b). Values for >40 cells were pooled together to compute each individual data point. Data is presented as mean, error bars indicate standard deviation. Background colours indicate the regimes where cells display no Lifeact-induced effect (yellow background), a dose-response trend (white background) and a saturation plateau (gray background), as identified from analyses of peak changes in variability in the neighbourhood of each point for each parameter plotted.
Figure 5
Figure 5
Lifeact expression alters cellular mechanical properties. Lifeact dose dependent effects on cell stiffness (a), and viscosity (b) Values for >10 cells were pooled to compute each individual data point. Data is presented as geometric mean, error bars indicate geometric standard deviation. Background colours indicate the regimes where cells display no Lifeact-induced effect (yellow background), a dose-response trend (white background) and a saturation plateau (gray background), as identified from analyses of peak changes in variability in the neighbourhood of each point for each parameter plotted.
Figure 6
Figure 6
Lifeact expression alters intracellular localization of YAP. Ratio of nuclear to cytoplasmic YAP localization according to Lifeact-TagGFP2 cellular fluorescence (a) and cell area (b). In (b), black symbols correspond to cells not transduced (control) and red symbols correspond to cells transduced with Lifeact-TagGFP2. (c) Example cells displaying localization of YAP staining to Lifeact-containing stress fibres. The cell on the left was transduced with Lifeact and the cell on the right was not transduced. After fixation, cells were stained with DAPI (middle panels) and against YAP (bottom panels). Scale bar is 50 µm. (d) Average pixel intentisty of YAP fluorescence colocalized to Lifeact-containing stress fibres is dependant on the total amount of Lifeact expressed in the cell. Data is presented as mean, error bars indicate standard deviation. For (a) and (d), background colours indicate the regimes where cells display no Lifeact-induced effect (yellow background), a dose-response trend (white background) and a saturation plateau (gray background), as identified from analyses of peak changes in variability in the neighbourhood of each point for each parameter plotted. Values for >12 cells were pooled to compute each individual data point.
Figure 7
Figure 7
Lifeact expression alters cell migration and F-actin dynamics. Lifeact dose dependent effects on distance migrated (a), directionality of migration (b) and F-actin inter-frame changes (c). Values for >5 cells were pooled to compute each individual data point. Data is presented as geometric mean, error bars indicate geometric standard deviation. Background colours indicate the regimes where cells display no Lifeact-induced effect (yellow background), a dose-response trend (white background) and a saturation plateau (gray background), as identified from analyses of peak changes in variability in the neighbourhood of each point for each parameter plotted.
Figure 8
Figure 8
Lifeact expression alters cofilin activity. (a) Lifeact dose dependent effects on F-actin disassembly after 30 min of Latrunculin A (0.075 µg/ml) treatment. (b) Western blot results for cofilin and p-cofilin expression levels relative to GADPH. (c) Lifeact dose dependent effects on fluorescence intensities of cofilin colocalized to F-actin fibres. For (a) and (c), data is presented as median, error bars indicate Q1-Q3, N > 100 cells; for (b) data is presented as mean, error bars indicate standard deviation, N = 3 repeats.

References

    1. Riedl J, et al. Lifeact: a versatile marker to visualize F-actin. Nat. Methods. 2008;5:605–607. doi: 10.1038/nmeth.1220. - DOI - PMC - PubMed
    1. Munsie LN, Caron N, Desmond CR, Truant R. Lifeact cannot visualize some forms of stress-induced twisted f-actin. Nat. Methods. 2009;6:317. doi: 10.1038/nmeth0509-317. - DOI - PubMed
    1. Melak M, Plessner M, Grosse R. Actin visualization at a glance. J. Cell Sci. 2017;130:525–530. doi: 10.1242/jcs.189068. - DOI - PubMed
    1. Belin BJ, Cimini BA, Blackburn EH, Mullins RD. Visualization of actin filaments and monomers in somatic cell nuclei. Mol. Biol. Cell. 2013;24:982–994. doi: 10.1091/mbc.e12-09-0685. - DOI - PMC - PubMed
    1. Lemieux MG, et al. Visualization of the actin cytoskeleton: different F-actin-binding probes tell different stories. Cytoskeleton. 2014;71:157–169. doi: 10.1002/cm.21160. - DOI - PubMed

Publication types

LinkOut - more resources