. 2019 Mar 1;9(1):3266.
doi: 10.1038/s41598-019-39796-w.

Selecting variants of unknown significance through network-based gene-association significantly improves risk prediction for disease-control cohorts

Affiliations

Selecting variants of unknown significance through network-based gene-association significantly improves risk prediction for disease-control cohorts

Anastasis Oulas et al. Sci Rep. .

Abstract

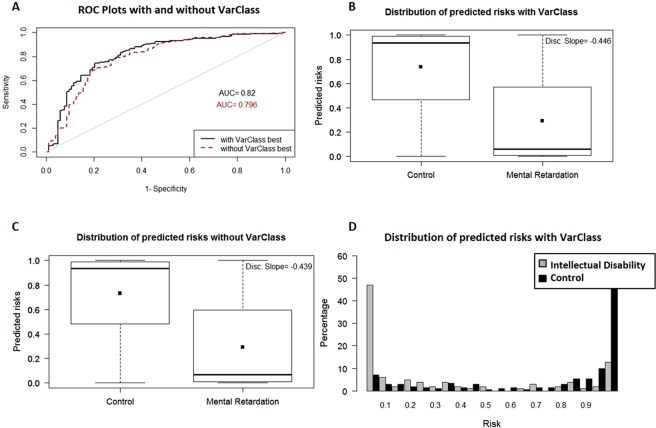
Variants of unknown/uncertain significance (VUS) pose a huge dilemma in current genetic variation screening methods and genetic counselling. Driven by methods of next generation sequencing (NGS) such as whole exome sequencing (WES), a plethora of VUS are being detected in research laboratories as well as in the health sector. Motivated by this overabundance of VUS, we propose a novel computational methodology, termed VariantClassifier (VarClass), which utilizes gene-association networks and polygenic risk prediction models to shed light into this grey area of genetic variation in association with disease. VarClass has been evaluated using numerous validation steps and proves to be very successful in assigning significance to VUS in association with specific diseases of interest. Notably, using VUS that are deemed significant by VarClass, we improved risk prediction accuracy in four large case-studies involving disease-control cohorts from GWAS as well as WES, when compared to traditional odds ratio analysis. Biological interpretation of selected high scoring VUS revealed interesting biological themes relevant to the diseases under investigation. VarClass is available as a standalone tool for large-scale data analyses, as well as a web-server with additional functionalities through a user-friendly graphical interface.


Conflict of interest statement

The authors declare no competing interests.

Figures

Figure 1
Figure 1
VarClass Methodology Flowchart. Step1 - Selecting disease direction/profile – The VarClass approach requires a general disease direction to initiate the pipeline (e.g. Parkinson’s). Step 2 - Extracting relevant information from ClinVar – The relevant information by simple SQL querying, is extracted from ClinVar. Step 3 - Network Construction – The gene information (gene symbols) extracted from all entries associated with the disease profile (as defined in steps 1 and 2) are used to construct the backbone of five different types of gene-to-gene networks using GeneMANIA. Step 4 - Placing unknown variants on the networks – unknown variants (e.g. variant: rs3172404 in gene: CLDN1) are placed iteratively on all five networks by means of gene association. Step 5 - Defining the sub-network of informative variants – Firstly, this step involves the selection for the top 2 neighbours of the gene harbouring the VUS. These neighbours are next used for prediction of clinical outcome for VUS (e.g. Parkinson’s). Secondly, the subnetwork is further expanded by selecting the 2nd order neighbours (i.e. neighbours of the top 2 neighbouring genes), hence adding even more informative genes for the next processing steps of the analysis pipeline (these genes are shown in the first light blue table). Step 6 - Extract variant IDs from real data – this next step involves the use of real GWAS/WES data and adding all the variants from the GWAS/WES datasets to their corresponding genes present in the selected subnetwork(s) (genes and variants are shown in the second light blue table). Step 7 - Using variants derived from sub-networks for risk prediction – The variants obtained from the sub-network are used in the risk model construction using the genotypes from all disease and control samples in the GWAS/WES study (genotypes are shown in the third light blue table). Two types of risk models are generated. Namely, Model 1 - which contains all the sample genotypes from the variants found in the subnetwork and Model 2 - a second model that contains all genotypes without the genotypes of the VUS that is under investigation at that given iteration. The difference in AUC, NRI and IDI between the two models provides a means of assessing the contribution of the VUS under investigation (model statistics are shown in the fourth light blue table). (B) Details on subnetwork selection process (Step 5) using specific example from Parkinson’s WES. The green nodes represent genes found in gene-gene co-expression network, which achieves significant results for this specific variant iteration. The yellow nodes represent the gene/variant been analysed in this VarClass iteration as well as the accompanying selected genes that ultimately make up the synergistic group in the final subnetwork. The selection process entails a 2 stage process, first neighbours with maximum number of edges are selected and then the second order neighbours of these genes are also selected. Finally, the genes/nodes with available genotype information from the WES data are selected to construct the final subnetwork for downstream risk assessment analysis.
Figure 2
Figure 2
VarClass Score for Selecting Pro-disease and Protective Variants. VarClass output showing True versus Mock (imputed) variants distribution using IDI score for the validation cohorts GSE8055 (n = 928) and GSE8054 (n = 1189), known to be associated with Pancreatic Cancer. T-test results: t = 13.345 for df = 3212.6, and a p-value: < 2.2e-16. The brown gradient arrow and dashed lines show the selected cut-offs of 0.02 and −0.02 for pro-disease and protective variants respectively.
Figure 3
Figure 3
VarClass improvement of Risk Production for Parkinson’s dataset. (A) ROC curve showing classification of Parkinson’s disease and normal samples. Black and red lines denote logistic binomial regression classification when including and excluding informative VarClass variants. The green dotted line shows prediction accuracy from including random variants to the baseline odds ratio variants for this dataset (B) Boxplot showing predicted risk mean and standard deviation for disease and control samples when including VarClass variants in the analysis. (C) Boxplot showing predicted risk mean and standard deviation for disease and control samples without including VarClass variants in the analysis. Boxplots discrimination slopes (Disc. Slope - difference between means of disease and normal populations) show a greater discrimination capacity between disease and normal samples when VarClass variants are included in the risk prediction model (0.482) and a drop in discrimination slope (0.426) when excluding the variants from the model. (D) The risk score distribution statistics for disease (black histogram) and control (grey histogram) including VarClass variants in the analysis.
Figure 4
Figure 4
VarClass improvement of Risk Production for Gastric Cancer dataset. (A) ROC curve showing classification of gastric cancer and normal samples from GSE58356 dataset. Black and red lines denote logistic binomial regression classification when including and excluding informative VarClass variants. (B) Boxplot showing predicted risk mean and standard deviation for disease and control samples when including VarClass variants in the analysis. (C) Boxplot showing predicted risk mean and standard deviation for disease and control samples without including VarClass variants in the analysis. Discrimination slope provides a measure of quantification for the change in statistics. Showing a greater discrimination capacity between disease and normal samples when VarClass variants are included in the risk prediction model (0.345) and a drop in discrimination slope (0.24) when excluding the variants from the model. (D) The risk score distribution statistics for disease (black histogram) and control (grey histogram) including VarClass variants in the analysis.
Figure 5
Figure 5
VarClass improvement of Risk Production for Intellectual Disability GSE7226-GPL2005 dataset. (A) ROC curve showing classification of intellectual disability and normal samples from GSE7226-GPL2005 dataset. Black and red lines denote logistic binomial regression classification when including and excluding VarClass protective variants. IDI [95% CI]: 0.0344 [0.011–0.058]; p-value: 3.5e-3. (B) Boxplot showing predicted risk mean and standard deviation for disease and control samples when including VarClass variants in the analysis. (C) Boxplot showing predicted risk mean and standard deviation for disease and control samples without including VarClass variants in the analysis. Discrimination slope provides a measure of quantification for the change in statistics. Showing a greater discrimination capacity between disease and normal samples when VarClass variants are included in the risk prediction model (−0.446) and a drop in discrimination slope (−0.439) when excluding the variants from the model. (D) The risk score distribution statistics for disease (grey histogram) and control (black histogram) including VarClass variants in the analysis.
Figure 6
Figure 6
VarClass improvement of Risk Production for Intellectual Disability GSE7226-GPL2004 dataset. (A) ROC curve showing classification of intellectual disability and normal samples from GSE7226-GPL2004 dataset. Black and red lines denote logistic binomial regression classification when including and excluding VarClass protective variants. IDI [95% CI]: 0.0419 [−0.003–0.087]; p-value: 0.069. (B) Boxplot showing predicted risk mean and standard deviation for disease and control samples when including VarClass variants in the analysis. (C) Boxplot showing predicted risk mean and standard deviation for disease and control samples without including VarClass variants in the analysis. Discrimination slope provides a measure of quantification for the change in statistics. Showing a greater discrimination capacity between disease and normal samples when VarClass variants are included in the risk prediction model (−0.32) and drop in discrimination slope (−0.315) when excluding the variants from the model. (D) The risk score distribution statistics for disease (grey histogram) and control (black histogram) including VarClass variants in the analysis.

Similar articles

Cited by

References

    1. Richter S, et al. Variants of unknown significance in BRCA testing: impact on risk perception, worry, prevention and counseling. Ann Oncol. 2013;24(Suppl 8):viii69–viii74. doi: 10.1093/annonc/mdt312. - DOI - PubMed
    1. Cheon JY, Mozersky J, Cook-Deegan R. Variants of uncertain significance in BRCA: a harbinger of ethical and policy issues to come? Genome Med. 2014;6:121. doi: 10.1186/s13073-014-0121-3. - DOI - PMC - PubMed
    1. Campuzano O, Allegue C, Fernandez A, Iglesias A, Brugada R. Determining the pathogenicity of genetic variants associated with cardiac channelopathies. Sci Rep. 2015;5:7953. doi: 10.1038/srep07953. - DOI - PMC - PubMed
    1. Schulz WL, Tormey CA, Torres R. Computational Approach to Annotating Variants of Unknown Significance in Clinical Next Generation Sequencing. Lab Med. 2015;46:285–9. doi: 10.1309/LMWZH57BRWOPR5RQ. - DOI - PubMed
    1. Eoh KJ, et al. Comparison of Clinical Outcomes of BRCA1/2 Pathologic Mutation, Variants of Unknown Significance, or Wild Type Epithelial Ovarian Cancer Patients. Cancer Res Treat. 2017;49:408–415. doi: 10.4143/crt.2016.135. - DOI - PMC - PubMed

Publication types