

Analysis of the wnt1 regulatory chromosomal landscape
- PMID: 30825002
- PMCID: PMC6500750
- DOI: 10.1007/s00427-019-00629-5
Analysis of the wnt1 regulatory chromosomal landscape
Abstract
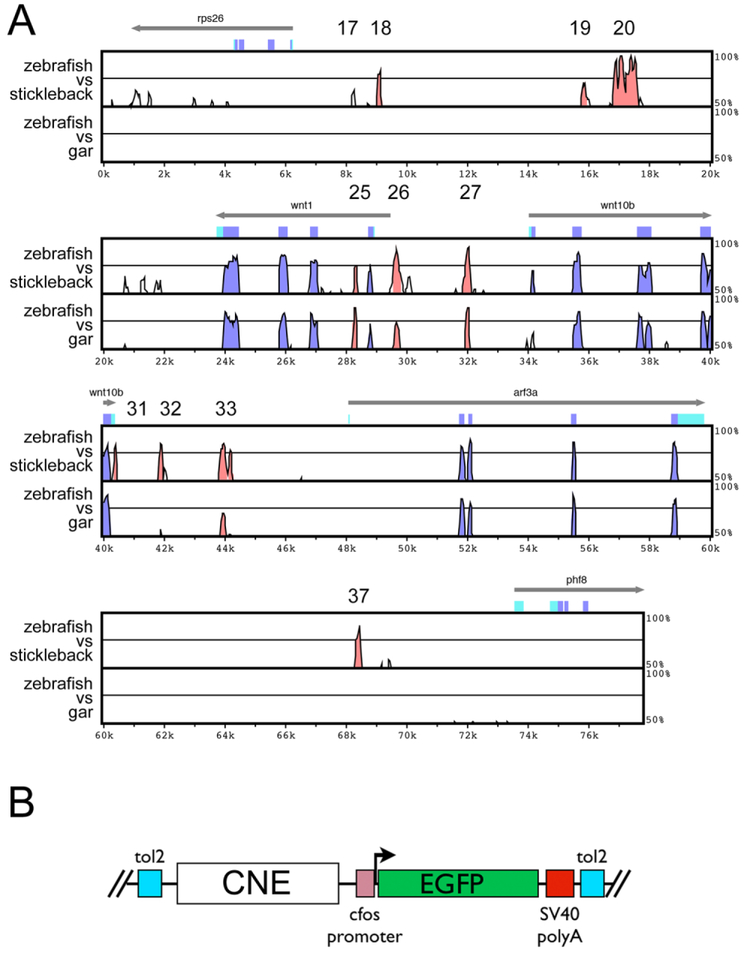
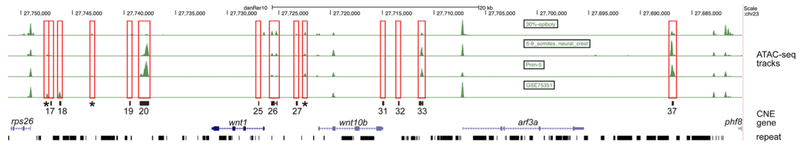
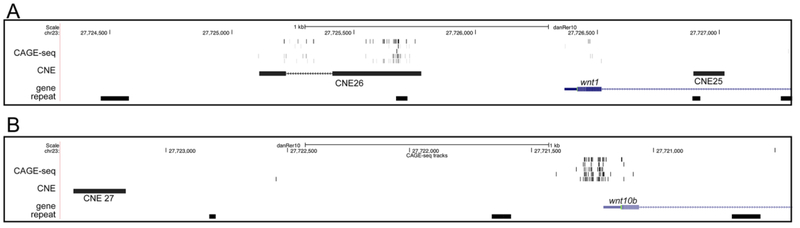
One of the earliest patterning events in the vertebrate neural plate is the specification of mes/r1, the territory comprising the prospective mesencephalon and the first hindbrain rhombomere. Within mes/r1, an interface of gene expression defines the midbrain-hindbrain boundary (MHB), a lineage restriction that separates the mesencephalon and rhombencephalon. wnt1 is critical to mes/r1 development and functions within the MHB as a component of the MHB gene regulatory network (GRN). Despite its importance to these critical and early steps of vertebrate neurogenesis, little is known about the factors responsible for wnt1 transcriptional regulation. In the zebrafish, wnt1 and its neighboring paralog, wnt10b, are expressed in largely overlapping patterns, suggesting co-regulation. To understand wnt1 and wnt10b transcriptional control, we used a comparative genomics approach to identify relevant enhancers. We show that the wnt1-wnt10b locus contains multiple cis-regulatory elements that likely interact to generate the wnt1 and wnt10b expression patterns. Two of 11 conserved enhancers tested show activity restricted to the midbrain and MHB, an activity that is conserved in the distantly related spotted gar orthologous elements. Three non-conserved elements also play a likely role in wnt1 regulation. The identified enhancers display dynamic modes of chromatin accessibility, suggesting controlled deployment during embryogenesis. Our results suggest that the control of wnt1 and wnt10b expression is under complex regulation involving the interaction of multiple enhancers.
Keywords: ATAC-seq; CAGE-seq; Cis-regulation; Conserved non-coding element; Neural patterning; Spotted gar; Vertebrate; Zebrafish; wnt1; wnt10b.
Figures


Similar articles
-
Wnt1 and wnt10b function redundantly at the zebrafish midbrain-hindbrain boundary.Dev Biol. 2003 Feb 15;254(2):172-87. doi: 10.1016/s0012-1606(02)00044-1. Dev Biol. 2003. PMID: 12591239
-
Combinatorial Wnt control of zebrafish midbrain-hindbrain boundary formation.Mech Dev. 2004 May;121(5):437-47. doi: 10.1016/j.mod.2004.03.026. Mech Dev. 2004. PMID: 15147762
-
Wnt signaling regulates neural plate patterning in distinct temporal phases with dynamic transcriptional outputs.Dev Biol. 2020 Jun 15;462(2):152-164. doi: 10.1016/j.ydbio.2020.03.016. Epub 2020 Mar 31. Dev Biol. 2020. PMID: 32243887 Free PMC article.
-
Midbrain-Hindbrain Boundary Morphogenesis: At the Intersection of Wnt and Fgf Signaling.Front Neuroanat. 2017 Aug 3;11:64. doi: 10.3389/fnana.2017.00064. eCollection 2017. Front Neuroanat. 2017. PMID: 28824384 Free PMC article. Review.
-
Novel mechanisms that pattern and shape the midbrain-hindbrain boundary.Cell Mol Life Sci. 2013 Sep;70(18):3365-74. doi: 10.1007/s00018-012-1240-x. Epub 2013 Jan 10. Cell Mol Life Sci. 2013. PMID: 23307071 Free PMC article. Review.
Cited by
-
Placental DNA methylation profile as predicting marker for autism spectrum disorder (ASD).Mol Med. 2023 Jan 16;29(1):8. doi: 10.1186/s10020-022-00593-3. Mol Med. 2023. PMID: 36647002 Free PMC article. Review.
-
Building a three-dimensional model of early-stage zebrafish embryo brain.Biophys Rep (N Y). 2021 Sep 8;1(1):100003. doi: 10.1016/j.bpr.2021.100003. Epub 2021 Jul 19. Biophys Rep (N Y). 2021. PMID: 34693392 Free PMC article.
-
Functional annotations of three domestic animal genomes provide vital resources for comparative and agricultural research.Nat Commun. 2021 Mar 23;12(1):1821. doi: 10.1038/s41467-021-22100-8. Nat Commun. 2021. PMID: 33758196 Free PMC article.
References
Publication types
MeSH terms
Substances
Grants and funding
LinkOut - more resources
Full Text Sources
Molecular Biology Databases
Miscellaneous
