. 2019 May 9;70(10):2741-2757.
doi: 10.1093/jxb/erz099.

Functional characterization of chaperonin containing T-complex polypeptide-1 and its conserved and novel substrates in Arabidopsis

Affiliations

Functional characterization of chaperonin containing T-complex polypeptide-1 and its conserved and novel substrates in Arabidopsis

Hee-Kyung Ahn et al. J Exp Bot. .

Abstract

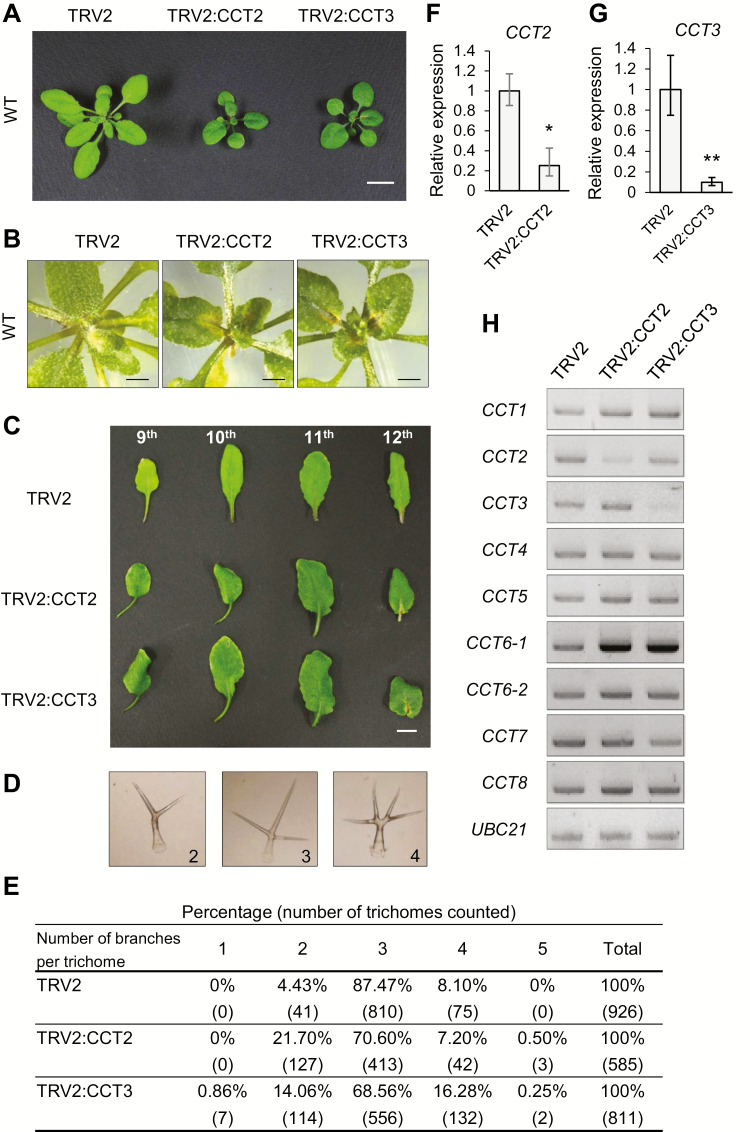
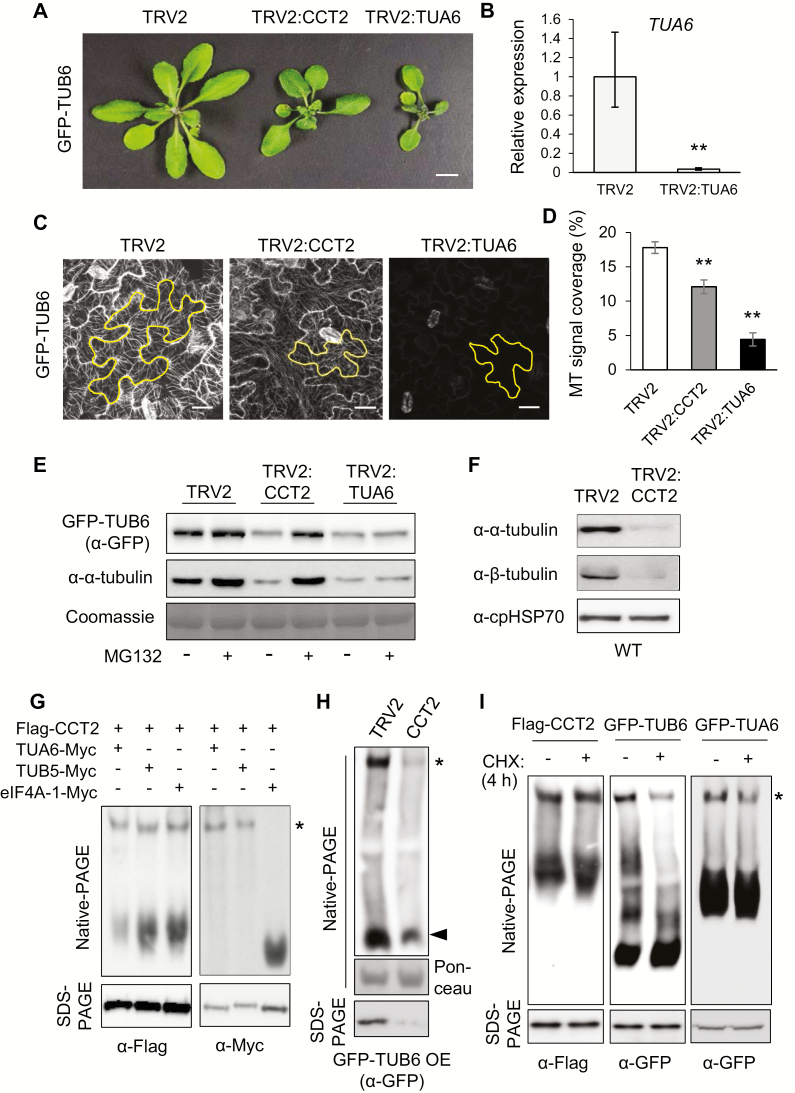
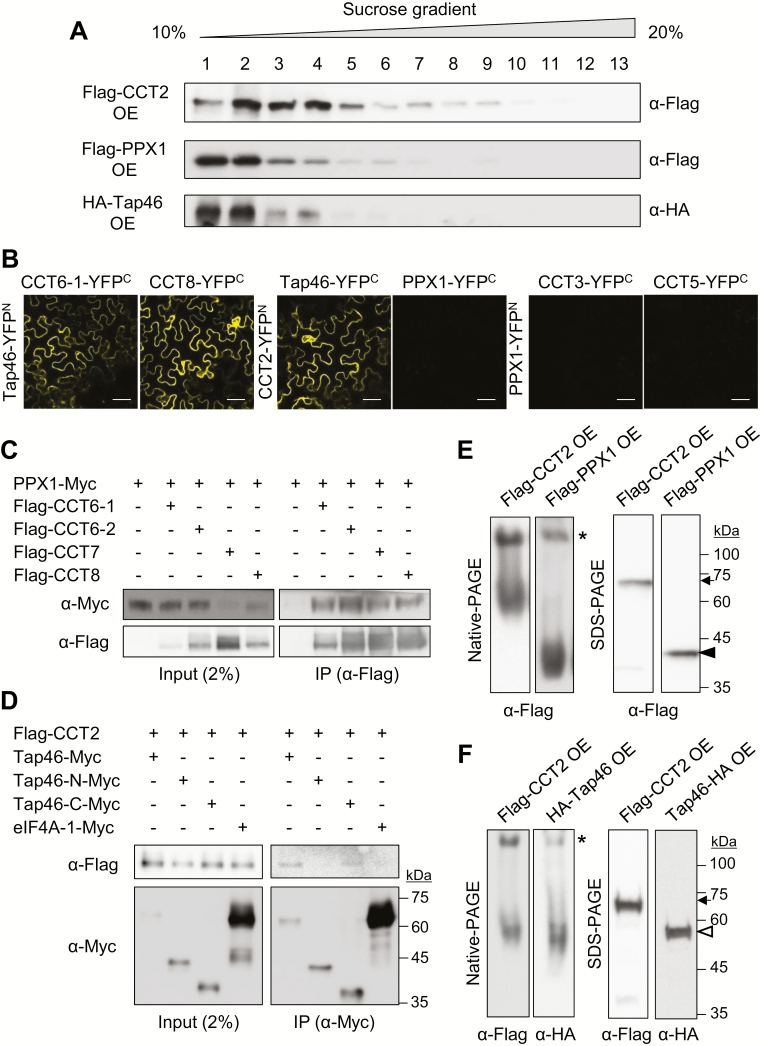
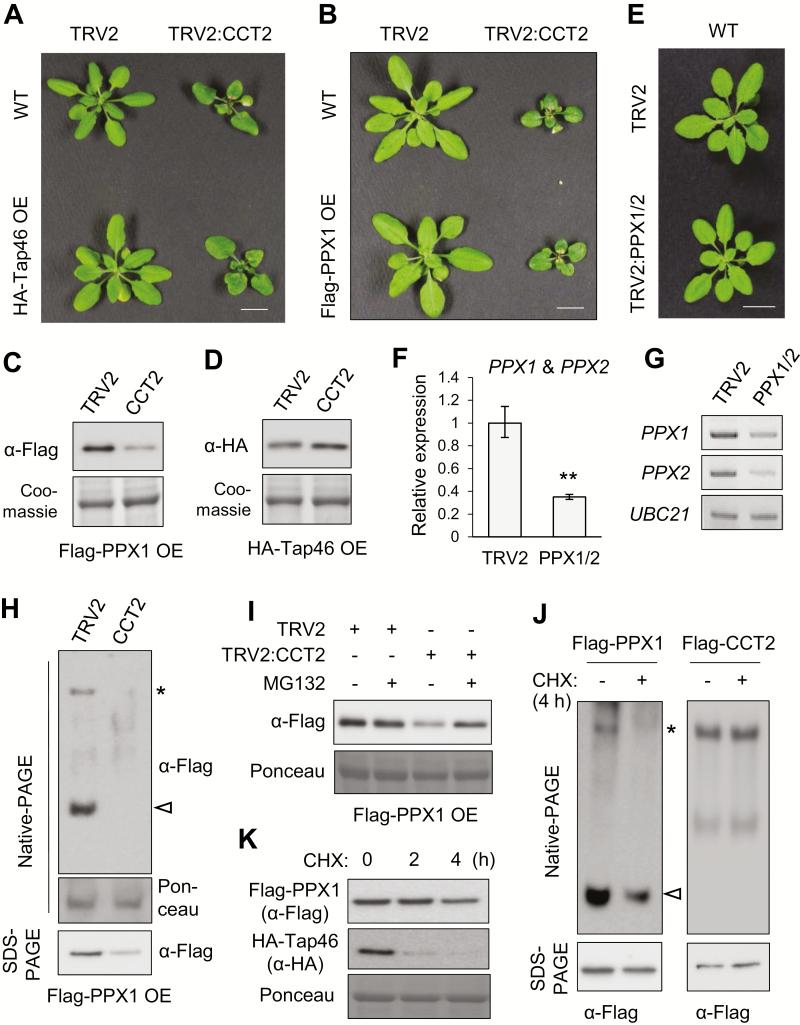
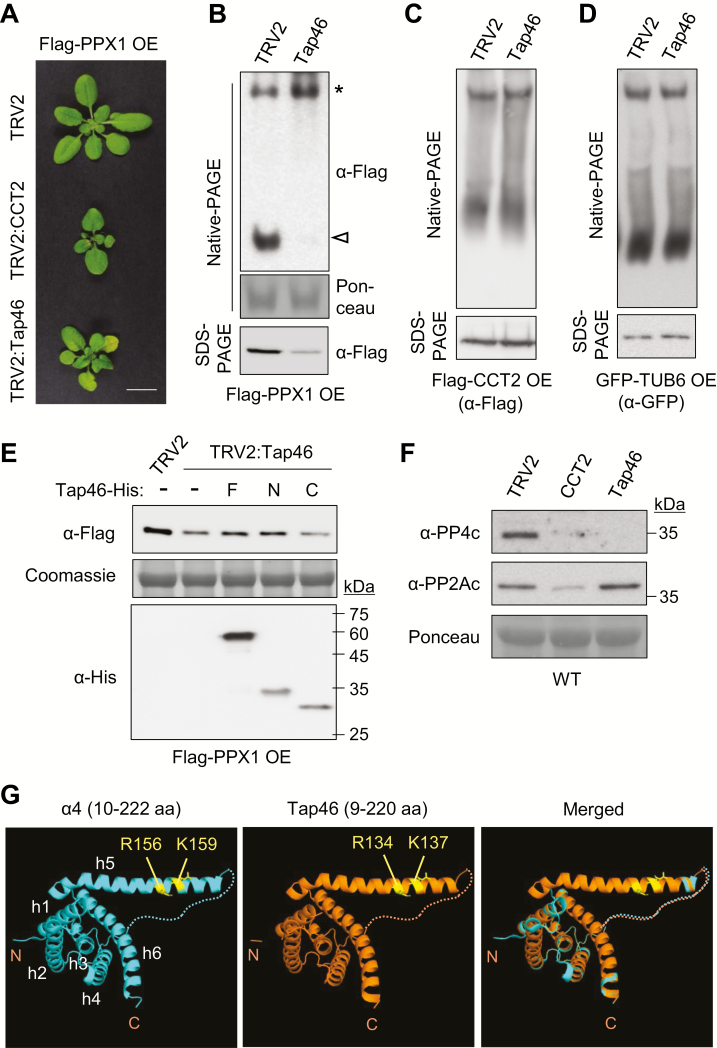
Chaperonin containing T-complex polypeptide-1 (CCT) is an evolutionarily conserved chaperonin multi-subunit complex that mediates protein folding in eukaryotes. It is essential for cell growth and survival in yeast and mammals, with diverse substrate proteins. However, only a few studies on plant CCT have been reported to date, due to the essentiality of CCT subunit genes and the large size of the complex. Here, we have investigated the structure and function of the Arabidopsis CCT complex in detail. The plant CCT consisted of eight subunits that assemble to form a high-molecular-mass protein complex, shown by diverse methods. CCT-deficient cells exhibited depletion of cortical microtubules, accompanied by a reduction in cellular α- and β-tubulin levels due to protein degradation. Cycloheximide-chase assays suggested that CCT is involved in the folding of tubulins in plants. Furthermore, CCT interacted with PPX1, the catalytic subunit of protein phosphatase 4, and may participate in the folding of PPX1 as its substrate. CCT also interacted with Tap46, a regulatory subunit of PP2A family phosphatases, but Tap46 appeared to function in PPX1 stabilization, rather than as a CCT substrate. Collectively, our findings reveal the essential functions of CCT chaperonin in plants and its conserved and novel substrates.

Keywords: CCT chaperonin; PP4 catalytic subunit; TOR signaling pathway; Tap46; tubulin biogenesis; virus-induced gene silencing.


Figures

Fig. 1.
Fig. 1.
CCT subunits function as a complex. (A) Size exclusion chromatography using N. benthamiana leaf extracts that expressed GFP–CCT2. Eleven fractions were collected between the elution volumes of 41 and 51 ml, and subjected to immunoblotting using anti-GFP antibody. GFP–CCT2 is approximately 83 kDa in size (arrow). (B) Sucrose density gradient sedimentation using Arabidopsis Flag–CCT2 overexpression (OE) plants. Extracts of the seedlings at 7 d post-germination (DAG) were mounted on a 10–30% sucrose gradient for ultracentrifugation, followed by immunoblotting of the fractions with anti-Flag and anti-RPN6 antibodies. RPN6 is a subunit of 26S proteasome. Flag–CCT2 is approximately 67 kDa in size (arrow). (C) Native-PAGE and SDS-PAGE. Flag–CCT subunits were expressed transiently in N. benthamiana leaves. The CCT complex (asterisk) and monomeric CCT subunits (bracket) are indicated. (D) Two-dimensional PAGE using N. benthamiana extracts that co-expressed Flag–CCT2 and Flag–CCT4. After native-PAGE (1D) (3.5% gel) and SDS-PAGE (2D), immunoblotting was performed with anti-Flag antibody. The CCT complex (arrow), Flag–CCT2 (white arrowhead) and Flag–CCT4 (black arrowhead) are indicated. (E) Plant phenotypes after virus-induced gene silencing (VIGS) of CCT3 (TRV2:CCT3) in Flag–CCT2 OE plants at 15 DAI. TRV2-infiltrated plants served as the control. Scale bars: 1 cm. (F) RT-qPCR of CCT3 mRNA in the VIGS plants shown in (E). Transcript levels are normalized to those of UBC10 mRNA, and expressed relative to those of TRV2 samples. Values represent mean ±standard error (SE) derived from three biological replicates. Asterisks denote statistical significance of the differences between TRV2 control and TRV2:CCT3 plants calculated using Student’s t-test (**P≤0.01). (G) Native-PAGE and SDS-PAGE using leaf extracts of the VIGS plants shown in (E). Immunoblotting was performed with anti-Flag antibody. Ponceau-stained rbcL was used as a loading control for native-PAGE. The asterisk indicates the CCT complex. (This figure is available in color at JXB online.)
Fig. 2.
Fig. 2.
Depletion of CCT subunits leads to pleiotropic defects in Arabidopsis. (A) Phenotypes after VIGS of CCT2 or CCT3 at 15 DAI. Scale bar: 1 cm. (B) Closer views of the necrotic lesions around the shoot apex of VIGS plants at 15 DAI. Scale bar: 5 mm. (C) Right-handed twist in leaf petioles of the VIGS plants at 21 DAI. The 9th to 12th leaves from cotyledons are shown. Scale bar: 1 cm. (D) Representative light microscopic images of trichomes with different branch numbers. (E) Quantification of trichome branch numbers. Trichomes were harvested from leaves and counted under a light microscope. The percentages of each branch number and numbers of trichomes counted (in parentheses) are shown. (F, G) RT-qPCR of CCT2 (F) and CCT3 (G) mRNAs in VIGS plants. Transcript levels are normalized to those of UBC10 mRNA, and expressed relative to those of TRV2 samples. Values represent mean ±SE derived from three biological replicates. Asterisks denote statistical significance of the differences between TRV2 control and other VIGS plants calculated using Student’s t-test (*P≤0.05; **P≤0.01). (H) Semi-quantitative RT-PCR for CCT subunit genes in the VIGS plants. UBC21 mRNA served as the loading control. (This figure is available in color at JXB online.)
Fig. 3.
Fig. 3.
Tubulins are substrates of the CCT complex in plants. (A) VIGS phenotype of CCT2 and TUA6 in GFP–TUB6 background at 15 DAI. TUA6 encodes α-tubulin isoform 6. Scale bar: 1 cm. (B) RT-qPCR of TUA6 mRNA in TRV2 and TRV2:TUA6 plants shown in (A) at 15 DAI. Transcript levels are normalized to those of UBC10 mRNA, and expressed relative to those of TRV2 samples. Values represent mean ±SE derived from three biological replicates (**P≤0.01). (C) Confocal microscopy of cortical MT arrays in leaf epidermis of the VIGS plants shown in (A) at 18 DAI. The images are projections of a z-stack. One cell in each image is outlined. Scale bar: 20 μm. (D) Cortical MT array density of the VIGS plants. MT density was quantified using ImageJ with 10 cells per sample (**P≤0.01). (E) Immunoblotting with anti-GFP and anti-α-tubulin antibodies in the VIGS plants shown in (A) with or without 4 h treatment with 20 μM MG132. The Rubisco large subunit (rbcL) was stained with Coomassie as the loading control. (F) Immunoblotting with anti-α-tubulin and anti-β-tubulin antibodies in VIGS plants in WT background. Chloroplast HSP70 (cpHSP70) served as the loading control. (G) Native-PAGE and SDS-PAGE of N. benthamiana extracts co-expressing Flag–CCT2 with TUA6–Myc, TUB5–Myc, or eIF4A-1–Myc. eIF4A-1 is the cytosol-localized isoform of eukaryotic translation initiation factor 4A. Immunoblotting was performed with anti-Myc and anti-Flag antibodies. Monomeric TUA6–Myc and TUB5–Myc ran out of the gel due to the long running time. (H) Native-PAGE and SDS-PAGE analyses of VIGS plants in GFP–TUB6 OE background, followed by immunoblotting with anti-GFP antibody. Ponceau-stained rbcL served as the loading control for native-PAGE. (I) Cycloheximide (CHX)–chase assays. Five-day-old Flag–CCT2 OE, GFP–TUB6 OE, and GFP–TUA6 OE seedlings were treated with water (−CHX) or 2 mg ml−1 CHX for 4 h, and subjected to native-PAGE and SDS-PAGE, followed by immunoblotting with anti-Flag and anti-GFP antibodies. (This figure is available in color at JXB online.)
Fig. 4.
Fig. 4.
PPX1 and Tap46 interact with CCT complex. (A) Sucrose density gradient sedimentation using Flag–CCT2 OE, Flag–PPX1 OE, and HA–Tap46 OE plants. Seven-day-old seedling extracts were mounted on a 10–20% sucrose gradient for ultracentrifugation. Thirteen fractions were collected for immunoblotting with anti-Flag or anti-HA antibody. (B) BiFC. YFP signals were observed from N. benthamiana leaf epidermal cells at 2 DAI. Scale bar: 50 μm. Negative controls and protein expression are shown in Supplementary Fig. S5. (C) Co-immunoprecipitation. PPX1–Myc was co-expressed with Flag–CCT6-1, Flag–CCT6-2, Flag–CCT7, or Flag–CCT8 in N. benthamiana leaves. Immunoprecipitation was performed with anti-Flag antibody-conjugated resin, followed by immunoblotting with anti-Myc and anti-Flag antibodies. (D) Co-immunoprecipitation. Flag–CCT2 was co-expressed with Myc-tagged full-length Tap46 (Tap46–Myc), the N-terminal region (Tap46-N–Myc; 1–223 residues), the C-terminal region (Tap46-C–Myc; 224–405 residues), or eIF4A-1 in N. benthamiana leaves. Immunoprecipitation was performed with anti-Myc antibody-conjugated resin, followed by immunoblotting with anti-Myc and anti-Flag antibodies. (E) Native-PAGE and SDS-PAGE using 7-day-old Flag–CCT2 OE and Flag–PPX1 OE seedlings, followed by immunoblotting with anti-Flag antibody. The asterisk, arrow, and black arrowhead indicate the CCT complex, Flag–CCT2, and Flag–PPX1, respectively. Predicted molecular masses of Flag–CCT2 and Flag–PPX1 are ~67 and ~43 kDa, respectively. (F) Native-PAGE and SDS-PAGE using 7-day-old Flag–CCT2 OE and HA–Tap46 OE seedlings, followed by immunoblotting with anti-Flag and anti-HA antibodies. The asterisk, arrow, and white arrowhead indicate CCT complex, Flag–CCT2, and HA–Tap46, respectively. Predicted molecular mass of HA–Tap46 is ~55 kDa. (This figure is available in color at JXB online.)
Fig. 5.
Fig. 5.
PPX1 may be a substrate of plant CCT complex. (A, B) Phenotypes of CCT2 VIGS in HA–Tap46 OE (A) and Flag–PPX1 OE plants (B) at 18 DAI. Scale bar=1 cm. (C, D) Immunoblotting to detect Flag–PPX1 (C) and HA–Tap46 (D) protein levels after silencing of CCT2 (15 DAI), using anti-HA and anti-Flag antibodies, respectively. Coomassie-stained rbcL served as the loading control. (E) Phenotypes of PPX1/2 VIGS in WT plants at 18 DAI. The fusion construct of PPX1 and PPX2 cDNAs was used for VIGS. Scale bar: 1 cm. (F) RT-qPCR of PPX1 and PPX2 mRNAs in the VIGS plants shown in (E). Transcript levels are normalized to those of UBC10 mRNA, and expressed relative to those of TRV2 samples. The PCR primers recognized both PPX1 and PPX2 mRNAs. Values represent mean ±SE derived from three biological replicates (**P≤0.01). (G) Semi-quantitative RT-PCR using gene-specific primers for PPX1 and PPX2. UBC21 mRNA served as the loading control. (H) Native-PAGE and SDS-PAGE of VIGS plants in Flag–PPX1 OE background at 15 DAI. Immunoblotting was performed with anti-Flag antibody. Ponceau-stained rbcL served as the loading control. (I) Immunoblotting with anti-Flag antibody in VIGS plants with or without 4 h treatment with 20 μM MG132. (J) CHX–chase assays. Five-day-old Flag–PPX1 OE and Flag–CCT2 OE seedlings were treated with water (−CHX) or 2 mg ml−1 CHX for 4 h, and subjected to native-PAGE and SDS-PAGE, followed by immunoblotting with anti-Flag antibody. The asterisk and white arrowhead indicate the CCT complex-associated form and mature form of Flag–PPX1, respectively. (K) Effects of CHX treatments on PPX1 and Tap46 levels. Five-day-old Flag–PPX1 OE and HA–Tap46 OE seedlings were treated with water or 2 mg ml−1 CHX for 0, 2, and 4 h, and subjected to SDS-PAGE and immunoblotting with anti-Flag and anti-HA antibodies. (This figure is available in color at JXB online.)
Fig. 6.
Fig. 6.
Tap46 stabilizes PPX1 proteins. (A) VIGS phenotypes of CCT2 and Tap46 in Flag–PPX1 OE plants (15 DAI). Scale bar: 1 cm. (B) Native-PAGE and SDS-PAGE were performed using Flag–PPX1 OE plants after silencing of Tap46 (15 DAI), followed by immunoblotting with anti-Flag antibody. Ponceau-stained rbcL served as the loading control. (C, D) Native-PAGE and SDS-PAGE were performed with Flag–CCT2 OE (C) and GFP–TUB6 OE plants (D) after silencing of Tap46 (15 DAI), followed by immunoblotting with anti-Flag and anti-GFP antibodies, respectively. (E) Leaf extracts of TRV2 and Tap46 VIGS plants were incubated for 2 h with recombinant Tap46–His (F), Tap46-N–His (N), or Tap46-C–His (C) proteins. Immunoblotting was performed with anti-Flag and anti-His antibodies. Coomassie-stained rbcL served as the loading control. (F) Immunoblotting with anti-PP4c and anti-PP2Ac antibodies in CCT2 and Tap46 VIGS plants in WT background. Ponceau-stained rbcL was used as the control. (G) Computational modeling of Tap46 N-terminal region. The tertiary structure of Tap46 N-terminal region (9–220 residues) was predicted using the automated homology modeling server PHYRE2 (Protein Homology/analogY Recognition Engine V 2.0) with the N-terminal domain of α4 (10–222 residues) as template. The PDB file name for α4 N-terminal domain is 3QC1. The predicted molecular model was edited using the PyMOL molecular graphics system (version 1.1). The N- and C-terminus of each sequence input are indicated in the figure. The PP2Ac-binding residues in the extended α-helix 5 (h5) are marked. The disordered loop between h4 and h5 is shown as dotted lines. (This figure is available in color at JXB online.)

References

    1. Ahn CS, Ahn HK, Pai HS. 2015a Overexpression of the PP2A regulatory subunit Tap46 leads to enhanced plant growth through stimulation of the TOR signalling pathway. Journal of Experimental Botany 66, 827–840. - PMC - PubMed
    1. Ahn CS, Han JA, Lee HS, Lee S, Pai HS. 2011. The PP2A regulatory subunit Tap46, a component of the TOR signaling pathway, modulates growth and metabolism in plants. The Plant Cell 23, 185–209. - PMC - PubMed
    1. Ahn HK, Kang YW, Lim HM, Hwang I, Pai HS. 2015b Physiological functions of the COPI complex in higher plants. Molecules and Cells 38, 866–875. - PMC - PubMed
    1. Archibald JM, Blouin C, Doolittle WF. 2001. Gene duplication and the evolution of group II chaperonins: implications for structure and function. Journal of Structural Biology 135, 157–169. - PubMed
    1. Bertrand S, Barthelemy I, Oliva MA, Carrascosa JL, Andreu JM, Valpuesta JM. 2005. Folding, stability and polymerization properties of FtsZ chimeras with inserted tubulin loops involved in the interaction with the cytosolic chaperonin CCT and in microtubule formation. Journal of Molecular Biology 346, 319–330. - PubMed

Publication types

MeSH terms