. 2019 Apr 17;102(2):321-338.e8.
doi: 10.1016/j.neuron.2019.01.048. Epub 2019 Feb 27.

RNA Binding Antagonizes Neurotoxic Phase Transitions of TDP-43

Affiliations

RNA Binding Antagonizes Neurotoxic Phase Transitions of TDP-43

Jacob R Mann et al. Neuron. .

Abstract

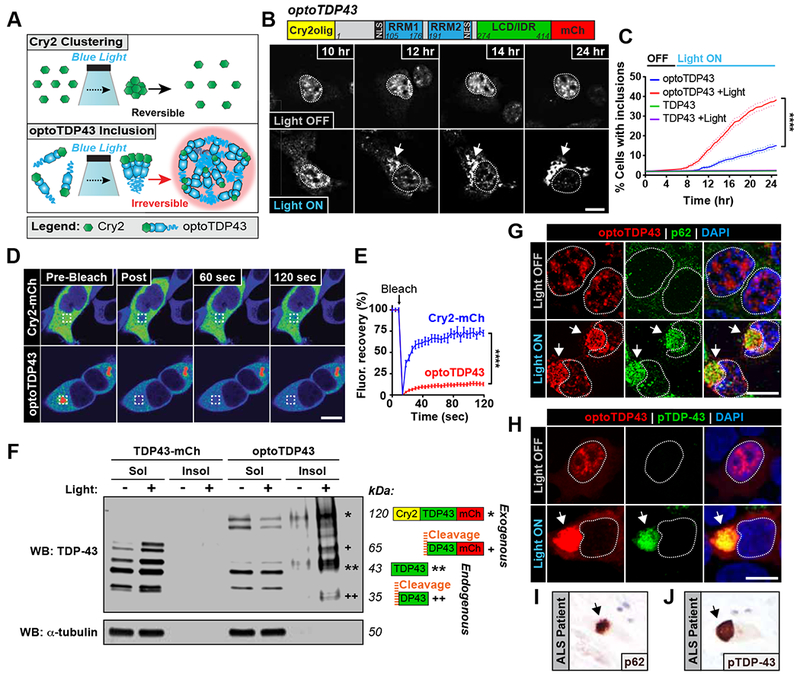
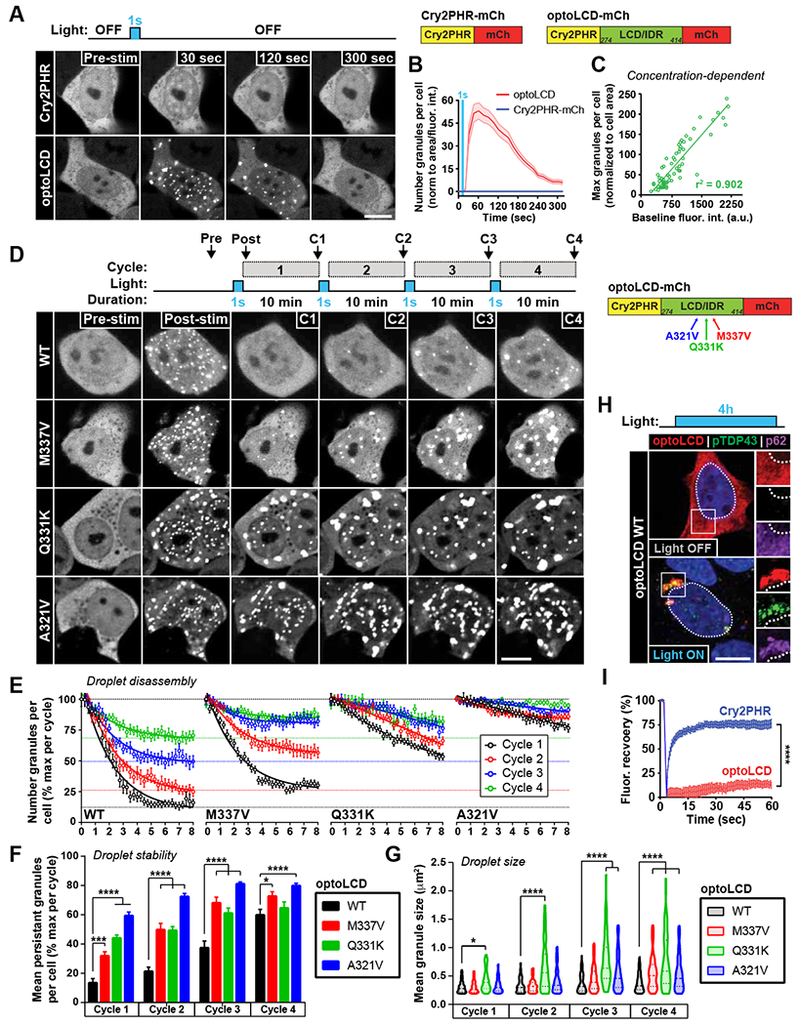
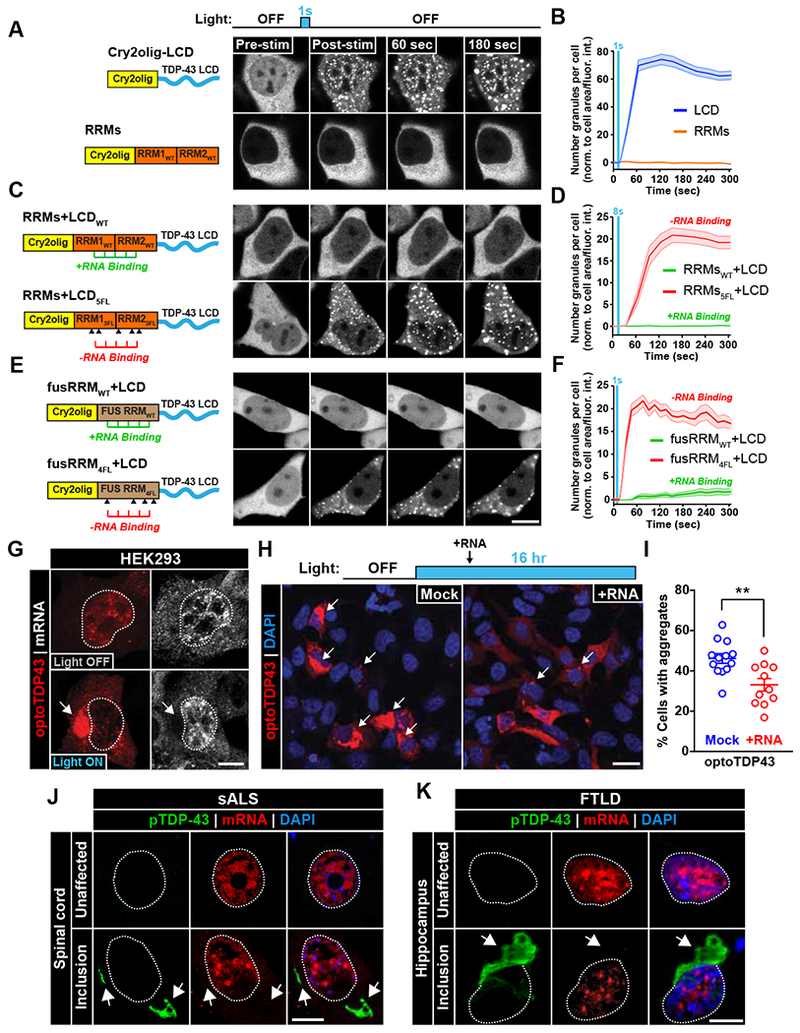
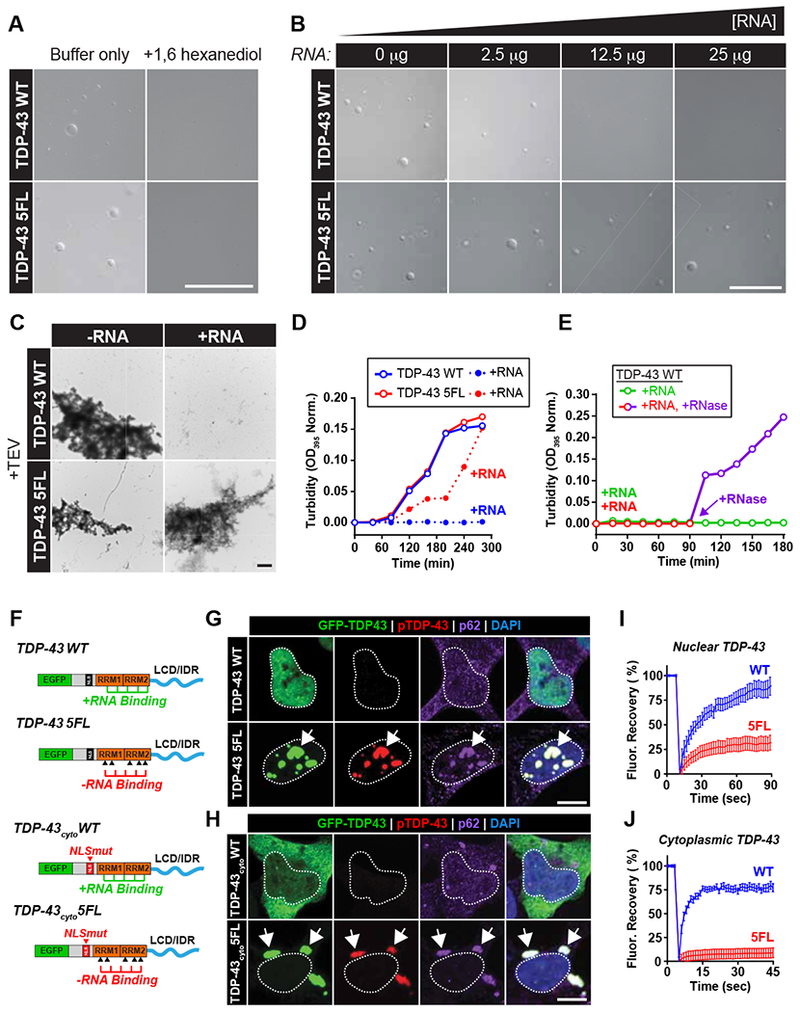
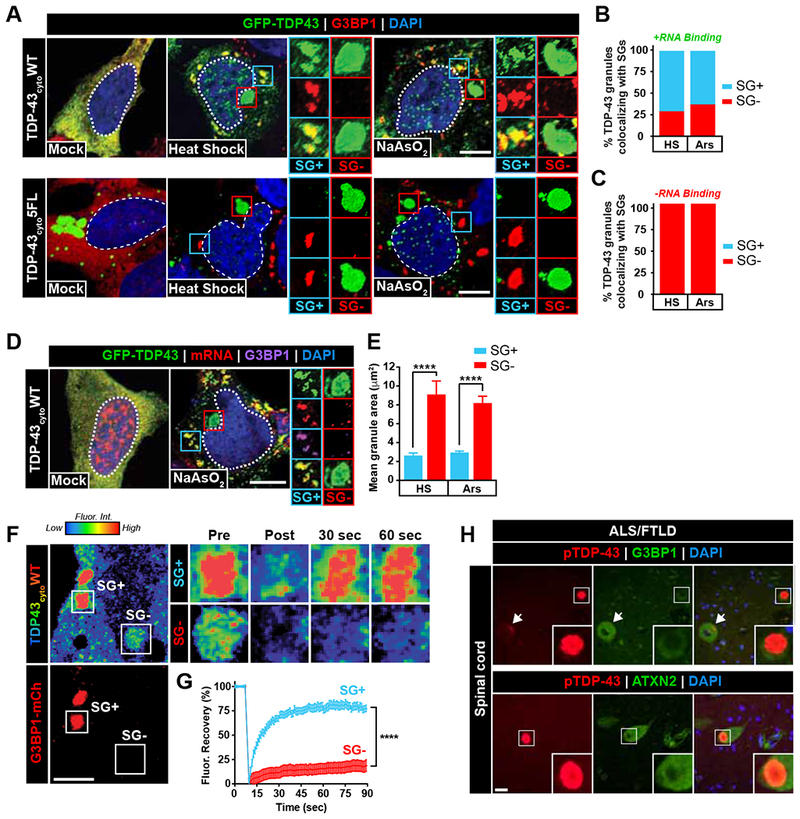
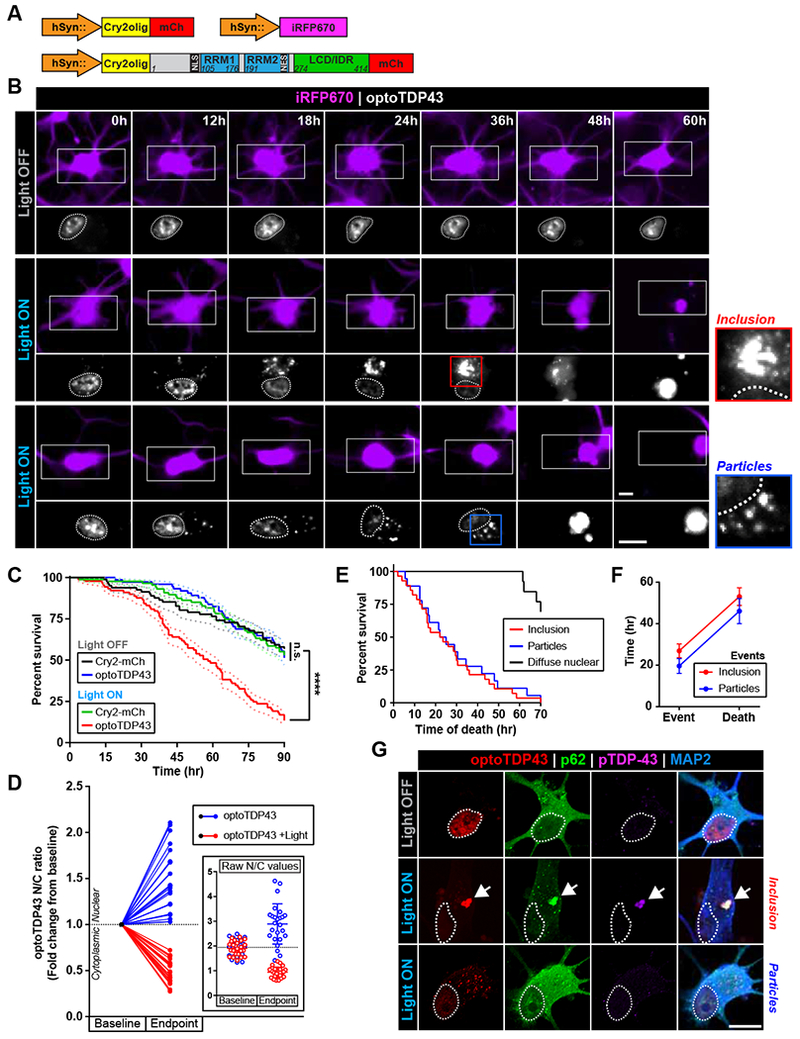
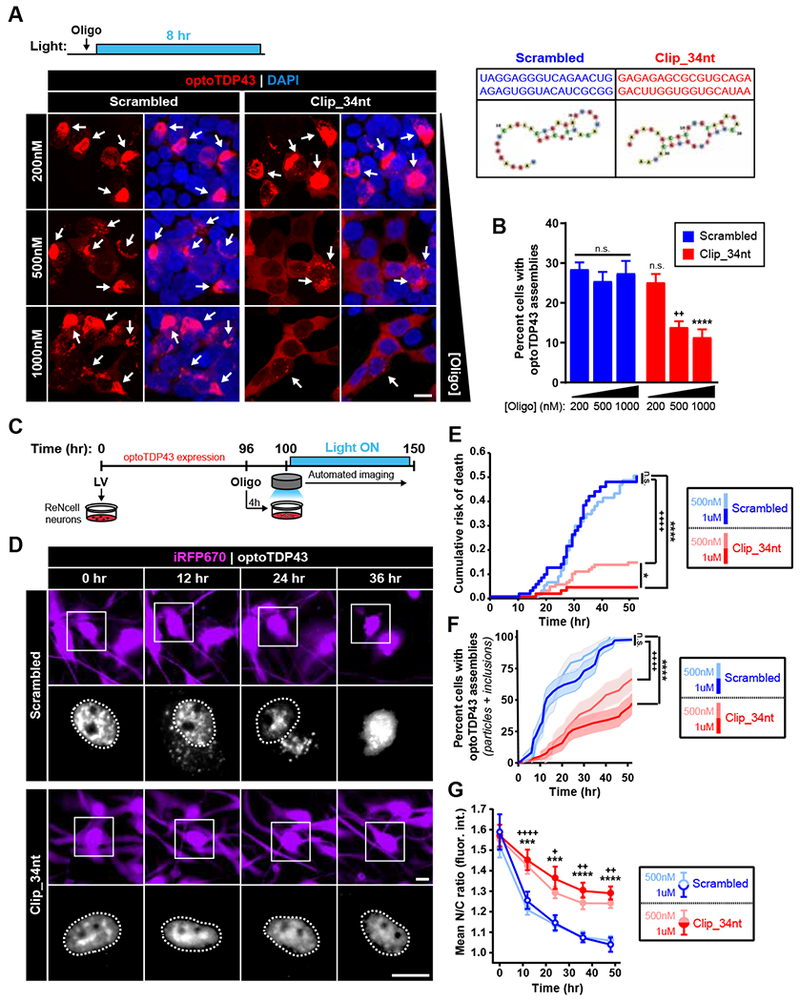
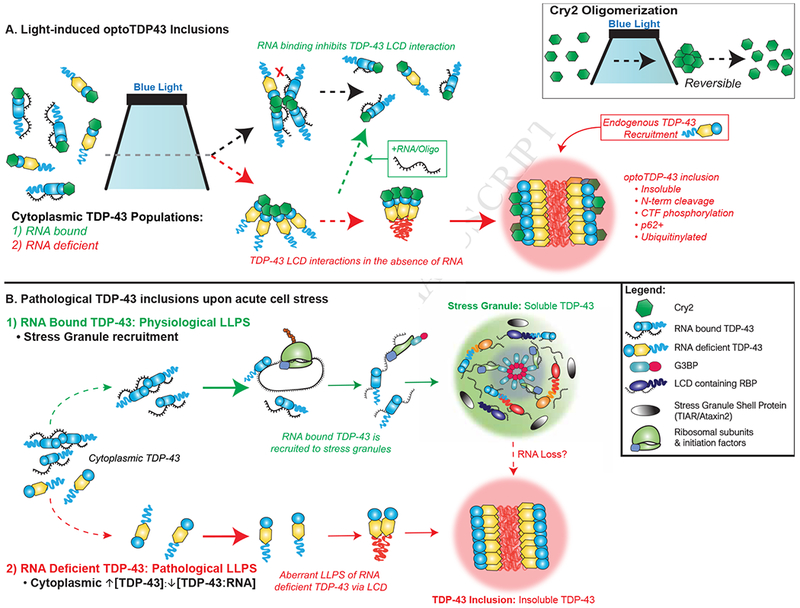
TDP-43 proteinopathy is a pathological hallmark of amyotrophic lateral sclerosis and frontotemporal dementia where cytoplasmic TDP-43 inclusions are observed within degenerating regions of patient postmortem tissue. The mechanism by which TDP-43 aggregates has remained elusive due to technological limitations, which prevent the analysis of specific TDP-43 interactions in live cells. We present an optogenetic approach to reliably induce TDP-43 proteinopathy under spatiotemporal control. We show that the formation of pathologically relevant inclusions is driven by aberrant interactions between low-complexity domains of TDP-43 that are antagonized by RNA binding. Although stress granules are hypothesized to be a conduit for seeding TDP-43 proteinopathy, we demonstrate pathological inclusions outside these RNA-rich structures. Furthermore, we show that aberrant phase transitions of cytoplasmic TDP-43 are neurotoxic and that treatment with oligonucleotides composed of TDP-43 target sequences prevent inclusions and rescue neurotoxicity. Collectively, these studies provide insight into the mechanisms that underlie TDP-43 proteinopathy and present a potential avenue for therapeutic intervention.

Keywords: ALS; FTD; LLPS; RBP; RNA binding protein; TDP-43; bait oligonucleotide; liquid-liquid phase separation; neurodegeneration; optoTDP43; proteinopathy; stress granule.


Conflict of interest statement

Competing Interests

No competing financial interests to declare. Dr. Christopher Donnelly and Jacob Mann are inventors of intellectual property described in this manuscript and submitted as provisional patents by the University of Pittsburgh.

Figures

Figure 1.
Figure 1.. optoTDP43 is a light-inducible model of TDP-43 proteinopathy.
(A) Schematic of light-inducible TDP-43 proteinopathy approach using the Cry2olig photoreceptor and TDP-43 protein. (B) optoTDP43 fusion protein and representative images of HEK293 cells expressing optoTDP43 exposed to blue light stimulation (bottom) (~0.3 mW/cm2, 465 nm) or darkness (top). Cell nuclei are circled. Arrow indicates optoTDP43 inclusion formation with light treatment. (C) Percentage of cells exhibiting optoTDP43 inclusions over time using automated longitudinal live-imaging, n = 494-791 cells. (D) Representative images of FRAP analysis images of Cry2-mCh or light-induced optoTDP43 inclusions. (E) Quantification of FRAP analysis shows lack of signal recovery for optoTDP43 inclusions, n = 18-22 cells. (F) Detergent-solubility fractionation and western blotting for TDP-43 of optoTDP43-expressing cells with and without light stimulation. * indicates full-length exogenous optoTDP43; + indicates optoTDP43 cleavage product; ** indicates full-length endogenous TDP-43; ++ indicates endogenous TDP-43 cleavage product. (G-J) Immunofluorescence analysis of optoTDP43 inclusions (G-H) and ALS patient spinal cord (I-J) for pathological hallmarks p62 (G, I) and C-terminal hyperphosphorylated TDP-43 (H, J). Data shown are mean +/− S.E.M. **** p < 0.0001. Scale bars = 10 μm.
Figure 2.
Figure 2.. Optogenetic phase transitions of the TDP-43 LCD drives inclusion formation.
(A) Representative images of HEK293 cells expressing Cry2PHR-mCh (top) or optoLCD (bottom) exposed to acute blue light stimulation (1 sec, 1% laser power, 488 nm). (B) Quantification of normalized granule number per cell in response to acute stimulation, n = 26-48 cells. (C) Quantification of protein concentration-dependence of optoLCD phase transitions, r2 was determined by Pearson’s correlation. Data points represent individual cells. n = 66 cells. (D) Representative images of repetitive light-induced phase transitions of WT and ALS-linked mutant (M337V, Q331K, A321V) optoLCD proteins during a cycling light stimulation protocol consisting of a single blue light pulse (1 sec, 1% laser power) every 10 min for 40 min. Images shown are the final images acquired per cycle prior to subsequent light stimulation. (E) Quantification of granule disassembly dynamics following cycling stimulation protocol shown in (D). n = 21-31 cells per construct. (F-G) Quantification of irreversible optoLCD number (F) and area (G) per cycle with repeated phase transitions. (H) Immunofluorescence analysis of optoLCD inclusions formed following chronic blue light stimulation (4 hrs, ~0.3mW/cm2, 465 nm) for hyperphosphorylated TDP-43 (green) p62 (purple). (I) Quantification of fluorescence recovery after photobleaching of optoLCD inclusions formed by chronic light stimulation. n = 16 cells per construct. Data points shown are mean +/− S.E.M. ****, p < 0.0001. Scale bars = 10 μm.
Figure 3.
Figure 3.. RNA-binding prevents light-induced phase separation and aggregation of TDP-43.
(A-F) HEK293 cells expressing the Cry2olig photoreceptor fused to the TDP-43 LCD (A), TDP-43 RNA-binding regions (RRMs) (A), TDP-43 LCD and functional (WT) RRMs (C), TDP-43 LCD and RNA-binding deficient (5FL) RRMs (C), TDP-43 LCD fused to the functional (WT) FUS RRM (E), or TDP-43 LCD fused to FUS RNA-binding deficient (4FL) RRM (E) were exposed to acute light stimulation (1-8 sec, 10% laser power, 488 nm) and normalized granule number per cell quantification is shown in right hand column (B, D, F). n = 33-59 (A-B), 24-36 (C-D) and 31-45 cells (E-F). Data shown are mean +/− S.E.M. (G) mRNA within full-length optoTDP43 inclusions was assessed by RNA fluorescence in situ hybridization (FISH) for Poly-A tails. Arrow indicates absence of mRNA signal within inclusion. (H) Representative images of HEK293 cells expressing optoTDP43 that received mock or RNA (2.5 μg HEK293 total mRNA) treatment 4 hours into a 16 hour chronic blue light treatment. (I) Quantification of optoTDP43-expressing cells with cytoplasmic inclusions. Data points correspond to individual fields of view. n = 662-673 cells. (J-K) RNA FISH analysis of ALS/FTLD patient tissue targeting Poly-A mRNA. TDP-43 inclusions (green, bottom rows) in spinal cord (J, sALS) and hippocampal (K, FTLD) sections both show no co-localization with mRNA signal (red). Data shown are mean +/− S.E.M. **, p < 0.01. Scale bars = 10 μm.
Figure 4.
Figure 4.. TDP-43 LLPS and aggregation is inhibited by RNA-binding.
(A) Purified TDP43-MBP WT or 5FL (5μM) were incubated for 2 hours (10% dextran buffer, 150 mM NaCl) in the absence or presence of 1,6 hexanediol (10% w/v). Scale bar = 50 μm. (B) Representative DIC images of purified TDP43-MBP WT or 5FL following incubation with increasing concentrations of yeast total RNA. Scale bar = 50 μm. (C) Representative electron micrographs of TDP-43 WT and 5FL following TEV cleavage in the absence (left) or presence (right) of yeast total RNA (15 μg). Scale bars = 4 μm. (D) Turbidity changes (normalized OD395 readings) of TDP-43 WT (blue) and 5FL (red) following TEV cleavage in the absence (open circles) or presence (solid circles) of yeast total RNA (15 μg). (E) Turbidity changes (normalized OD395 readings) of TDP-43 WT proteins following TEV cleavage in the presence of yeast total RNA-only (25 μg) (green) or yeast total RNA (25μg) followed by RNase A addition (2.5μg) at 90 min post-TEV cleavage (red prior to/purple following RNase A). (F) Construct designs for non-optogenetic TDP-43 vectors containing functional (WT) or RNA-binding deficient (5FL) RRMs. TDP-43cyto constructs contain point mutations in the nuclear localization sequence to mimic cytoplasmic mislocalization. (G-H) Immunofluorescence analysis of cells expressing EGFP-TDP-43 constructs (G) or EGFP-TDP43cyto constructs (H) with/without functional RRMs (WT/5FL) for hyperphosphorylated TDP-43 (red) and p62 (purple). Scale bars = 10 μm. (I-J) FRAP analysis of EGFP-TDP43 5FL (G) and EGFP-TDP43cyto 5FL (H) inclusions, n = 14-23 (I) and 20-24 cells (J). Data shown are mean +/− S.E.M. Scale bars = 10 μm.
Figure 5.
Figure 5.. RNA-binding and stress granule localization prevents TDP-43 inclusions.
(A) Cytoplasmic EGFP-TDP43 constructs were expressed with functional (WT, top) or RNA-binding deficient (5FL, bottom) RRMs in HEK293 cells prior to heat shock or sodium arsenite treatment and immunostaining for G3BP1 (red) and eIF4G (not shown). (B-C) Percentage of EGFP-TDP43 granules that co-localized with G3BP1/eIF4G were calculated (SG+/−). n = 99-316 granules. (D) RNA FISH targeting Poly-A tails was performed to assess mRNA presence in SG+/− TDP-43 granules following sodium arsenite treatment. Scale bar = 10 μm. (E) Mean granule area for SG+ and SG− TDP-43 granules following heat shock and sodium arsenite treatment was determined by immunofluorescence, n = 24-68 granules per condition. (F-G) HEK293 cells were co-transfected with cytoplasmic EGFP-TDP43cyto and G3BP1-mCh and exposed to sodium arsenite treatment to induce stress granule formation. FRAP analysis of TDP-43 granules that co-localized (SG+) or did not co-localize (SG−) with G3BP-mCh was performed to assess material state of SG+/− granules, n = 17-27 cells. (H) Immunohistochemical analysis of ALS/FTLD spinal cord tissue was performed to determine whether patient TDP-43 inclusions contain SG proteins. Arrows or insets indicate a lack of co-localization between TDP-43 inclusions (red) and the SG components G3BP1 (top) and ATXN2 (bottom) (green). Scale bar = 20 μm. Data shown are mean +/− S.E.M. ****, p < 0.0001.
Figure 6.
Figure 6.. Light-induced optoTDP43 phase transitions are neurotoxic.
(A) Diagrams of lentiviral expression vectors used in neuronal survival experiments. optoTDP43 or the Cry2-mCh photoreceptor alone were expressed along with a far-red fluorescent reporter (iRFP670) under the control of the human synapsin promoter (hSyn). (B) Representative images of ReNcell cortical neurons expressing optoTDP43 kept in darkness (top row) or exposed to blue light (bottom two rows) (~0.3 mW/cm2, 465 nm) during longitudinal toxicity screening. The iRFP670 reporter is shown (purple) to visualize cell bodies and neurites. Insets show optoTDP43 signal (white) in the same neurons. Cell nuclei are circled. Loss of signal and neurite blebbing indicates cell death (bottom rows, 48-60 hr). (C) Survival curves of ReNcell neurons during longitudinal toxicity screening, n = 74-89 cells. Data are presented as mean percent survival. (D) Nuclear-cytoplasmic (N/C) ratios of optoTDP43 signal were analyzed at baseline (prior to light exposure) and endpoints (last frame prior to cell death or conclusion of imaging session) in neurons exposed to light (red) or maintained in darkness (blue). n = 25 cells per light condition. Data is presented as fold-changes in N/C ratios normalized to baseline values. Inset shows raw N/C values and data points represent individual neurons. Dotted lines indicate population mean at baseline. (E) Survival curves of optoTDP43-expressing neurons exposed to light stimulation stratified by optoTDP43 assembly phenotype, n = 13-28 cells. (F) Time-to-death between event onset (particle or inclusion formation) and cell death were analyzed between neurons showing either optoTDP43 assembly subtype, n = 17-28 cells. (G) Immunofluorescence analysis of light-induced optoTDP43 assemblies in ReNcell neurons for pathological hallmarks p62 (green) and hyperphosphorylated TDP-43 (purple). Data shown are mean +/− S.E.M. ****, p < 0.0001. Scale bar = 10 μm.
Figure 7.
Figure 7.. Bait oligonucleotides inhibit aberrant phase transitions of TDP-43 and rescue associated neurotoxicity.
(A-B) HEK293 cells expressing optoTDP43 were pre-treated with non-targeting scrambled or targeting Clip_34nt RNA oligonucleotides for 30 min prior to chronic blue light stimulation (8 hr, −0.3 mW/cm2, 465 nm). Arrows indicate cytoplasmic optoTDP43 assemblies. (B) Quantification of percentage of cells showing light-induced cytoplasmic optoTDP43 assemblies following indicated oligonucleotide treatments, n = 578 – 943 cells. (C) Diagram representing timeline of oligonucleotide treatments and neuronal survival screening, optoTDP43-expressing ReNcell neurons were treated with indicated oligonucleotides 4 hr prior to blue light exposure and automated longitudinal imaging. (D) Representative images of neurons treated with 1 μM scrambled or Clip_34nt oligonucleotides prior to light exposure. Insets show optoTDP43 signal. Cell nuclei are circled. (E) Cumulative risk-of-death plots generated from Kaplan-Meier survival curves of ReNcell neurons over time following treatment with increasing doses of scrambled (blue) or targeting Clip_34nt (red) oligonucleotides. Shades of traces indicate treatment concentration (light = 500nM; dark = 1 μM). n = 78-121 cells. (F) Automated object detection was utilized to determine percentage of ReNcell neurons showing optoTDP43 assemblies (inclusions + particles) over time following the indicated oligonucleotide treatments, n = 37-39 cells. (G) Nuclear-cytoplasmic (N/C) ratios of optoTDP43 signal were calculated over time in neurons exposed to the indicated oligonucleotide treatments, n = 34-45 cells. *, p < 0.05; **, p < 0.01; ***, p < .001; p < 0.0001. + indicate comparisons between 500nM treatment groups; * indicate comparisons between 1000nM treatment groups. Data shown are mean +/− S.E.M. Scale bars = 10 μm.
Figure 8.
Figure 8.. RNA dependent model of TDP-43 proteinopathy.
(A) Schematic of light-induced optoTDP43 inclusion formation. Cry2 photoreceptor reversibly homo-oligomerizes upon illumination (upper right corner). In the cytoplasm, light-induced increases in the focal concentration of RNA-unbound optoTDP43 (yellow) result in aberrant phase transitions that mature into insoluble inclusions capable of recruiting endogenous TDP—43. LCD interactions of RNA-bound optoTDP43 (blue) are blocked upon illumination, maintaining optoTDP43 solubility and inhibiting inclusion formation. Addition of TDP-43 target RNA sequences and bNAs inhibit aberrant phase transitions of optoTDP43. (B) Proposed role of SG localization and intracellular TDP-43 LLPS. Physiological LLPS: RNA-bound TDP-43 localizes to SGs and the LCD promotes physiological phase separation into a heterogeneous RNP environment. The abundance of additional LCD-containing RBPs and RNA species promotes transient hetero-molecular interactions and rapid exchange of molecules, which maintains the liquid-like state and solubility of the granule. Pathological LLPS: An altered stoichiometric balance of TDP-43:RNA substrates promote RNA-deficient TDP-43 interactions. These aberrant homo-molecular interactions through the LCD may initiate aberrant TDP-43 phase transitions into insoluble inclusions. Loss of SG RNA may also promote the liquid-to-solid transition of TDP-43.

Comment in

References

    1. Afroz T, Hock E-M, Ernst P, Foglieni C, Jambeau M, Gilhespy LAB, Laferriere F, Maniecka Z, Plückthun A, Mittl P, et al. (2017). Functional and dynamic polymerization of the ALS-linked protein TDP-43 antagonizes its pathologic aggregation. Nat. Commun 8, 45. - PMC - PubMed
    1. Al-Sarraj S, King A, Troakes C, Smith B, Maekawa S, Bodi I, Rogelj B, Al-Chalabi A, Hortobágyi T, and Shaw CE (2011). p62 positive, TDP-43 negative, neuronal cytoplasmic and intranuclear inclusions in the cerebellum and hippocampus define the pathology of C9orf72-linked FTLD and MND/ALS. Acta Neuropathol 122, 691–702. - PubMed
    1. Anderson P, and Kedersha N (2008). Stress granules: the Tao of RNA triage. Trends Biochem. Sci 33, 141–150. - PubMed
    1. Arnold ES, Ling S-C, Huelga SC, Lagier-Tourenne C, Polymenidou M, Ditsworth D, Kordasiewicz HB, McAlonis-Downes M, Platoshyn O, Parone PA, et al. (2013). ALS-linked TDP-43 mutations produce aberrant RNA splicing and adult-onset motor neuron disease without aggregation or loss of nuclear TDP-43. Proc. Natl. Acad. Sci. USA 110, E736–45. - PMC - PubMed
    1. Ayala YM, De Conti L, Avendaño-Vázquez SE, Dhir A, Romano M, D’Ambrogio A, Tollervey J, Ule J, Baralle M, Buratti E, et al. (2011). TDP-43 regulates its mRNA levels through a negative feedback loop. EMBO J 30, 277–288. - PMC - PubMed

Publication types