. 2019 Mar;21(2):274-285.
doi: 10.1016/j.jmoldx.2018.09.003. Epub 2018 Oct 26.

Development of Novel Mutation-Specific Droplet Digital PCR Assays Detecting TERT Promoter Mutations in Tumor and Plasma Samples

Affiliations

Development of Novel Mutation-Specific Droplet Digital PCR Assays Detecting TERT Promoter Mutations in Tumor and Plasma Samples

Broderick C Corless et al. J Mol Diagn. 2019 Mar.

Abstract

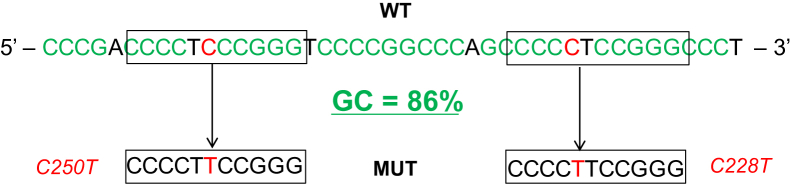
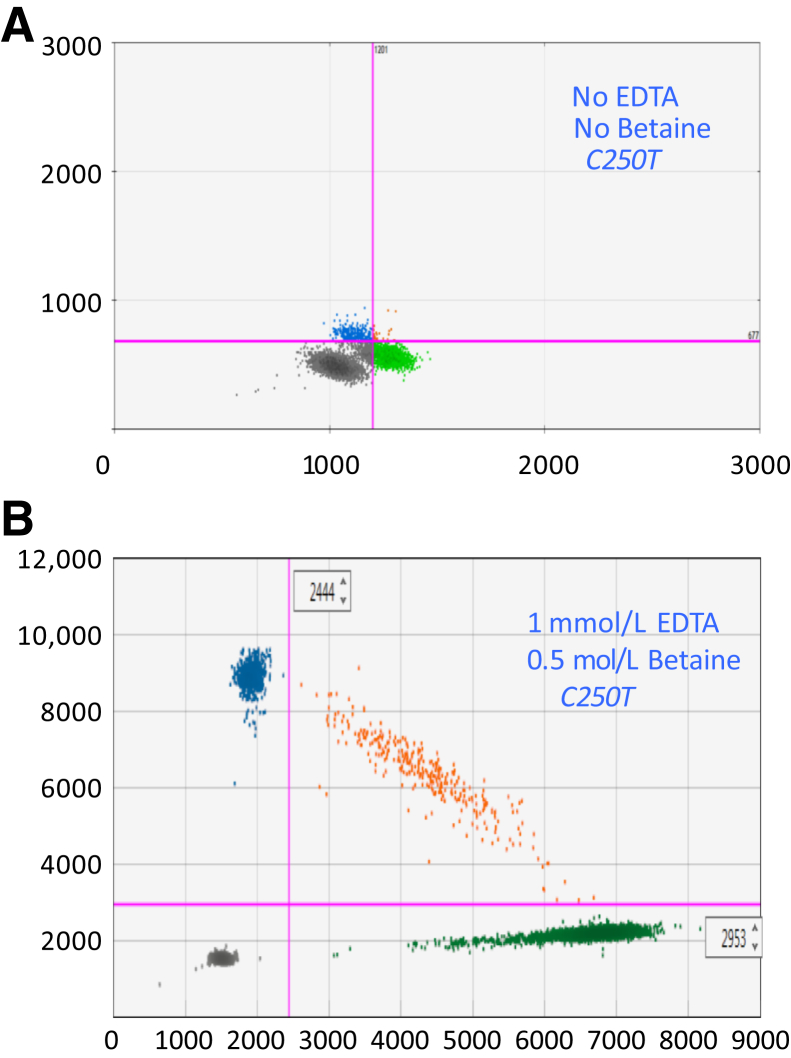
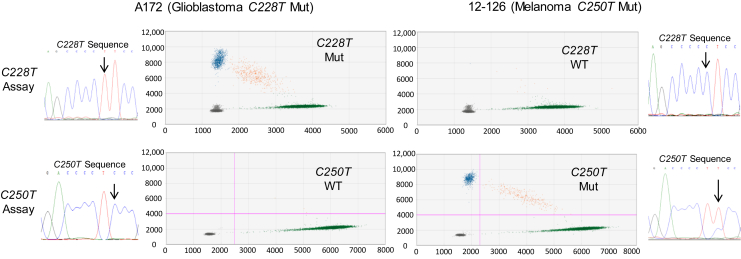
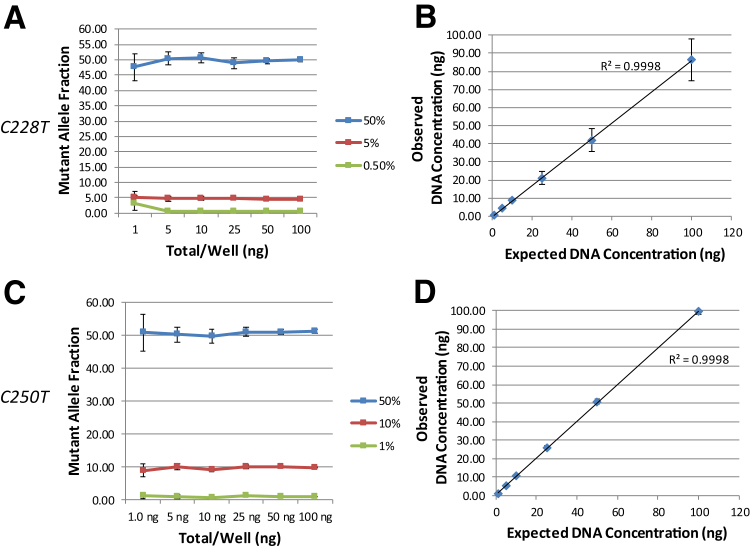
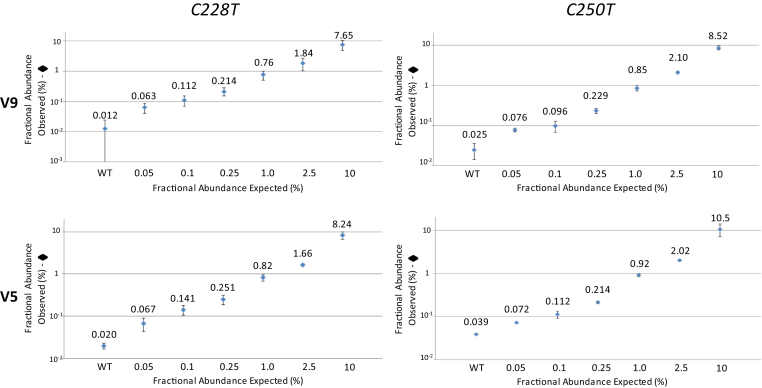
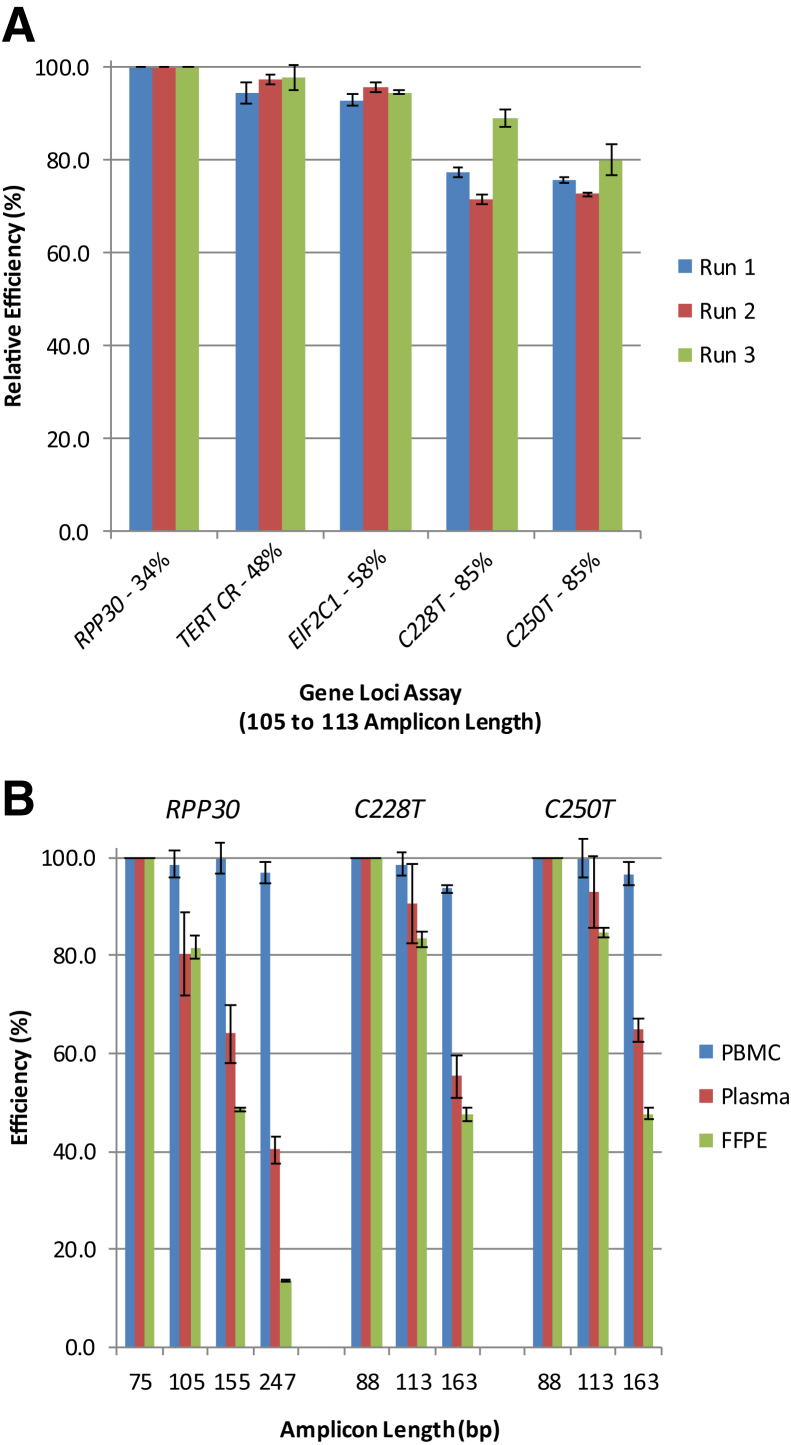
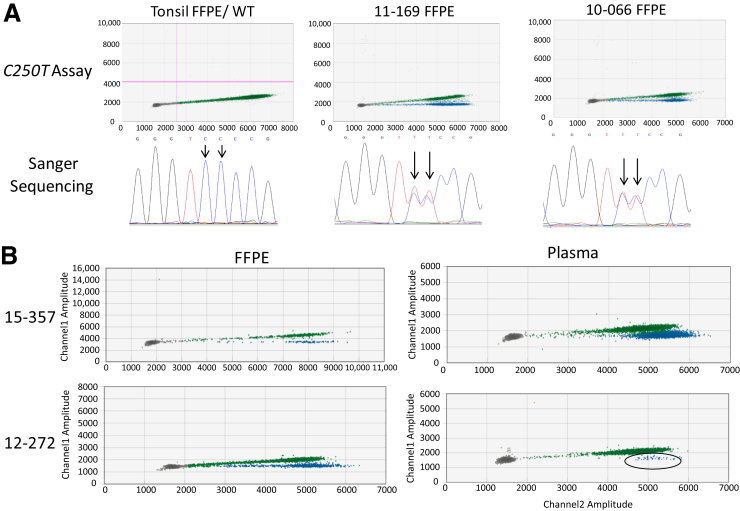
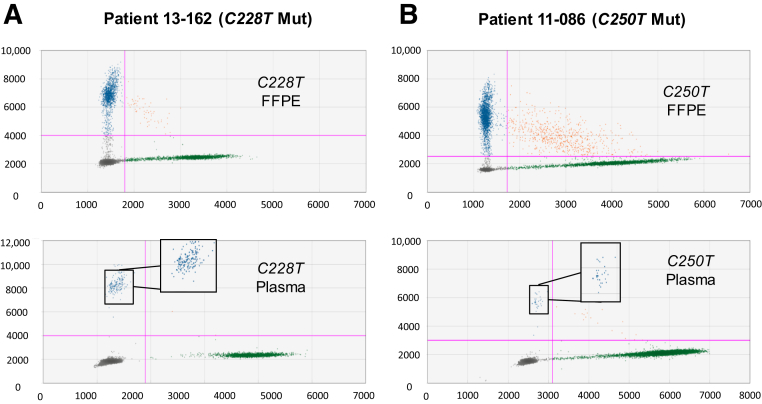
Detecting mutations in the plasma of patients with solid tumors is becoming a valuable method of diagnosing and monitoring cancer. The TERT promoter is mutated at high frequencies in multiple cancer types, most commonly at positions -124 and -146 (designated C228T and C250T, respectively). Detection of these mutations has been challenging because of the high GC content of this region (approximately 80%). We describe development of novel probe-based droplet digital PCR assays that specifically detect and quantify these two mutations, along with the less common 242-243 CC>TT mutation, and demonstrate their application using human tumor and plasma samples from melanoma patients. Assay designs and running conditions were optimized using cancer cell line genomic DNAs with the C228T or C250T mutations. The limits of detection were 0.062% and 0.051% mutant allele fraction for the C228T and C250T assays, respectively. Concordance of 100% was observed between droplet digital PCR and sequencing-based orthogonal methods in the detection of TERT mutant DNA in 32 formalin-fixed, paraffin-embedded melanoma tumors. TERTmutant DNA was also identified in 21 of 27 plasma samples (78%) from patients with TERTmutant tumors, with plasma mutant allele fractions ranging from 0.06% to 15.3%. There were no false positives in plasma. These data demonstrate the potential of these assays to specifically detect and quantify TERTmutant DNA in tumors and plasma of cancer patients.


Figures

Figure 1
Figure 1
TERT promoter region sequence comprising the C250T and C228T point mutations (MUTs). High GC content (86%) and close proximity of the mutations make amplifying the individual mutations challenging. WT, wild type.
Figure 2
Figure 2
Two-dimensional ddPCR plots showing the C250T TERT promoter assay with and without chemical additives. A: Initial results using standard supermix and primers and probes to amplify and detect a 163-bp fragment. B: Results of optimized assay conditions, which include betaine and disodium EDTA, and primers and probes to amplify and detect a 113-bp fragment. The annealing temperature for the assays in A and B was 62°C.
Figure 3
Figure 3
Demonstration of specificity using cell lines with TERT promoter mutations (Muts). Cell lines A172 (C228T) and 12-126 (C250T) were analyzed with Sanger sequencing to identify their TERT promoter mutation. ddPCR using the 113-bp assays identified the specific mutations in each cell line. Representative analyses of triplicate wells using 33 ng DNA input per well are shown. Note the extremely low level of assay cross-reactivity (ie, few false-positive droplets). Black arrows indicate the single-base mutation site for the respective TERT promoter mutation. WT, wild type.
Figure 4
Figure 4
Linearity of DNA quantification across a broad dynamic range. A: A range of input cell line DNA concentrations (1 to 100 ng per well) was analyzed in triplicate wells, at 50%, 5%, and 0.05% mutant allele fractions, using the C228T 113-bp assay (A172 cell line). C: The same range of DNA concentrations, at 50%, 10%, and 1% mutant allele fractions, was analyzed with the C250T 113-bp assay (12-126 cell line). B and D: The average absolute output for the DNA concentrations (expected versus observed) is shown for the C228T (three experiments; B) and C250T (two experiments; D) assays. Error bars are 95% CIs of the mean for the experiments.
Figure 5
Figure 5
Titration series used to determine TERT promoter assays' limits of blank (LoBs) and limits of detection (LoDs). DNAs from cell lines A172 (left panels) and 12-126 (right panels) were diluted with peripheral blood mononuclear cell (PBMC) DNA to mutant allele fractions of 10%, 2.5%, 1.0%, 0.25%, 0.1%, and 0.05% and analyzed with the C228T and C250T assays. PBMC DNA at 100% (0% mutant) was included to determine background (LoB). A total of 6.6 ng of DNA per well was analyzed in 12 replicate wells using the C228T and C250T assays. The LoB and LoD for both mutant assays with either the 113- or 88-bp amplicons were calculated, as described in Materials and Methods, using data generated from these experiments. WT, wild type.
Figure 6
Figure 6
TERT promoter assay efficiency. A: Interassay efficiency comparing with housekeeping genes. Peripheral blood mononuclear cell (PBMC) DNA (5 to 25 ng) was amplified in each run using primers generating amplicon lengths between 105 and 113 bp for RPP30, the TERT coding region (CR), EIF2C1, C228T, and C250T (113-bp assay). Percentage of GC content is shown for each amplicon to demonstrate the effect of GC content on amplification efficiency. The blue, red, and green bars for each assay represent three different runs. The efficiencies of the assays were normalized against RPP30 by dividing the copies/μL of each assay by that of RPP30 and are plotted on the y axis. B: Intra-assay efficiency with respect to amplicon length and DNA template quality. Extracted DNAs from PBMCs, normal tissues, and plasma samples were analyzed using the RPP30, C250T, and C228T assays. Three or four primer pairs were used to generate different sized amplicons for each gene (specified on the x axis); detection probes were the same among all assays for a given gene. Intra-assay efficiencies were calculated by dividing the copies/μL of a given amplicon length by the copies/μL of the shortest amplicon length for that gene (not normalized against RPP30). DNAs analyzed: PBMC (blue), healthy donor plasma (red), and normal tonsil formalin-fixed, paraffin-embedded (FFPE) tissue (green). Data for the graph can be found in Supplemental Table S2. The data shown are from three replicate wells using the same DNA sample across all three assays and are representative of the overall results from multiple patient samples (Materials and Methods).
Figure 7
Figure 7
Detection of a rare 242-243CC>TT TERT promoter mutation. A: Normal tonsil and metastatic melanoma tumor formalin-fixed, paraffin-embedded (FFPE) samples analyzed with both the 113-bp C250T TERT assay and Sanger sequencing of the promoter region. The diagonal HEX cluster is the normal wild-type (WT) cluster observed with the C250T 113-bp assay. In both tumor samples (but not the tonsil sample), there is a second, flatter line that is forked below the diagonal cluster (blue). This corresponds to droplets that contain copies of the 242-243CC>TT mutated DNA. Sanger sequencing on the wild-type tonsil DNA shows two cytosine peaks at 242 to 243, whereas both tumor samples have two thymine peaks at 242 to 243. Black arrows indicate the two bases that are affected by the 242-243CC>TT mutation. B: Metastatic melanoma tumor FFPE DNA and corresponding plasma DNAs from two patients are analyzed with the C250T 113-bp assay. Left panels: The same forked cluster (blue) can be observed in both tumor samples. Right panels: The plasma samples for each patient have a secondary cluster below the diagonal cluster, demonstrating the ability to detect this mutation in plasma samples (cluster is circled for sample 12-272). Because of large amounts of DNA in the plasma sample for 15-357, only one well was shown in the two-dimensional plot (metawell is shown for all others).
Figure 8
Figure 8
TERT promoter mutations (Muts) detected in metastatic melanoma patient samples. Tumor and plasma samples from two metastatic melanoma patients were positive for either C228T (A) or C250T (B). Top panels: Formalin-fixed, paraffin-embedded (FFPE) tumor DNA. Bottom panels: Plasma sample from the corresponding patient. The 113-bp assays were used to analyze these samples. The expanded boxes are highlighting the single mutant droplets detected by each assay for plasma samples.

References

    1. Oxnard G.R., Thress K.S., Alden R.S., Lawrance R., Paweletz C.P., Cantarini M., Yang J.C.-H., Barrett J.C., Jänne P.A. Association between plasma genotyping and outcomes of treatment with osimertinib (AZD9291) in advanced non–small-cell lung cancer. J Clin Oncol. 2016;34:3375–3382. - PMC - PubMed
    1. Tran H., Zhang J., Vasquez M., Fossella F., Simon G., Tsao A., Gibbons D.L., Elamin Y., Banks K., Lanman R. P2. 03b-030 Retrospective review clinical use of a cfDNA blood test for identification of targetable molecular alterations in patients with lung cancer. J Thorac Oncol. 2017;12 S952.
    1. Wan J.C., Massie C., Garcia-Corbacho J., Mouliere F., Brenton J.D., Caldas C., Pacey S., Baird R., Rosenfeld N. Liquid biopsies come of age: towards implementation of circulating tumour DNA. Nat Rev Cancer. 2017;17:223–238. - PubMed
    1. Cobas EGFR MUTATION TEST v2: Somatic Gene Mutation Detection System: Premarket Approval. US Food & Drug Administration; Silver Spring, MD: 2016.
    1. Gormally E., Caboux E., Vineis P., Hainaut P. Circulating free DNA in plasma or serum as biomarker of carcinogenesis: practical aspects and biological significance. Mutat Res. 2007;635:105–117. - PubMed

Publication types