. 2019 Mar 7;176(6):1325-1339.e22.
doi: 10.1016/j.cell.2019.01.022. Epub 2019 Feb 28.

Lineage Tracing in Humans Enabled by Mitochondrial Mutations and Single-Cell Genomics

Affiliations

Lineage Tracing in Humans Enabled by Mitochondrial Mutations and Single-Cell Genomics

Leif S Ludwig et al. Cell. .

Abstract

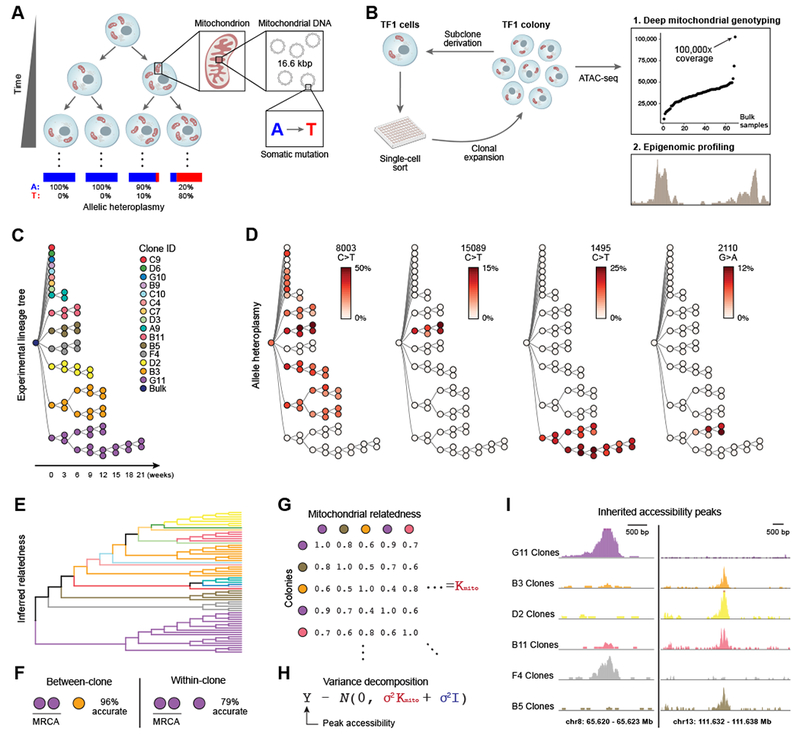
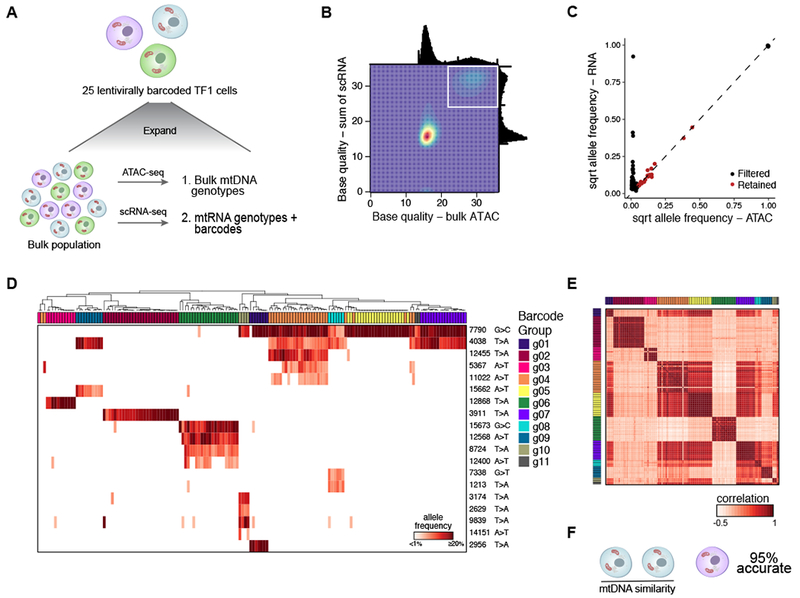
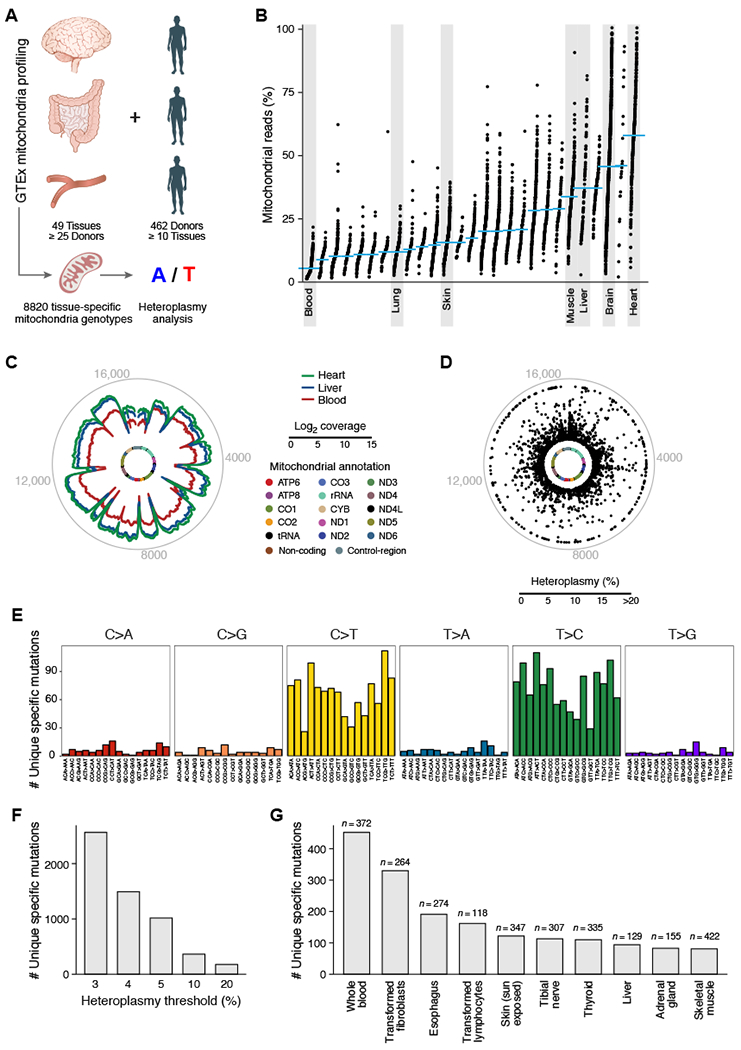
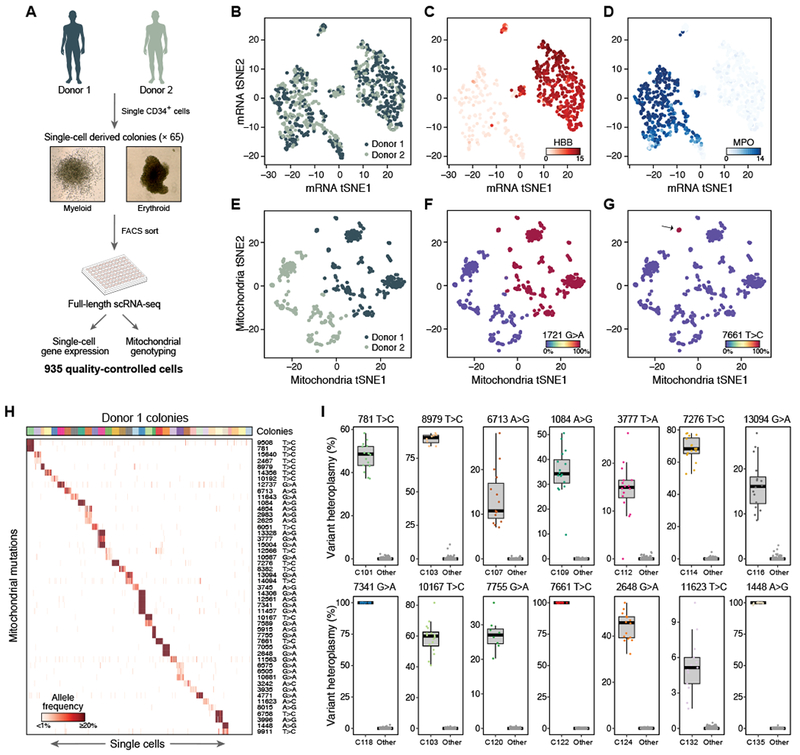
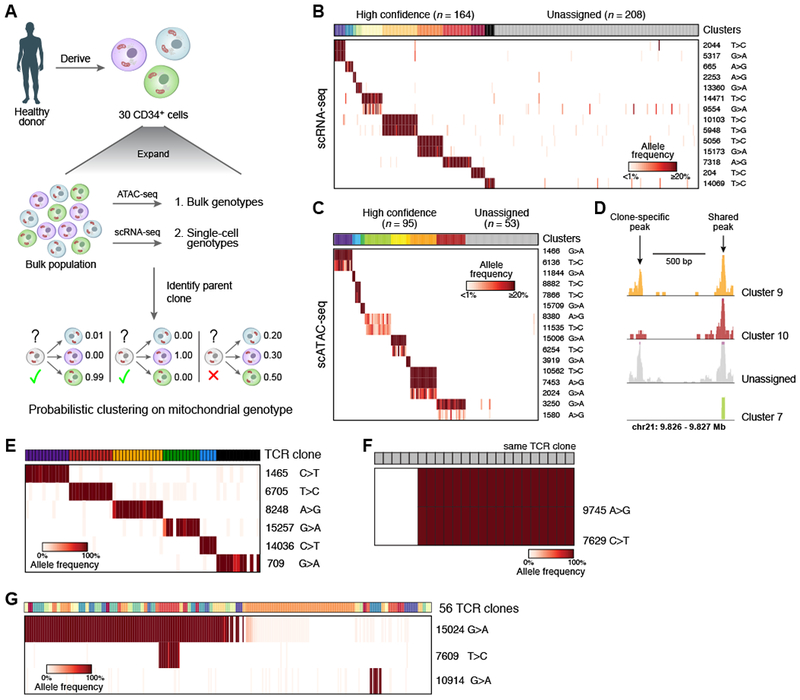
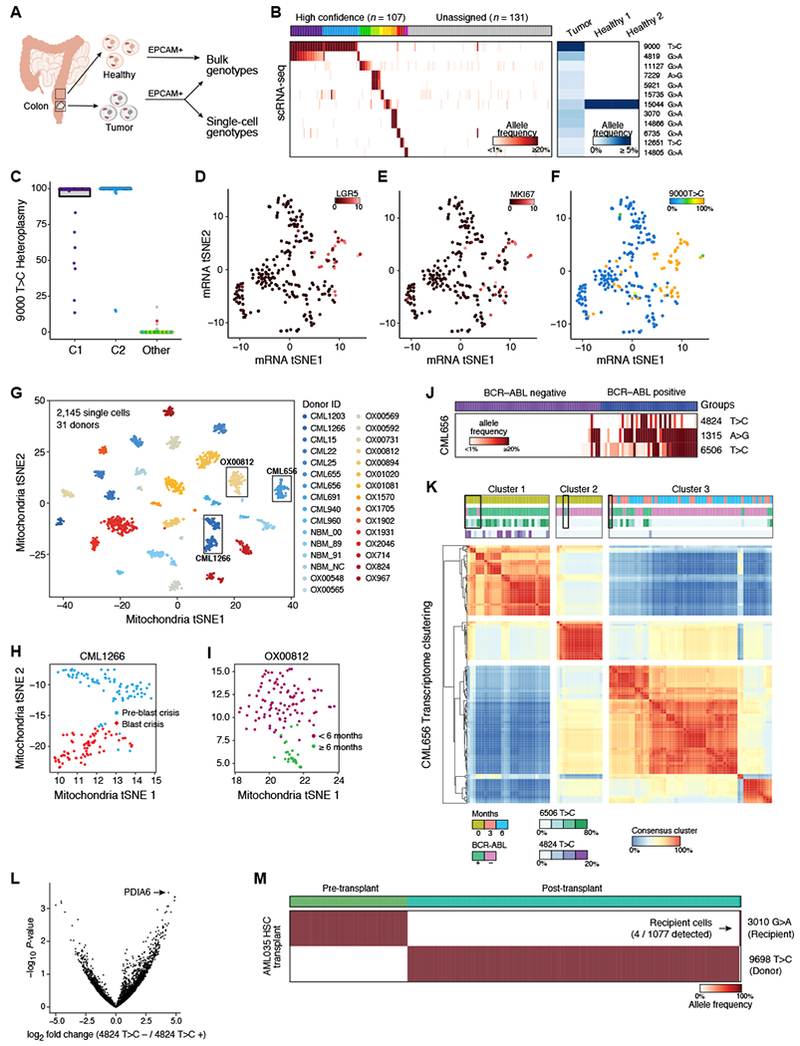
Lineage tracing provides key insights into the fate of individual cells in complex organisms. Although effective genetic labeling approaches are available in model systems, in humans, most approaches require detection of nuclear somatic mutations, which have high error rates, limited scale, and do not capture cell state information. Here, we show that somatic mutations in mtDNA can be tracked by single-cell RNA or assay for transposase accessible chromatin (ATAC) sequencing. We leverage somatic mtDNA mutations as natural genetic barcodes and demonstrate their utility as highly accurate clonal markers to infer cellular relationships. We track native human cells both in vitro and in vivo and relate clonal dynamics to gene expression and chromatin accessibility. Our approach should allow clonal tracking at a 1,000-fold greater scale than with nuclear genome sequencing, with simultaneous information on cell state, opening the way to chart cellular dynamics in human health and disease.

Keywords: chronic myeloid leukemia; colon cancer; hematopoiesis; lineage tracing; mitochondrial DNA; mtDNA; sequencing; single cell genomics; somatic mutations.


Figures

Figure 1.
Figure 1.. Mitochondrial mutations are stably propagated in human cells in vitro.
(A) Dynamics of mtDNA heteroplasmy in single cells. Each cell has multiple mitochondria, which in turn contain many copies of mtDNA that may acquire somatic mutations over time. (B) Proof-of-principle design. Each TF1 cell clone and sub-clone is assayed with ATAC-seq. (C) Supervised (true) experimental TF1 lineage tree. Colors indicate each primary clone from initial split. (D) Allelic heteroplasmy of four selected variants reveals stable propagation and clone-specificity. Color bar: allelic heteroplasmy (%). (E) Unsupervised hierarchical clustering of TF1 clones. Color: primary clones as in (C). (F) Between-clone and within-clone accuracy of identifying the most-recent common ancestor (MRCA) per trio of clones based on mtDNA mutational profile. (G) Schematic of mitochondrial relatedness matrix Kmito where each pair of clones is scored based on mitochondrial genotype similarity. (H) Random effects model for variance decomposition of epigenomic peaks. (I) Two examples of peaks inherited in clonal lineages. Peaks represent the sum of open chromatin for the clones with the most samples.
Figure 2.
Figure 2.. Mitochondrial mutations are detected using single cell genomics.
(A) Coverage of mouse mitochondrial genome by six scRNA-seq methods. Shown is the fraction (%) of the mitochondrial genome (y axis) covered by reads from each of six methods (color code), at different levels of coverage (x axis). (B) Agreement in allelic heteroplasmy estimates from single cell whole genome sequencing (WGS) and scRNA-seq from the same single cells. Shown is the allele frequency for scRNA- (y axis) and scWGS-seq (x axis) based estimates for two cell lines (HCC827: orange; SKBR3: purple). Two examples of RNA-specific changes are highlighted. (C-F) Identification of mitochondrial mutations by scRNA-, scATAC- and scMito-seq in three TF1 clones. (C) Bulk and single cell data collected for three TF1 clones (boxed). Each clone (n = 3) was processed with variable numbers of single-cell libraries (k). (D) Agreement in allelic heteroplasmy estimates from bulk ATAC- (x axis) and bulk RNA-seq (y axis) from three indicated TF1 clones (as in (C)). Two examples of RNA-specific changes are highlighted. (E) Coverage of the mitochondrial genome of the TF clone G10 by each indicated assay. Inner circle: mitochondrial genome; middle blue outline: coverage; outer grey circle: genome coordinates. For single cell assays, coverage is the sum of single cells. (F) Four clone-specific mutations that are reliably detected by various single-cell assays with heteroplasmies as low as 3.8%. Each boxplot shows the % heteroplasmy (y axis) of one mutation across scATAC-, scMito- and scRNA-seq in the three TF1 clones (color code as in (C)). Dots: individual cells.
Figure 3.
Figure 3.. Validation of mitochondrial mutations as clonal markers in single cells using lentiviral barcoding.
(A) Experimental overview. TF1 cells were infected with a lentiviral vector expressing the mNeonGreen gene and a 30bp random barcode in the untranslated region (Figure S3A). 25 cells were sorted and expanded, followed by bulk ATAC-seq and scRNA-seq. (B) Filtering of high confidence mutations. Base quality (BQ) scores from scRNA- (y axis) and from bulk ATAC-seq (x axis). White box: high-confidence variants detected by both technologies (BQ >20) (STAR Methods). (C) Allele frequencies determined by the sum of single cells from scRNA-seq (y axis) and bulk ATAC-seq (x axis). Black – filtered; red – retained. (D-F) mtDNA inferred clones agree with barcode-based clones. (D) Hierarchical clustering of TF1 mitochondrial genotyping profiles (rows) for cells assigned to annotated barcode groups (columns) (from Figure S3A). Color bar: Heteroplasmy (% allele frequency). (E) Cell-cell similarity from mitochondrial mutations called in (C). Column and rows are annotated by barcode group. (F) Between-group accuracy of identifying the most-similar pair per trio of clones based on mtDNA mutational profile using detected barcodes as a true positive.
Figure 4.
Figure 4.. Tissue-specific mitochondrial heteroplasmic mutations.
(A) Analysis overview. (B) Proportion of aligned reads that map to the mitochondrial genome for each tissue. (C) Mitochondrial genome coverage for different tissues. Inner circle: mitochondrial genome; middle circular tracks: mean coverage for heart (green), liver (blue), and blood (red); outer grey circle: genome coordinates. (D-G) Tissue-specific heteroplasmic mutations (> 3% heteroplasmy) in GTEx RNA-seq data. (D) Distribution along the mitochondrial genome. Inner circle: mitochondrial genome. Dots: % heteroplasmy of each tissue specific mutation; outer grey circle: genome coordinates. (E) Number of observed tissue-specific heteroplasmic mutations (y axis) in each class of mononucleotide and trinucleotide change. (F) Number of tissue-specific heteroplasmic mutations (y axis) at different allele frequency thresholds (x axis). (G) Number of tissue-specific heteroplasmic mutations (y axis) across the 10 tissues (x axis) with the largest number of tissue specific mutations in GTEx.
Figure 5.
Figure 5.. Mitochondrial mutations are stably propagated in primary hematopoietic cells.
(A) Overview of experiment. Hematopoietic colonies are derived from single primary CD34+ HSPCs in semi-solid media, which were then picked and sorted before performing scRNA-seq. (B-D) Expression profiles separate cells by types and not by donor. t-Stochastic Neighborhood Embedding (tSNE) plots of cells’ expression profiles, labeled by donor (B) or by expression of HBB (C, marking erythroid cells) or MPO (D, marking myeloid cells). (E-G) Mitochondrial mutation profiles separate cells by donor. tSNE plots of mitochondrial mutation profiles, with cells labeled by donor (E), a polymorphic mutation unique to donor 1 (F), or a heteroplasmic mutation present only in a specific colony (G). (H) Colony-specific mutations for Donor 1. Shown are the allele frequencies and base pair change of mutations (rows) that are found by supervised analysis as specific to the cells (columns) in each colony (sorted by colony membership; colored bar on top), color bar: allelic heteroplasmy (%). (I) 14 selected colony-specific mutations in Donor 1 colonies. Box plots show the distribution of heteroplasmy (%, y axis) in cells of a specific colony for the indicated mutation, and in the cells in all other colonies. Dots: individual cells.
Figure 6.
Figure 6.. Mitochondrial mutations identify clonal contributions in polyclonal mixtures of human cells.
(A-D) Determination of clones in primary hematopoietic cells. (A) Overview of experiment. CD34+ HSPCs are expanded, genotyped in bulk and single cells, and clonal origin is inferred. (B, C) Identification of confident cell subsets based on retained heteroplasmic mutations by unsupervised clustering of scRNA- or scATAC-seq using probabilistic k-medoids. Cells (columns) are sorted by unsupervised clustering on the variants (rows). Clusters: colored bar on top; grey: unassigned cells; color bar: allelic heteroplasmy (%). (D) Example locus with one clone-specific (left) and one shared (right) open chromatin peak recovered by mitochondrial clustering. (E-G) Relationship between mitochondrial mutations and TCR clones in human T lymphocytes. Each panel shows data from independent patients. (E) Shown are the allele frequencies of heteroplasmic mutations (rows) that are concordant with individual TCR clones (columns, color code). (F) Sub-clonal relations within a single TCR clone. Heteroplasmic mutations (rows) that differ between cells within a single TCR clone (columns). (G) Heteroplasmic mutations (rows) shared among a variety of TCR clones (columns, color code). Color bar: allelic heteroplasmy (%).
Figure 7.
Figure 7.. Application of mitochondrial mutation tracking in human cancer in vivo.
(A-F) Identification of clones in human colorectal cancer. (A) Cells from tumor and adjacent normal tissue are sorted based on EPCAM+ surface marker expression and genotyped using bulk ATAC-seq and scRNA-seq. (B) Identification of clonal subsets based on heteroplasmic mutations (rows) across cells (columns), sorted by unsupervised clustering (clusters: colored bar on top; grey: unassigned cells). Right: allele frequencies in the bulk healthy and tumor populations. (C) Heteroplasmy levels per single-cell. Colors and clusters are from panel B. (D-F) Clone of predominantly LGR5+ cells. tSNE of scRNA-seq profiles from the tumor, colored by expression for (D) LGR5 (E) MKI67 (Color bar: log2 counts per million) and (F) heteroplasmy of the 9000 T>C allele (color bar: % allelic heteroplasmy). (G) Near-perfect separation of donors based on mitochondrial genotypes. tSNE of mitochondrial mutation profiles of 2,145 single cells from 31 donors with CML, colored by donor ID. Boxes: Donors analyzed for sub-clones in (H-L). (H,I) Identification of putative sub-clonal structure within donors. tSNE of mitochondrial mutation profiles of cells from donor CML1266 (H), sampled at pre- (blue) and during (red) blast crisis, and for donor OX00812 (I), sampled at diagnosis and <6 months of treatment (magenta) or >6 months treatment (green). (J) Shown are the allele frequencies of three highly heteroplasmic mutations (rows) across BCR-ABL positive vs. negative cells (columns). Color bar: allelic heteroplasmy (%). (K) Consensus clustering of CML656 transcripts suggests variable annotation in BCR-ABL positive cells at diagnosis. Heatmap showing proportion of times (red/blue) that two cells (columns, rows) belong to the same cluster (STAR Methods). Color bars denote from top to bottom: time of collection, BCR-ABL status, and allele frequencies (6506 T>C, 4824 T>C). Boxes indicate cells where mitochondrial mutations suggest that the BCR-ABL status was incorrectly determined by the BCR-ABL genotyping assay alone. (L) Differentially expressed genes (x-axis) between cells in Cluster 1 comparing cells with and without the 4824 T>C mutation. P-value (y-axis) is from an empirical Bayes moderated t-test. (M) mtDNA mutations distinguish recipient- and donor-specific cells after HSCT in AML. Shown are the allele frequencies of one recipient-specific and one donor-specific mutation (rows) across single cells (columns) collected before and after transplant. Arrow: four recipient cells detected after transplant. Color bar: allelic heteroplasmy (%).

Comment in

  • Mitochondrial barcodes.
    Rusk N. Rusk N. Nat Methods. 2019 May;16(5):361. doi: 10.1038/s41592-019-0416-9. Nat Methods. 2019. PMID: 31040429 No abstract available.

References

    1. Alemany A, Florescu M, Baron CS, Peterson-Maduro J, and van Oudenaarden A (2018). Whole-organism clone tracing using single-cell sequencing. Nature 556, 108–112. - PubMed
    1. Bar-Yaacov D, Avital G, Levin L, Richards AL, Hachen N, Rebolledo Jaramillo B, Nekrutenko A, Zarivach R, and Mishmar D (2013). RNA-DNA differences in human mitochondria restore ancestral form of 16S ribosomal RNA. Genome Res 23, 1789–1796. - PMC - PubMed
    1. Biasco L, Pellin D, Scala S, Dionisio F, Basso-Ricci L, Leonardelli L, Scaramuzza S, Baricordi C, Ferrua F, Cicalese MP, et al. (2016). In Vivo Tracking of Human Hematopoiesis Reveals Patterns of Clonal Dynamics during Early and Steady-State Reconstitution Phases. Cell Stem Cell 19, 107–119. - PMC - PubMed
    1. Biezuner T, Spiro A, Raz O, Amir S, Milo L, Adar R, Chapal-Ilani N, Berman V, Fried Y, Ainbinder E, et al. (2016). A generic, cost-effective, and scalable cell lineage analysis platform. Genome Res 26, 1588–1599. - PMC - PubMed
    1. Buenrostro JD, Corces MR, Lareau CA, Wu B, Schep AN, Aryee MJ, Majeti R, Chang HY, and Greenleaf WJ (2018). Integrated Single-Cell Analysis Maps the Continuous Regulatory Landscape of Human Hematopoietic Differentiation. Cell 173, 1535–1548 e1516. - PMC - PubMed

Publication types