. 2019 Jun 4;29(6):1390-1399.e6.
doi: 10.1016/j.cmet.2019.02.001. Epub 2019 Feb 28.

Macrophage-Released Pyrimidines Inhibit Gemcitabine Therapy in Pancreatic Cancer

Affiliations

Macrophage-Released Pyrimidines Inhibit Gemcitabine Therapy in Pancreatic Cancer

Christopher J Halbrook et al. Cell Metab. .

Abstract

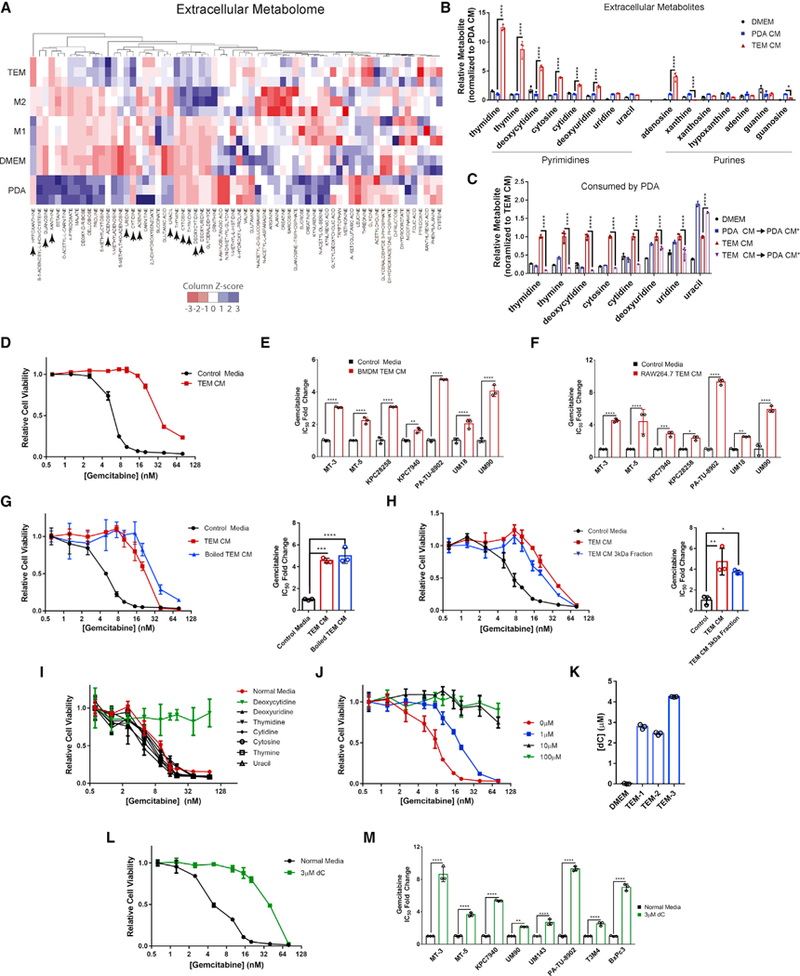
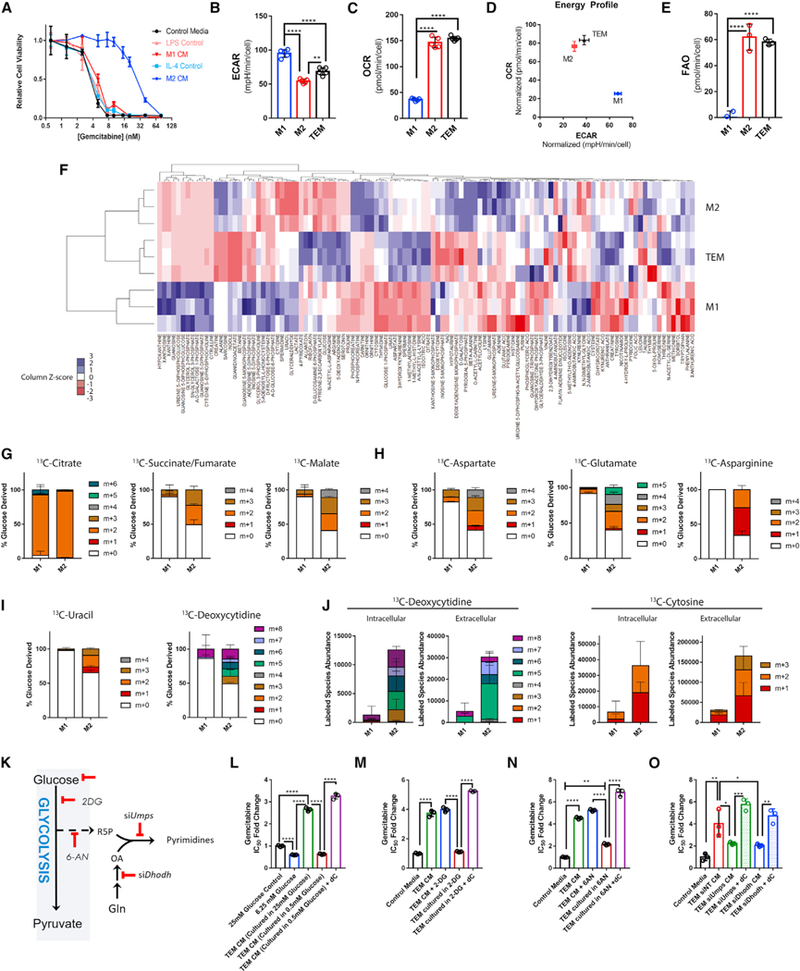
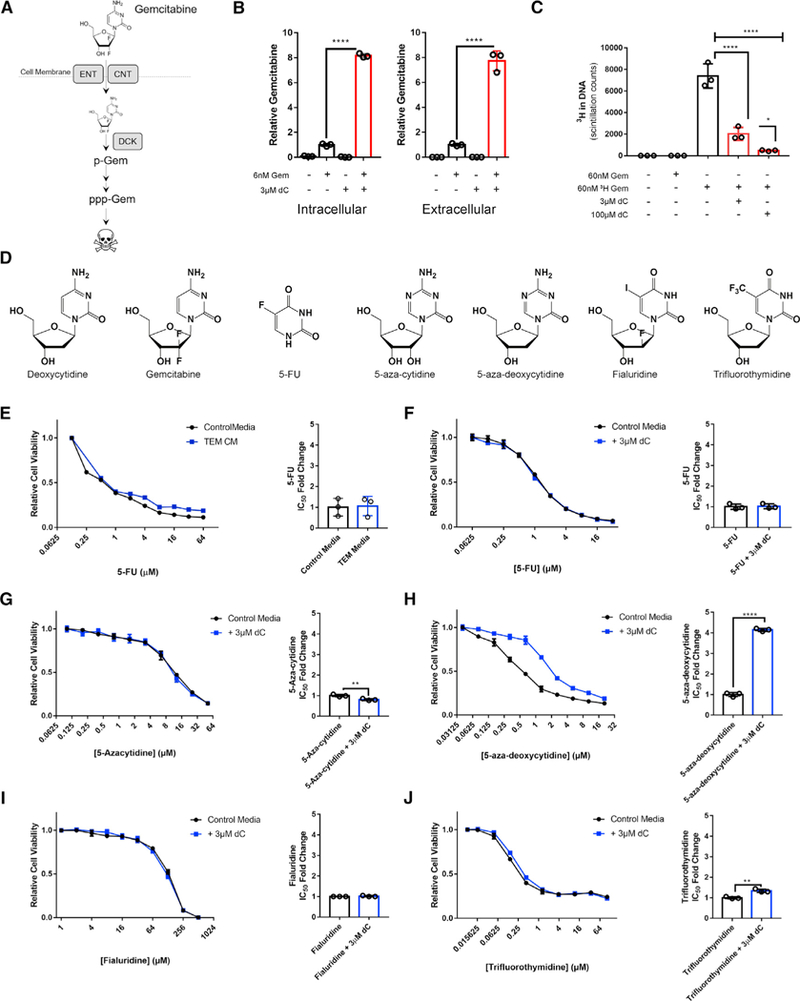
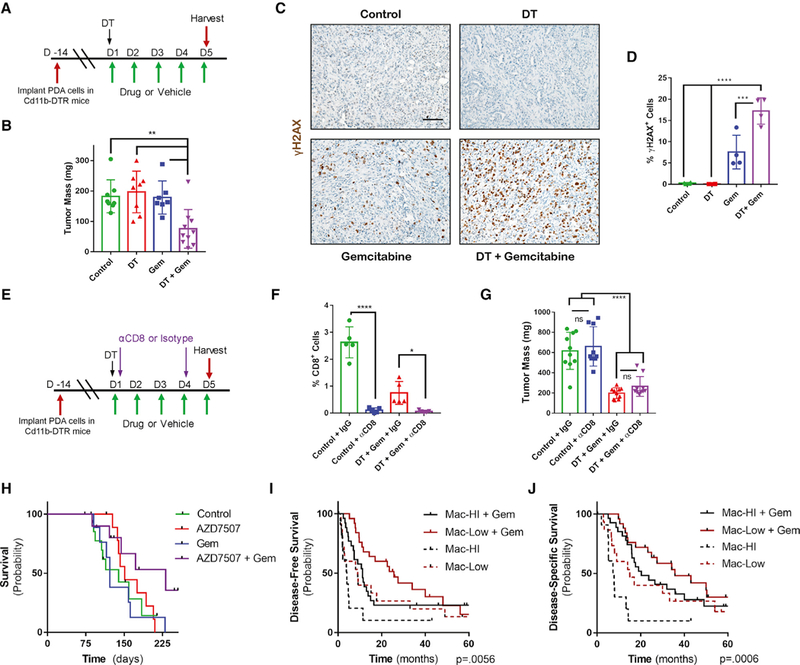
Pancreatic ductal adenocarcinoma (PDA) is characterized by abundant infiltration of tumor-associated macrophages (TAMs). TAMs have been reported to drive resistance to gemcitabine, a frontline chemotherapy in PDA, though the mechanism of this resistance remains unclear. Profiling metabolite exchange, we demonstrate that macrophages programmed by PDA cells release a spectrum of pyrimidine species. These include deoxycytidine, which inhibits gemcitabine through molecular competition at the level of drug uptake and metabolism. Accordingly, genetic or pharmacological depletion of TAMs in murine models of PDA sensitizes these tumors to gemcitabine. Consistent with this, patients with low macrophage burden demonstrate superior response to gemcitabine treatment. Together, these findings provide insights into the role of macrophages in pancreatic cancer therapy and have potential to inform the design of future treatments. Additionally, we report that pyrimidine release is a general function of alternatively activated macrophage cells, suggesting an unknown physiological role of pyrimidine exchange by immune cells.

Keywords: deoxycytidine; gemcitabine resistance; immunometabolism; macrophage; metabolic crosstalk; metabolomics; pancreatic cancer; pancreatic ductal adenocarcinoma; tumor microenvironment; tumor-associated macrophage.


Figures

Figure 1.
Figure 1.. TEMs Confer Gem Resistance to PDA Cells through dC Release
(A) Heat map of metabolites in the CM of TEM, M2, M1, iKras*3 PDA cell line, and DMEM. Blue represents higher relative metabolite, red represents lower relative metabolite. Metabolites with arrow are presented in (B) (n = 3). (B) Relative nucleoside species found in DMEM, PDA CM, and TEM CM, normalized to PDA CM (n = 3). (C) Relative pyrimidine nucleosides in DMEM, TEM CM, or PDA CM after 24 h of culture with iKras*3 PDA cells, normalized to initial TEM CM (n = 3). PDA CM* denotes post-culture with PDA cells. (D) Relative viability of MT3-KPC cells treated with Gem in the presence of 75% TEM CM versus control (n = 3). (E) Relative fold change of Gem IC50 between control or 75% CM from bone-marrow-derived macrophages (BMDM) polarized to TEMs (n = 3). (F) Relative fold change of Gem IC50 between control or 75% CM from RAW 264.7 macrophages polarized to TEMs (n = 3). (G) Relative viability and IC50 of MT3-KPC cells treated with Gem in the presence of 75% TEM CM, heat denatured TEM CM, or control (n = 3). (H) Relative viability and IC50 of MT3-KPC cells treated with Gem in the presence of 75% TEM CM, 75% TEM CM passed through a 3 kDa filter, or control (n = 3). (I) Relative viability of MT3-KPC cells treated with Gem in the presence of 100 μM of the indicated pyrimidine in DMEM or DMEM alone (n = 3). (J) Relative viability of MT3-KPC cells treated with Gem in the presence of the indicated concentration of dC in DMEM (n = 3). (K) Calculated abundance of dC from TEM CM generated by 3 independent TEM preparations, or DMEM, determined via LC-MS/MS (n = 3). (L) Relative viability of MT3-KPC cells treated with Gem in the presence of 3 μM dC versus DMEM (n = 3). (M) Relative fold change of Gem IC50 for cells treated with 3 μM dC versus DMEM (n = 3). Error bars represent mean ± SD, *p ≤ 0.05; **p ≤ 0.01; ***p < 0.001; ****p < 0.0001. See also Figure S1; Table S1.
Figure 2.
Figure 2.. Oxidative Metabolism of TEMs and M2 Macrophages Promote Pyrimidine Biosynthesis from Glucose
(A) Relative viability of MT3-KPC cells treated with gemcitabine (Gem) in the presence of M1 or M2 conditioned media (CM) versus control media (n = 3). (B) Basal extracellular acidification rates (ECAR) of TEM, M1, and M2 macrophages (n = 5). (C) Basal oxygen consumption rates (OCR) of TEM, M1, and M2 macrophages (n = 5). (D) Comparative energy profile of TEM, M1, and M2 macrophages comparing ECAR versus OCR. (E) Basal rate of exogenous fatty acid oxidation (FAO) of TEM, M1, and M2 macrophages (n = 5). (F) Heatmap representation of intracellular metabolites (replicate CV < 0.4) found in TEM, M1, and M2 macrophages by metabolomics profiling (n = 3). (G) Fractional labeling patterns from uniformly 13C-glucose of TCA cycle metabolites after 16 h in M1 versus M2 macrophages (n = 3). (H) Fractional labeling patterns from uniformly 13C-glucose of amino acids after 16 h in M1 versus M2 macrophages (n = 3). (I) Fractional labeling patterns from uniformly 13C-glucose of pyrimidines after 16 h in M1 versus M2 macrophages (n = 3). (J) Intra and extracellular abundance of pyrimidine isotopologues labeled as in (G–I) (n = 3). (K) Simplified pyrimidine biosynthesis pathway diagram. 2-DG, 2-deoxyglucose; 6-AN, 6-aminonicotinamide; Dhodh, dihydroorotate dehydrogenase; Gln, glutamine; R5P, ribose 5-phosphate; OA, Orotate; Umps, uridine 5′-monophosphate synthase. (L) Relative Gem IC50 of KPC-MT3 cells treated in normal DMEM (25 mM), 75% glucose restricted media (6.25 mM final), 75% CM from TEMs grown in normal DMEM, 75% CM from TEMs grown in glucose restricted media, or 75% CM from TEMs grown in glucose restricted media + 3 μM dC (n = 3). (M) RelativeGem IC50 in KPC-MT3 cells treated in DMEM, 75% TEM CM, TEM CM + 200 μM 2-DG, 75% CM from TEMs grown in 200 μM 2-DG, or 75% CM from TEMs grown in 200 μM 2-DG + 3 μMdC(n = 3). (N) RelativeGem IC50cin KPC-MT3cellstreated in DMEM,75% TEM CM,TEM CM + 1 μM 6-AN, 75% CM from TEMs grown in 1 μM 6-AN, or75% CM from TEMs grown in 1 μM 6-AN + 3 μM dC (n = 3). (O) Relative Gem IC50 in KPC-MT3 cells treated in normal DMEM, or 75% CM from TEMs transfected with siRNA targeting Dhodh, Umps, or nontargeting (NT) siRNA, or siDhodh, or siUmps CM + 3 μM dC (n = 3). Error bars represent mean ± SD, *p ≤ 0.05; **p ≤ 0.01; ****p < 0.0001. See also Figures S2 and S3; Table S2.
Figure 3.
Figure 3.. dC Blocks the Uptake and Incorporation of Gem and Other DCK-Activated Pyrimidine-Based Chemotherapies
(A) Schematic representation of the mechanism of Gem uptake and metabolism. ENT, equilibrative nucleoside transporter; CNT, concentrative nucleoside transporter; DCK, deoxycytidine kinase; p-Gem, Gem monophosphate; ppp-Gem, Gem triphosphate. (B) Relative intra and extracellular abundance of Gem in KPC-MT3 cells or media, respectively, after16h of treatment with 6 nM Gem in the presence or absence of 3 μM dC, as measured by LC-MS/MS (n = 3). (C) Incorporation of Gem into the DNA in KPC-MT3 cells treated with 60 nM 3H-labeled Gem in the presence or absence of dC (n = 3). (D) Chemical structures of dC and pyrimidine chemotherapies. (E) Relative viability and IC50 of MT3-KPC cells treated with 5-FU in the presence of 75% TEM CM versus control (n = 3). (F) Relative viability and IC50 of MT3-KPC cells treated with 5-FU in the presence of 75% 3 μM dC versus control (n = 3). (G–J) Relative viability and IC50 of MT3-KPC cells treated with 5-aza-cytidine(G), 5-aza-deoxycytidine(H), fialuridine (I), or trifluorothymidine (J) in the presence of 3 μM dC or control (n = 3). Error bars represent mean ± SD, *p ≤ 0.05; **p ≤ 0.01; ****p ≤ 0.0001. See also Figure S3; Table S3.
Figure 4.
Figure 4.. Macrophages Inhibit Gem Treatment; Burden Predicts Treatment Response
(A) Schematic of CD11b-DTR macrophage depletion tumor model with Gem treatment schedule. (B) Mass of vehicle- (n = 8), Gem- (n = 7), diphtheria toxin (DT) (n = 8), or DT + Gem (n = 10) KPC-MT3 tumors at endpoint. (C) Immunostaining of γH2AX in tumor tissue from (B) (n = 4). (D) Quantification of γH2AX in tumor tissue from (B) (n = 4). (E) Schematic of CD11b-DTR macrophage depletion tumor model with Gem treatment and CD8 depletion schedule. (F) Quantification of CD8 cells in vehicle + isotype control, vehicle + αCD8 antibody, DT + Gem + isotype control, or DT + Gem + αCD8 KPC-MT3 tumors at endpoint (n = 5). (G) Mass of vehicle + isotype control, vehicle + αCD8 antibody, DT + Gem + isotype control, or DT + Gem + αCD8 KPC-MT3 tumors at endpoint (n = 10). (H) Kaplan-Meier survival curve of control KPC mice (n = 15), KPC mice treated with AZD7507 (n = 11), KPC mice treated with Gem (n = 9), or KPC mice treated with AZD7507 + Gem (n =1 0). (I) Kaplan-Meier disease-free survival of human PDA patients with either high (n = 12) or low macrophage (n = 15) burden, compared to those treated with adjuvant Gem therapy (high n = 26, low n = 25), as determined by gene-expression signature. (J) Disease-specific survival of human PDA patients with either high (n = 12) or low macrophage (n = 15) burden, compared to treated with adjuvant Gem therapy (high n = 26, low n = 25), as determined by gene-expression signature. Error bars represent mean ± SD, *p ≤ 0.05 **p ≤ 0.01; ***p ≤ 0.001; ****p ≤ 0.0001. Scale bar, 100 μM. See also Figure S4; Table S4.

Comment in

References

    1. Austin WR, Armijo AL, Campbell DO, Singh AS, Hsieh T, Nathanson D, Herschman HR, Phelps ME, Witte ON, Czernin J, et al. (2012). Nucleoside salvage pathway kinases regulate hematopoiesis by linking nucleotide metabolism with replication stress. J. Exp. Med. 209, 2215–2228. - PMC - PubMed
    1. Bailey P, Chang DK, Nones K, Johns AL, Patch AM, Gingras MC, Miller DK, Christ AN, Bruxner TJ, Quinn MC, et al. (2016). Genomic analyses identify molecular subtypes of pancreatic cancer. Nature 531, 47–52. - PubMed
    1. Candido JB, Morton JP, Bailey P, Campbell AD, Karim SA, Jamieson T, Lapienyte L, Gopinathan A, Clark W, McGhee EJ, et al. (2018). CSF1R+ macrophages sustain pancreatic tumor growth through T cell suppression and maintenance of key gene programs that define the squamous subtype. Cell Rep. 23, 1448–1460. - PMC - PubMed
    1. Celada A, Gray PW, Rinderknecht E, and Schreiber RD (1984). Evidence for a gamma-interferon receptor that regulates macrophage tumoricidal activity. J. Exp. Med. 160, 55–74. - PMC - PubMed
    1. Conroy T, Desseigne F, Ychou M, Bouché O, Guimbaud R, Bécouarn Y, Adenis A, Raoul JL, Gourgou-Bourgade S, de la Fouchardière C, et al. (2011). FOLFIRINOX versus gemcitabine for metastatic pancreatic cancer. N. Engl. J. Med. 364, 1817–1825. - PubMed

Publication types

MeSH terms