. 2019 Mar 18;35(3):385-400.e9.
doi: 10.1016/j.ccell.2019.01.018. Epub 2019 Feb 28.

Increased Serine and One-Carbon Pathway Metabolism by PKCλ/ι Deficiency Promotes Neuroendocrine Prostate Cancer

Affiliations

Increased Serine and One-Carbon Pathway Metabolism by PKCλ/ι Deficiency Promotes Neuroendocrine Prostate Cancer

Miguel Reina-Campos et al. Cancer Cell. .

Abstract

Increasingly effective therapies targeting the androgen receptor have paradoxically promoted the incidence of neuroendocrine prostate cancer (NEPC), the most lethal subtype of castration-resistant prostate cancer (PCa), for which there is no effective therapy. Here we report that protein kinase C (PKC)λ/ι is downregulated in de novo and during therapy-induced NEPC, which results in the upregulation of serine biosynthesis through an mTORC1/ATF4-driven pathway. This metabolic reprogramming supports cell proliferation and increases intracellular S-adenosyl methionine (SAM) levels to feed epigenetic changes that favor the development of NEPC characteristics. Altogether, we have uncovered a metabolic vulnerability triggered by PKCλ/ι deficiency in NEPC, which offers potentially actionable targets to prevent therapy resistance in PCa.

Keywords: ATF4; PKClambda; aPKC; cancer metabolism; epigenetics; lineage plasticity; mTOR; neuroendocrine; prostate cancer; serine metabolism.


Conflict of interest statement

DECLARATION OF INTERESTS

The authors declare no competing interests.

Figures

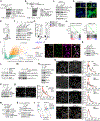
Figure 1.
Figure 1.. PKCλ/ι Expression is Downregulated in NEPC
(A) PRKCI mRNA levels in PCa datasets separated by Cancer vs. Normal (upper graph) (Tomlins$ denotes Benign Prostatic Hyperplasia Epithelia vs. Normal) and Metastasis vs. Primary cancer (lower graph) (Oncomine). (B) Odds Ratio of the overlap between the gene signatures “PRKCI correlated” and “PRKCI anticorrelated”, and clinical subgroups generated from the specified PCa datasets. Taylor: recurrence at 3 years ($) and 5 years ($ $). Taylor 3: recurrence at 1 (+), 3 (++) and 5 years (+++). (Oncomine). Cancer (C), Normal (N). (C) Recurrence free survival (RFS) of patients stratified by PRKCI mRNA expression in a published microarray gene expression dataset (GSE21034). Log-rank (Mantel-Cox) test. (D) PRKCI mRNA levels in Adenocarcinoma (Adeno) and NEPC samples. (E) PRKCI mRNA levels in GSE21034 samples classified. Adeno: Adenocarcinoma; MET: metastasis. (F) GSEA of NEPC signatures (Beltran et al 2011) in PRKCI correlated genes in GSE21034. (G) Pearson correlation analysis of PRKCI and NEPC markers in GSE21034. (H) Representative staining of PKCλ/ι and NCAM1, quantification (normalized values presented as mean fluorescence intensity (MFI)), and H&E, in a PCa cohort containing Adenocarcinoma (Adeno; n = 7) and NEPC (n = 14). Scale bars, 100 μm. (I) Western blot of PKCλ/ι and Actin loading control in the indicated cell lines (n = 3). (J) FACS analysis of CD44 or NCAM1 in LNCaP or LNCaP-ER cells (n = 3). (K) qPCR analysis of indicated genes in sorted CD44high or NCAM1high cells in arbitrary units (AU) and western blot of NCAM1 and PKCλ/ι in LNCaP or LNCaP-ER cells (n = 2). (L) Staining of PKCλ/ι and NCAM1 and quantification (normalized values) in an Adenocarcinoma (Adeno) with NEPC differentiation sample. Scale bars, 100 μm. (M) Gene expression levels of PRKCI, NCAM1 and KLK3 in a published RNA-seq gene expression dataset (GSE70380). V1_met: rib metastasis obtained during first visit, before treatment. V2_met: metastasis obtained during second visit after enzalutamide (enza) treatment for 12 weeks. Mean ± SEM (H, L, K). Two-tailed t-test (D, E, H, L, K). In (D) and (E), box and whiskers graphs indicate the median and the 25th and 75th percentiles, with minimum and maximum values at the extremes of the whiskers. *p < 0.05, **p < 0.01, ***p < 0.001. See also Figure S1.
Figure 2.
Figure 2.. Prostate-Specific Deletion of PTEN and PKCλ/ι Promotes Basal/NEPC Tumorigenesis In Vivo
(A) Overall survival of PTEN KO (n = 9) and DKO mice (n = 12). Log-Rank (Mantel-Cox) test. (B) Photographs of PTEN KO and DKO genitourinary organs. Scale bar, 5 mm. (C) Frequency of prostatic lesions and representative H&E of PTEN KO (n = 8) and DKO (n = 9) prostates. Invasive: Area of invasion into the stroma. Necrosis: area of comedo-type necrosis. mPIN1/2: low grade mouse intraepithelial neoplasia; mPIN3/4: high grade mouse intraepithelial neoplasia. Scale bars, 100 μm. Chi-square test. (D) Masson’s Trichrome staining of PTEN KO (n = 5) and DKO prostates (n = 7). Scale bar, 100 μm. (E) Ki67 and TP63 IHC of PTEN KO (n = 5) and DKO (n = 5) prostates. Scale bars, 200 μm. (F) Quantification of Ki67 and TP63 IHC from panel E. (G) Representative H&E of DKO prostate. Yellow line, prostatic urothelial carcinoma. Scale bars, 200 μm (H) CK5, CK8 and AR IHC of PTEN KO and DKO (n = 4) prostates. Arrows denote nuclei with lower AR staining. Scale bars, 30 μm. (I) CK5, CHGA, TP63, AR and Ki67 IHC of DKO prostate with magnification of prostatic urothelial carcinoma. Scale bar, 50 μm. (J) FACS analysis of NCAM1 of PTEN KO and DKO (n = 3) prostate basal cells. (K) Organoid growth of PTEN KO and DKO prostate-derived organoids (n = 3). Two-way ANOVA. (L) qPCR of indicated genes in PTEN KO and DKO-derived prostate organoids (n = 3–5). (M) Average organoid size of prostate cancer-derived organoids from PTEN KO and DKO mice treated with enzalutamide (enza, 10 μM) for 4 days (n = 3). Mean ± SEM (F, J, K-M). Two-tailed t-test (F, J, L, M). *p < 0.05, **p < 0.01, ***p < 0.001. See also Figure S2.
Figure 3.
Figure 3.. Loss of PKCλ/ι is Sufficient to Promote NEPC Differentiation at a Cellular Level
(A) Western blot of indicated proteins in shNT and shPKCλ/ι LNCaP cells. (B) qPCR of indicated NEPC-, Basal-, and AR-related genes in shNT and shPKCλ/ι LNCaP cells (n = 3–4). (C) Western blot of indicated proteins in sgC, sgPKCλ/ι and sgPKCλ/ι-R C42B cells (n = 3). (D) qPCR of indicated genes in sgC, sgPKCλ/ι and sgPKCλ/ι-R C42B cells (n = 3). (E) GSEA of NEPC signatures (Beltran et al 2011) in microarray data of shNT (NT) and shPKCλ/ι PrEC cells. (F) Cell proliferation of shNT and shPKCλ/ι LNCaP cells (n = 3) under androgen deprivation (ADT) with or without enzalutamide (enza, 10 μM). Western blot of PKCλ/ι. (G) qPCR of indicated genes in shNT and shPKCλ/ι LNCaP cells (n = 3–6). (H) Cell proliferation in ADT (n = 3) and western blot of PC3 cells expressing FLAG or FLAG-PKCλ/ι. (I) Cell proliferation of sgC and sgPKCλ/ι C42B cells in ADT (n = 3). (J) qPCR analysis of E2F1 mRNA levels in sgC and sgPKCλ/ι C42B cells (n = 4). (K) Tumor growth of xenografts of sgC, sgPKCλ/ι and sgPKCλ/ι-R C42B cells (n = 4–12). Mean ± SEM (B, D, F, G, H-K). Two-tailed t-test (B, D, G, J). Two-way ANOVA (F, H, I, K). *p < 0.05, **p < 0.01, ***p < 0.001. See also Figure S3.
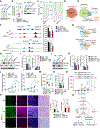
Figure 4.
Figure 4.. PKCλ/ι Regulates mTORC1 Activity through LAMTOR2 Phosphorylation
(A) Top 5 GSEA results of shPKCλ/ι vs. shNT comparison of PrEC cells using compilation H (MSigDb). (B) Top 5 GSEA results of sgPKCλ/ι vs. sgC and sgPKCλ/ι vs. sgPKCλ/ι-R comparisons of C42B cells using compilation H (MSigDb). (C) Western blot of indicated proteins in sgC, sgPKCλ/ι, sgPKCλ/ι-R WT and sgPKCλ/ι-R K274W C42B cells. (D) pS6 (Ser 235/236) IF of PTEN KO and DKO prostates (n = 4). Scale bar, 50 μM. (E) Quantification of pS6 in (D). (F) Western Blot of indicated proteins in sgC and sgPKCλ/ι C42B cells treated with 50 nM rapamycin (rapa). (G) qPCR of indicated genes in sgC and sgPKCλ/ι C42B cells treated with vehicle (Veh) or 50 nM rapamycin (n = 5). (H) GSEA of “mTORC1_Signaling” and “NEPC_UP” gene sets in the comparison of Torin1-treated LNCaP vs. vehicle, GSE93603. (I) Volcano plot of biotinylated proteins in PKCλ/ι-BioID2 vs. Empty-BioID2 LNCaP cells (n = 5). Uniques: Proteins identified only in PKCλ/ι-BioID2 cells, not present in Empty-BioID2 cells. (J) Double staining of PKCλ/ι and LAMTOR2 in LNCaP cells. Yellow dotted line marks the nuclei. Scale bar, 25 μM. (K) Co-IP of PKCλ/ι and LAMTOR2 in 293FT cells transfected with FLAG-LAMTOR2. (L) In vitro phosphorylation of recombinant LAMTOR2 by recombinant PKCλ/ι with ATPγS followed by PNBM alkylation and immunoblotting for the indicated proteins. (M) In vitro phosphorylation of FLAG-tagged WT and S30A LAMTOR2 immunoprecipitates by recombinant PKCλ/ι with ATPγS followed by PNBM alkylation and immunoblotting for the indicated proteins. (N) Western blot of indicated proteins in C42B cells transfected with WT or S30A FLAG-LAMTOR2. (O) Immunostaining for the indicated proteins and radial distribution profiling of mean intensities from the nucleus center in sgC and sgPKCλ/ι. Yellow dotted line marks the nuclei. Scale bars, 10 μM. Results are shown as mean from n = 6 cells per condition. Unadjusted multiple comparisons by t-test over 750 data points, significance of at least p < 0.05 indicated by black line. (P) Western Blot of indicated proteins in sgC and sgPKCλ/ι treated with Ciliobrevin D (40 μM) for 8 hr. (Q) LAMP2 staining and radial distribution profiling of mean intensities from the nucleus center (n = 6 cells, each condition) in LNCaP cells transfected with LAMTOR2 WT or LAMTOR2 S30A. Scale bars, 10 μM. Yellow dotted line marks the nuclei. Scale bars, 10 μM. Results are shown as mean from n = 6 cells per condition. Unadjusted multiple comparisons by t-test over 750 data points, significance of at least p < 0.05 indicated by black line (R) Co-IP of mTOR and LAMTOR2 in sgC and sgPKCλ/ι C42B cells transfected with FLAG-LAMTOR2. (S) Co-IP of mTOR and LAMTOR2 in 293FT cells transfected with FLAG-LAMTOR2 WT or S30A. (T) Model: the loss of PKCλ/ι promotes the perinuclear aggregation of lysosomes, which favors the interaction of mTOR with its co-activator Rheb. Mean ± SEM (E, G). two-tailed t-test (E, G). *p < 0.05, **p < 0.01, ***p < 0.001. q value is p value with adjustment for multiple hypotheses. See also Figure S4.
Figure 5.
Figure 5.. Loss of PKCλ/ι Increases Serine Metabolism through the mTORC1/ATF4/PHGDH axis
(A) Upstream regulator analysis by Ingenuity Pathway Analysis (IPA) of PKCλ/ι-dependent genes in C42B cells. (B) Western blot analysis of indicated proteins in sgC and sgPKCλ/ι C42B cells treated with 50 nM rapamycin (rapa). (C) ATF4 staining in PTEN KO and DKO prostates and quantification of nuclear ATF4+ cells (n = 5–7). Scale bar, 25 μM. (D) Western blot analysis of indicated proteins in sgPKCλ/ι and sgC stably transfected with shNT or shATF4. (E) qPCR of indicated genes in sgPKCλ/ι and sgC C42B cells stably transfected with shNT or shATF4 (n = 3). (F) Cell proliferation of sgPKCλ/ι and sgC C42B cells stably transfected with shNT or shATF4 (n = 3). (G) GSEA of the gene set “SGOCP” in the comparisons sgPKCλ/ι vs. sgC C42B cells (left) and sgPKCλ/ι-R vs. sgPKCλ/ι (right) and heatmap of PHGDH, PSAT1 and MTHFD2 expression with Log2FC values for the sgPKCλ/ι vs. sgC comparison. (H) Western blot of indicated proteins in sgC, sgPKCλ/ι, sgPKCλ/ι-R WT and sgPKCλ/ι-R KiD C42B cells. (I) qPCR of indicated genes in sgC and sgPKCλ/ι C42B cells stably transfected with shNT or shATF4 (n = 3). (J) qPCR of indicated genes in sgC and sgPKCλ/ι C42B cells treated with 50 nM rapamycin (n = 3). (K) Western blot analysis of indicated proteins in control and ATF4-transfected LNCaP cells. (L) qPCR of indicated genes in control and ATF4-transfected LNCaP cells (n = 3). (M) Western blot analysis of indicated proteins in sgPKCλ/ι and sgC C42B cells stably transfected with shNT or shPHGDH. (N) qPCR of indicated genes in sgC and sgPKCλ/ι C42B cells stably transfected with shNT or shPHGDH (n = 3). (O) Cell proliferation of sgC and sgPKCλ/ι C42B cells stably transfected with shNT or shPHGDH (n = 3). (P) Fraction of labeled [U-13C6]Glucose-derived intracellular serine and glycine (n = 3). Statistical significance for sgC vs. sgPKCλ/ι comparison. Mean ± SD. (Q) Isotopologue distribution (M0 to M3 according to labeled carbons) of [U-13C6]Glucose-derived intracellular serine and glycine in sgC (C), sgPKCλ/ι (λ/ι), sgPKCλ/ι-R WT (R) C42B cells (n = 3). (R) Fraction of labeled [α-15N]Glutamine-derived intracellular glutamate (Glu), serine (Ser) and glycine (Gly) at 24 hr in sgC, sgPKCλ/ι, and sgPKCλ/ι-R C42B cells (n = 3). Mean ± SEM (C, E, F, I, J, L, N, O, Q, R). Two-tailed t-test (C, E, I, J, L, N, R). *p < 0.05, **p < 0.01, ***p < 0.001. Two-way ANOVA (F,O,P). See also Figure S5.
Figure 6.
Figure 6.. Human Relevance of the mTOR/ATF4/PHGDH Axis in NEPC
(A) GSEA of “mTORC1 Signaling” Hallmark gene set in NEPC vs. Adeno (Adenocarcinoma) in two published human PCa datasets of RNA-seq (Beltran 2011) and microarray (GSE32967) gene expression. (B) Expression values of PRKCI, ATF4, ASNS and PHGDH in enzalutamide sensitive (Sen) and resistant (Res) C42B cells from a published microarray gene expression dataset (GSE64143). (C) Expression values of the indicated genes from a published RNA-seq gene expression dataset (GSE70380). V1_met: rib metastasis obtained during first visit, before treatment. V2_met: metastasis obtained during second visit after enzalutamide (enza) treatment for 12 weeks. (D) Heatmap of PRKCI, NE markers and SGOCP gene expression in a published RNA-seq dataset of patient derived prostate cancer organoid lines. (E) Expression for the indicated genes in Adenocarcinoma (Adeno) and NEPC samples in a published RNA-seq gene expression dataset (Beltran 2011). Box and whiskers graphs indicate the median and the 25th and 75th percentiles, with minimum and maximum values at the extremes of the whiskers. (F) IHC staining of p4EBP1 (Thr37/46) and H&E, with quantification (normalized values) in Adenocarcinoma (Adeno, n = 6) and NEPC (n = 10). Scale bars, 100 μm. (G) p4EBP1 (Thr37/46) and PHGDH IHC, and H&E staining, in a primary NEPC lesion with adenocarcinoma (yellow-dashed line) and an adjacent NEPC lesion (black-dashed line) with quantification of PHGDH staining (normalized values) in Adenocarcinoma (n = 6) and NEPC (n = 7). Scale bars, 100 μm. (H) Double staining of SYP and ATF4 with quantification of nuclear ATF4 in Adenocarcinoma (Adeno, n = 6) and NEPC (n = 13). White scale bars, 50 μm. Black scale bar, 100 μm. Quantification of ATF4 intensity. Mean ± SEM (F, G, H). Two-sided t-test (E, F, G, H). *p < 0.05, **p < 0.01, ***p < 0.001. See also Figure S6.
Figure 7.
Figure 7.. Loss of PKCλ/ι Increases DNA Methylation to Promote NEPC Differentiation
(A) Dot-blot analysis of total genomic DNA methylation levels of sgC shNT, sgPKCλ/ι shNT and sgPKCλ/ι shPHGDH C42B cells. Methyl blue (MB) staining for total genomic DNA loading. (B) Intracellular SAM levels in sgPKCλ/ι and sgC C42B cells with stable shPHGDH or shNT (n = 3), and western blot of indicated proteins. (C) Violin plot of pileup values (amount of reads at peak summit) for mapped regions of the Medip-seq in sgC and sgPKCλ/ι C42B cells, black lines show magnification of the 0 to 100 score region with median pileup value in red. (D) Venn diagram of overlap between differentially methylated regions (DMR) in sgC and sgPKCλ/ι C42B cells. (E) Venn diagram of overlap between differentially methylated regions (DMR) in sgPKCλ/ι cells and differentially expressed genes (DEG) in sgPKCλ/ι vs. sgC cells. (F) Medip-seq and qPCR of ADAMTS1 and CDKN1A in sgC and sgPKCλ/ι C42B cells stably transfected with shPHGDH or shNT (n = 3). (G) Venn diagram of gene overlap between DMR sgPKCλ/ι and Hypermethylated CpG regions in NEPC and between DMR sgPKCλ/ι and DMR in High Grade PCa. (H) Western blot of indicated proteins in sgC and sgPKCλ/ι C42B cells treated with 5 μM aza. (I) qPCR of indicated genes in sgC and sgPKCλ/ι C42B cells treated with 5 μM aza for 4 days (n = 3). (J) Western blot of indicated proteins in sgC and sgPKCλ/ι C42B cells treated with 2 mM cyclo for 6 days. (K) qPCR of indicated genes in sgC and sgPKCλ/ι C42B cells treated with 2 mM cyclo for 6 days. (L) Cell proliferation of sgC and sgPKCλ/ι C42B cells with cyclo or aza (n = 3). (M) Average size of PTEN KO and DKO prostate-derived organoids treated with 5 μM aza for 4 days (n = 3). (N) qPCR of Ncam1 in PTEN KO and DKO prostate-derived organoids treated as in (M; n = 3). (O) Tumor growth of xenografts of sgC shNT (n = 6), sgPKCλ/ι shNT (n = 5) and sgPKCλ/ι shPHGDH (n = 6) C42B cells treated with Veh, and sgPKCλ/ι shNT treated with aza (n = 4) starting at the time indicated by the arrow. (P) Staining and quantification of 5mC and NCAM1 in sgC and sgPKCλ/ι C42B xenograft tumors treated with veh or aza (n = 3) and H&E staining. Scale bars, 50 μm. (Q) Diagram of proposed mechanism. Mean ± SEM (B, F, I, K-P). Two-tailed T-test (B, F, I, K, M, N, P). *p < 0.05, **p < 0.01, ***p < 0.001. Two-way ANOVA (L, O). Hypergeometric test (E, G). See also Figure S7.

Comment in

References

    1. Aggarwal R, Huang J, Alumkal JJ, Zhang L, Feng FY, Thomas GV, Weinstein AS, Friedl V, Zhang C, Witte ON, et al. (2018). Clinical and Genomic Characterization of Treatment-Emergent Small-Cell Neuroendocrine Prostate Cancer: A Multi-institutional Prospective Study. J Clin Oncol 36, 2492–2503. - PMC - PubMed
    1. Antal CE, Hudson AM, Kang E, Zanca C, Wirth C, Stephenson NL, Trotter EW, Gallegos LL, Miller CJ, Furnari FB, et al. (2015). Cancer-associated protein kinase C mutations reveal kinase’s role as tumor suppressor. Cell 160, 489–502. - PMC - PubMed
    1. Bar-Peled L, Schweitzer LD, Zoncu R, and Sabatini DM (2012). Ragulator is a GEF for the rag GTPases that signal amino acid levels to mTORC1. Cell 150, 1196–1208. - PMC - PubMed
    1. Beltran H, Prandi D, Mosquera JM, Benelli M, Puca L, Cyrta J, Marotz C, Giannopoulou E, Chakravarthi BV, Varambally S, et al. (2016). Divergent clonal evolution of castration-resistant neuroendocrine prostate cancer. Nat Med 22, 298–305. - PMC - PubMed
    1. Beltran H, Rickman DS, Park K, Chae SS, Sboner A, MacDonald TY, Wang Y, Sheikh KL, Terry S, Tagawa ST, et al. (2011). Molecular characterization of neuroendocrine prostate cancer and identification of new drug targets. Cancer Discov 1, 487–495. - PMC - PubMed

Publication types

MeSH terms