. 2019 Jun;18(3):e12933.
doi: 10.1111/acel.12933. Epub 2019 Mar 3.

An early-senescence state in aged mesenchymal stromal cells contributes to hematopoietic stem and progenitor cell clonogenic impairment through the activation of a pro-inflammatory program

Affiliations

An early-senescence state in aged mesenchymal stromal cells contributes to hematopoietic stem and progenitor cell clonogenic impairment through the activation of a pro-inflammatory program

Daniela Gnani et al. Aging Cell. 2019 Jun.

Abstract

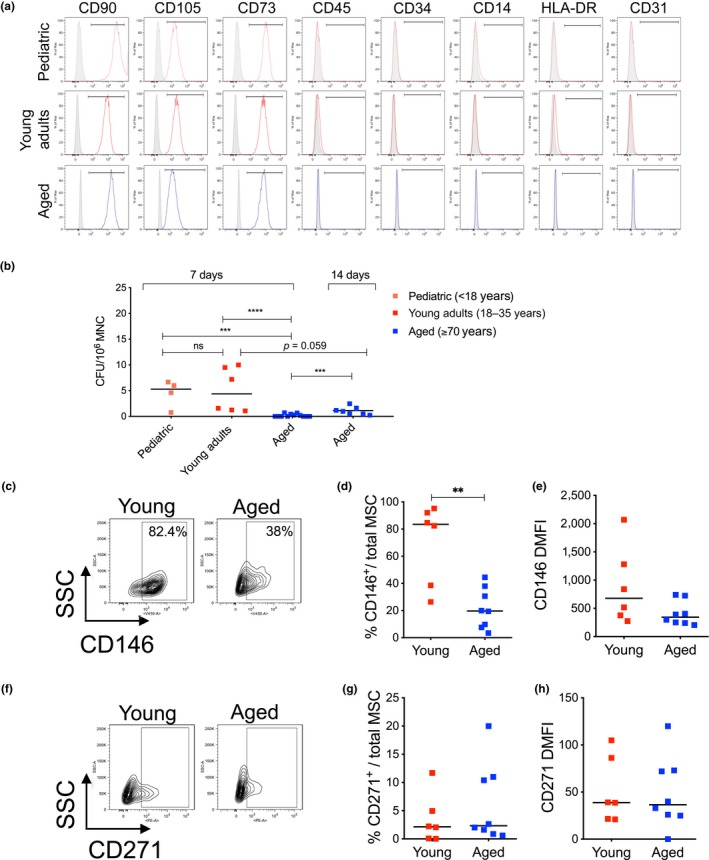
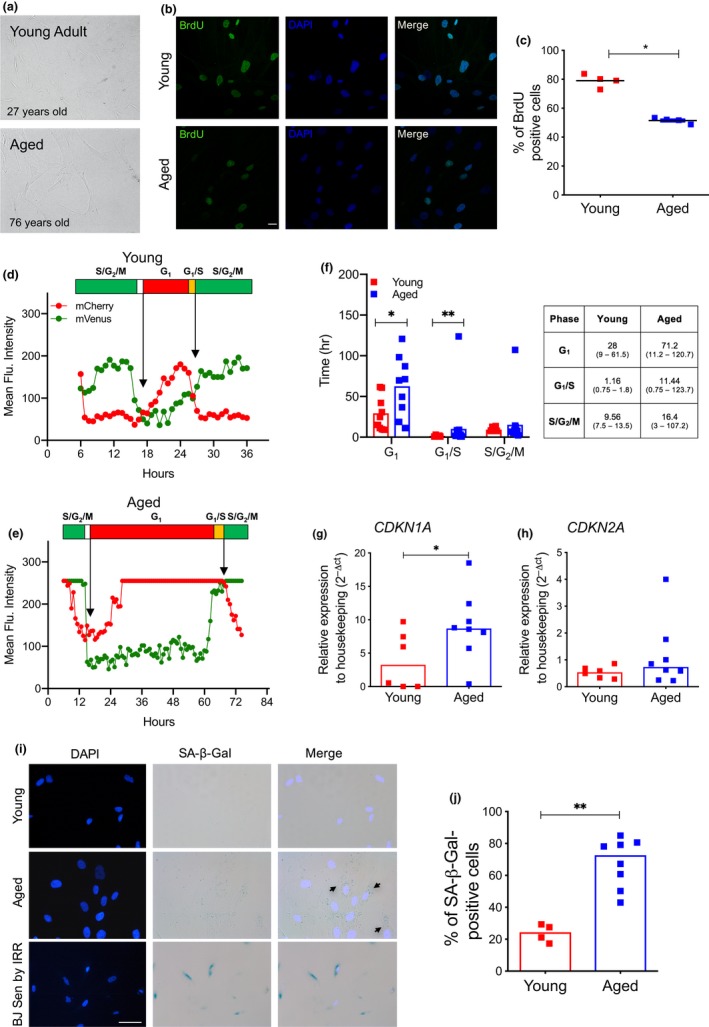
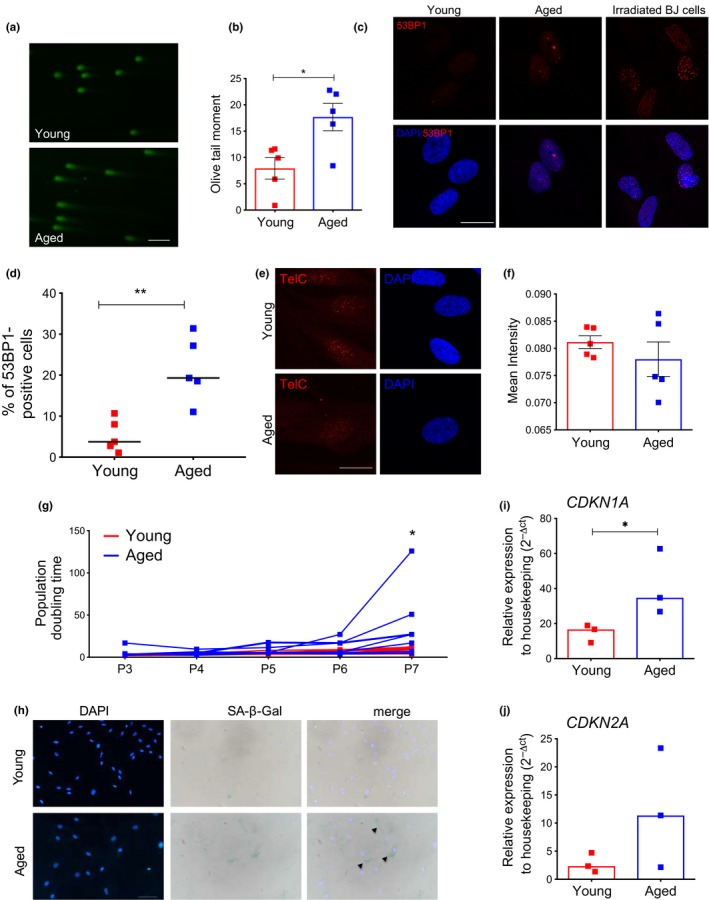
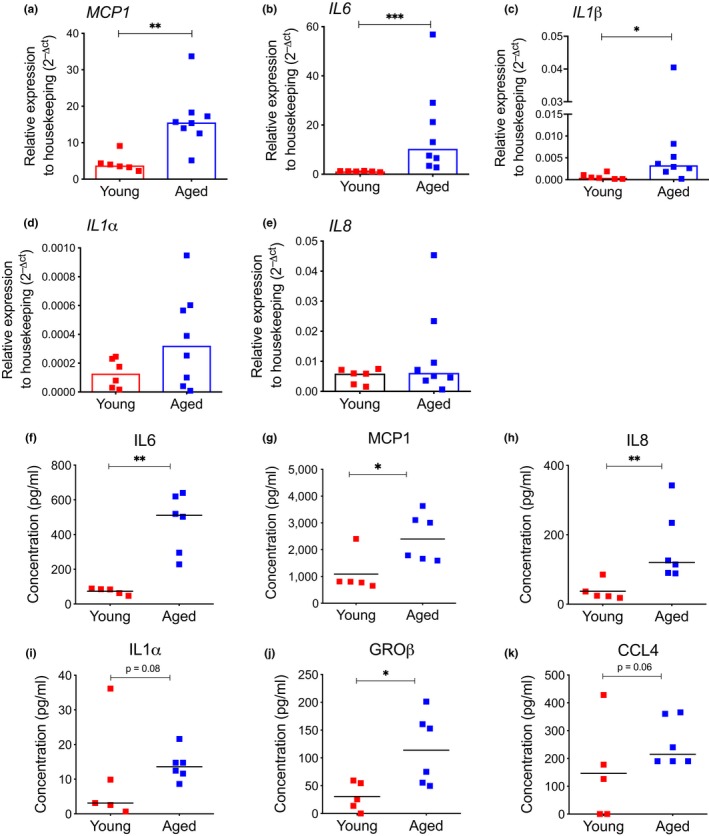
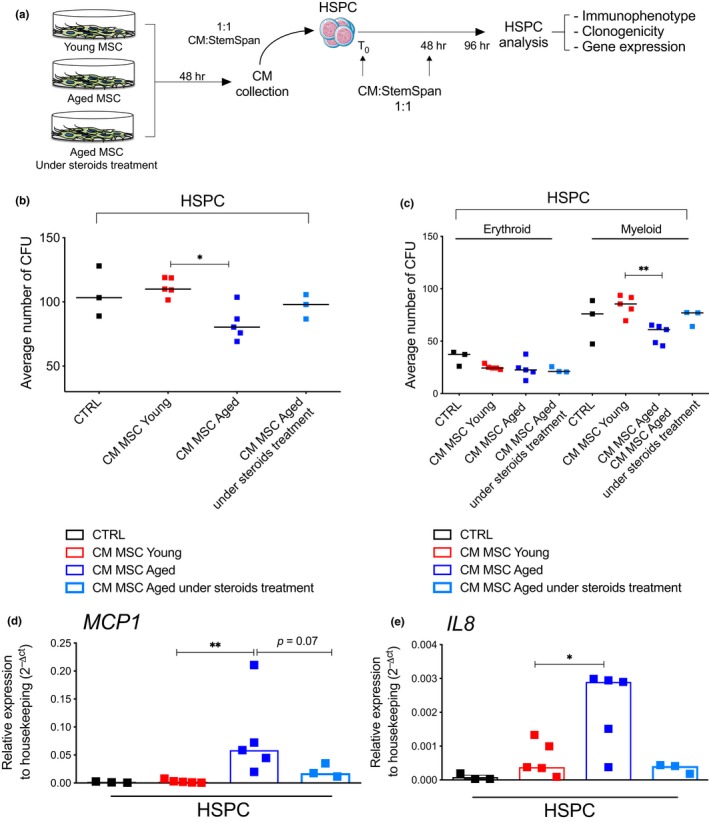
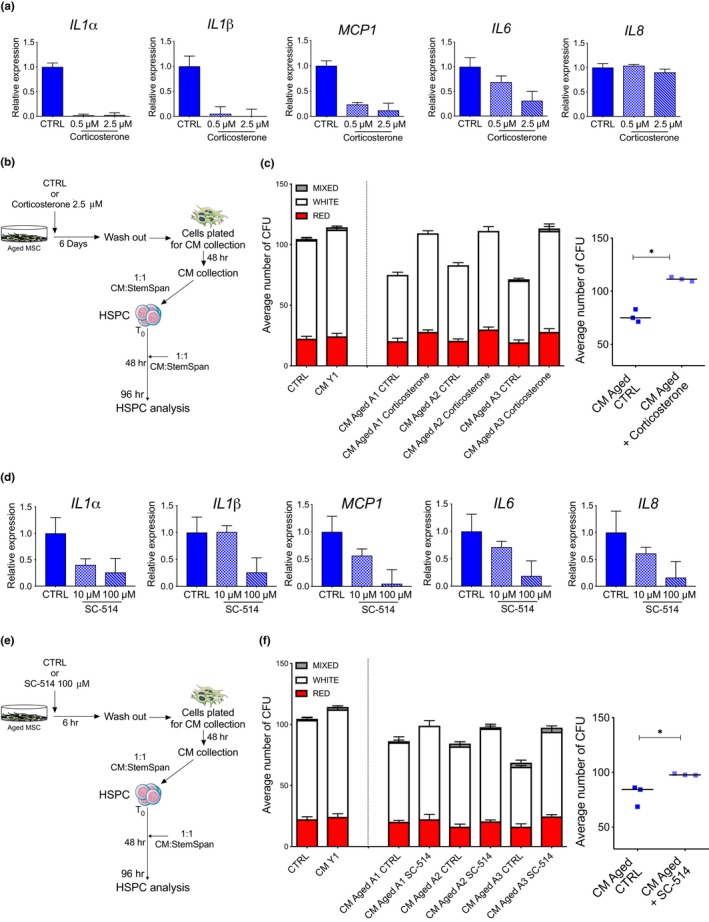
Hematopoietic stem and progenitor cells (HSPC) reside in the bone marrow (BM) niche and serve as a reservoir for mature blood cells throughout life. Aging in the BM is characterized by low-grade chronic inflammation that could contribute to the reduced functionality of aged HSPC. Mesenchymal stromal cells (MSC) in the BM support HSPC self-renewal. However, changes in MSC function with age and the crosstalk between MSC and HSPC remain understudied. Here, we conducted an extensive characterization of senescence features in BM-derived MSC from young and aged healthy donors. Aged MSC displayed an enlarged senescent-like morphology, a delayed clonogenic potential and reduced proliferation ability when compared to younger counterparts. Of note, the observed proliferation delay was associated with increased levels of SA-β-galactosidase (SA-β-Gal) and lipofuscin in aged MSC at early passages and a modest but consistent accumulation of physical DNA damage and DNA damage response (DDR) activation. Consistent with the establishment of a senescence-like state in aged MSC, we detected an increase in pro-inflammatory senescence-associated secretory phenotype (SASP) factors, both at the transcript and protein levels. Conversely, the immunomodulatory properties of aged MSC were significantly reduced. Importantly, exposure of young HSPC to factors secreted by aged MSC induced pro-inflammatory genes in HSPC and impaired HSPC clonogenic potential in a SASP-dependent manner. Altogether, our results reveal that BM-derived MSC from aged healthy donors display features of senescence and that, during aging, MSC-associated secretomes contribute to activate an inflammatory transcriptional program in HSPC that may ultimately impair their functionality.

Keywords: DNA damage; SASP; aging; hematopoietic stem and progenitor cells; inflammation; mesenchymal stromal cells; senescence.


Conflict of interest statement

None Declared.

Figures

Figure 1
Figure 1
Biological characterization of young and aged MSC. (a) Representative flow cytometric plots of immunophenotypic characterization of MSC from pediatric, young adults, and aged subjects. Canonical MSC markers: CD90, CD105, and CD73. Hematopoietic markers: CD45, CD34, and CD14. MHC class II marker: HLA‐DR. Endothelial marker: CD31. (b) Colony‐formation assay (CFU‐F) at day 7 and day 14 after the initial seeding. Data are expressed as CFU/106 MNC plated and shown as scatter dot plot; lines indicate median values (pediatric, n = 4; young adults, n = 6; aged, n = 12). p‐value was determined by Mann–Whitney test; ****p  < 0.0001; ***p < 0.001. (c) Representative flow cytometric analysis of CD146 in young and aged MSC. (d) Frequency of CD146‐positive cells and (e) level of CD146 expression (DMFI) in young and aged MSC (young, n = 6; aged, n = 8); p‐value was determined by Mann–Whitney test; **p  < 0.01. (f) Representative flow cytometric analysis of CD271 in young and aged MSC. (g) Frequency of CD271‐positive cells and (h) level of CD271 expression in young and aged MSC (young, n = 6; aged, n = 8). In all panels, each squared dot represents an individual MSC donor (red = young; blue = aged)
Figure 2
Figure 2
Aged MSC are characterized by an early senescent state. (a) Representative brightfield images of BM‐derived MSC isolated from young and aged donors at early passages in culture. (b) Representative confocal images of BrdU incorporation assay in young and aged MSC. DAPI indicates nuclei, scale bar = 20µm (young, n = 4; aged, n = 4). Quantification of BrdU‐positive cells is shown in (c). p‐value was determined by Mann–Whitney test; *< 0.05. (d–e) Representative cell cycle kinetics of young (d) and aged (e) MSC as determined by mean fluorescent intensity from Fucci2A‐transduced cells. (f) Quantification of cell cycle kinetics of MSC from one young and two aged MSC donors measured in hours. 10 cells per each donor were analyzed in live imaging up to 6 days. Each squared dot represents a complete phase of cell cycle. Data from two aged MSC samples were represented as a unified group. The median duration of cell cycle phases, with the minimum and maximum length in brackets (hours), is reported in the table. p‐value was determined by Mann–Whitney test; **p  < 0.01; *p < 0.05; ns p > 0.05. (g–h) Relative mRNA expression of CDKN1A (g) and CDKN2A (h) as measured by quantitative Real‐Time PCR. Gene expression data are represented as 2−△CT relative to GUSB housekeeping. Each squared dot represents an individual MSC donor (young, n = 6; aged, n = 8) (red = young; blue = aged); lines indicate median 2−△CT values. p‐value was determined by Mann–Whitney test; *p < 0.05. (i) Representative pictures and quantification (j) of SA‐β‐Gal‐positive MSC isolated from young and aged donors at early passages. Human senescent fibroblasts (BJ) induced into senescence by irradiation are shown as positive control for SA‐β‐Gal staining in (i). DAPI was used to stain nuclei. Scale bar = 50 µm (young, n = 4; aged, n = 8). p‐value was determined by Mann–Whitney test; **p  < 0.01
Figure 3
Figure 3
Aged MSC accumulate DNA damage and display modest DDR activation. (a) Representative fluorescence pictures of DNA damage in young and aged MSC as detected by comet assay; scale bar = 50 µm. (b) Quantification of alkaline comet assay carried out in young and aged MSC at early passages in culture (young, n = 5; aged, n = 5); up to 75 nuclei per sample were analyzed; histograms represent mean olive tail moment value ±SEM of young and aged MSC; p‐value was determined by Mann–Whitney test; *p  < 0.05. (c) Representative confocal pictures and (d) immunofluorescence quantification for 53BP1 foci‐positive cells in young and aged MSC at early passages in culture. Human BJ fibroblasts analyzed 2 hr post irradiation (20 Gy) were shown as positive control for 53BP1 nuclear staining in (c). Nuclei were counterstained with DAPI; scale bar = 20 µm (young, n = 5; aged, n = 5); p‐value was determined by Mann–Whitney test; **p  < 0.01. (e) Representative z‐stack confocal pictures of telomeric signal in young and aged MSC. Each red dot represents a telomere identified by a PNA probe against telomeric sequences. Scale bar = 20 µm. (f) Mean intensity of telomeric signal quantification was calculated with cell profiler (young, n = 5; aged, n = 5). Histograms represent mean values ±SEM of MSC samples analyzed (red = young; blue = aged). At least 20 nuclei were analyzed per sample with identical laser parameters. DAPI was used to stain nuclei. Scale bar = 20 µm. (g) Population doubling (PD) time of young (red lines) and aged (blue lines) MSC from passage 3 (P3) to passage 7 (P7); each line represents values of individual donors at each time point (young, n = 7; aged n = 7). p‐value was determined by Mann–Whitney test at passage 7; *p < 0.05. (h) Representative pictures of SA‐β‐Gal staining of MSC isolated from young and aged MSC at late passages (P10). Arrows indicate positive cells; scale bar = 200µm. (i–j) Relative mRNA expression of CDKN1A (i) and CDKN2A (j) measured by quantitative real‐time PCR at late passages in culture. Gene expression data are represented as 2−△CT relative to GUSB housekeeping. Histograms indicate median 2−△CT values, and each squared dot represents an individual MSC donor (red = young; blue = aged) (young, n = 3; aged, n = 3). p‐value was determined by Mann–Whitney test; *p  < 0.05
Figure 4
Figure 4
Aged MSC display activation of SASP. (a–e) Gene expression analysis for MCP1, IL6, IL1β, IL1α, and IL8 by quantitative real‐time PCR in young and aged MSC. Gene expression data are represented as 2−△CT relative to GUSB housekeeping. Histograms indicate median 2−△CT values (young, n = 6; aged, n = 8); p‐value was determined by Mann–Whitney test; ***p  < 0.001; **p  < 0.01; *p < 0.05. (f–k) Levels of IL6, MCP1, IL8, IL1α, GRO‐β, and CCL4 measured by Luminex assay in conditioned medium (CM) collected from young and aged MSC at early passages in culture. Values are represented as scatter dot plot; lines indicate median values (young, n = 5; aged, n = 6). p‐value was determined by Mann–Whitney test; **p  < 0.01; *p < 0.05
Figure 5
Figure 5
Paracrine effects of young and aged MSC secretomes on young HSPC. (a) Schematic representation of conditioned medium (CM) experiments with CM from young MSC, aged MSC and aged MSC under steroids treatment on cord blood (CB)‐derived CD34+cells (HSPC). Upon 96 hr of CM exposure, HSPC were analyzed for immunophenotype, clonogenicity, and gene expression. (b) Average number of HSPC colonies in methylcellulose analyzed at 96 hr post‐CM exposure. CM was collected from MSC derived from healthy young and aged donors, as well as from aged donors under chronic steroids treatment. Each dot represents average number of colonies generated from individual donors. CD34+ cells (CTRL) grown without CM from MSC were used as control. (CTRL, n = 3; young, n = 5; aged, n = 5; aged under steroids treatment, n = 3). p‐value was determined by Mann–Whitney test; *p  < 0.05. (c) Distribution of erythroid and myeloid HSPC colonies in methylcellulose analyzed at 96 hr post exposure to CM from young MSC, aged MSC, and aged MSC from subjects under chronic steroids treatment. Each dot represents average number of colonies generated from individual donors. Lines indicate median values for each group. CD34+ cells (CTRL) grown without CM from MSC were used as control. (CTRL, n = 3; young, n = 5; aged, n = 5; aged under steroids treatment, n = 3). p value was determined by Mann–Whitney test; **p < 0.01. (d–e) Gene expression analysis of MCP1 and IL8 by quantitative real‐time PCR in CB‐derived HSPC cultured for 96 hr either in the absence (CTRL) or in the presence of CM derived from young MSC, aged MSC, and aged MSC from subjects under chronic steroids treatment. Gene expression data are represented as 2−△CT relative to GUSB housekeeping, histograms indicate median 2−△CT values (CD34+ CTRL n = 3; young, n = 5; aged, n = 5; aged under steroids treatment, n = 3); p‐value was determined by Mann–Whitney test; **p  < 0.01; *p < 0.05
Figure 6
Figure 6
SASP inhibitors rescue the clonogenic impairment of young HSPC exposed to CM from aged MSC. (a) Relative mRNA levels of IL1α, IL1β, MCP1, IL6, and IL8 revealed by quantitative real‐time PCR in late passages aged MSC treated with vehicle CTRL (Ethanol), 0.5 µM, or 2.5 µM corticosterone for 6 days. GUSB was used as housekeeping gene; histograms represent fold change + SD relative to CTRL. (b) Experimental design to test the paracrine effect of corticosterone‐treated early passages aged MSC on young HSPC functionality. (c) Left panel. Number of HSPC colonies in methylcellulose analyzed at 96 hr postexposure to CM derived from aged MSC treated or not with 2.5 µM corticosterone for 6 days. Red, white, and light gray bars represent erythroid, myeloid, and mix colonies, respectively. CD34+cells grown without CM (CTRL) or with CM derived from young MSC were used as controls. Error bars indicate SD of three technical replicates for each individual sample. Right panel. Each dot represents average number of colonies generated from donors (aged CTRL, n = 3; aged treated with 2.5 µM corticosterone, n = 3). p‐value was determined by Mann–Whitney test; *p  < 0.05. (d) Gene expression analysis for IL1α, IL1β, MCP1, IL6, and IL8 measured by quantitative real‐time PCR in aged MSC treated for 6 hr with vehicle CTRL (DMSO), 10 µM, or 100 µM of the IKK‐2 inhibitor SC‐514. GUSB was used as housekeeping gene; histograms represent fold change + SD relative to CTRL. (e) Experimental design to test the paracrine effect of SC‐514‐treated early passages aged MSC on young HSPC functionality. (f) Left Panel. Number of HSPC colonies in methylcellulose analyzed at 96 hr postexposure to CM derived from aged MSC treated or not with 100 µM SC‐514 for 6 hr. Red, white, and light gray bars represent erythroid, myeloid, and mix colonies, respectively. CD34+cells grown without CM (CTRL) or with CM derived from young healthy MSC were used as controls. Error bars indicate SD of three technical replicates for each sample. Right Panel. Each dot represents average number of colonies generated from donors (aged CTRL, n = 3; aged treated with 100 µM SC‐514, n = 3). p‐value was determined by Mann–Whitney test; *p  < 0.05

Similar articles

Cited by

References

    1. Acosta, J. C. , Banito, A. , Wuestefeld, T. , Georgilis, A. , Janich, P. , Morton, J. P. , … Gil, J. (2013). A complex secretory program orchestrated by the inflammasome controls paracrine senescence. Nature Cell Biology, 15(8), 978–990. 10.1038/ncb2784 - DOI - PMC - PubMed
    1. Acosta, J. C. , O'Loghlen, A. , Banito, A. , Guijarro, M. V. , Augert, A. , Raguz, S. , … Gil, J. (2008). Chemokine signaling via the CXCR2 receptor reinforces senescence. Cell, 133(6), 1006–1018. 10.1016/j.cell.2008.03.038 - DOI - PubMed
    1. Adams, G. B. , Martin, R. P. , Alley, I. R. , Chabner, K. T. , Cohen, K. S. , Calvi, L. M. , … Scadden, T. (2007). Therapeutic targeting of a stem cell niche. Nature Biotechnology, 25(2), 238–243. 10.1038/nbt1281 - DOI - PubMed
    1. Avanzini, M. A. , Bernardo, M. E. , Cometa, A. M. , Perotti, C. , Zaffaroni, N. , Novara, F. , … Locatelli, F. (2009). Generation of mesenchymal stromal cells in the presence of platelet lysate: A phenotypic and functional comparison of umbilical cord blood‐ and bone marrow‐ derived progenitors. Haematologica, 94(12), 1649–1660. 10.3324/haematol.2009.006171 - DOI - PMC - PubMed
    1. Bernardo, M. E. , & Fibbe, W. E. (2013). Mesenchymal stromal cells: Sensors and switchers of inflammation. Cell Stem Cell, 13(4), 392–402. 10.1016/j.stem.2013.09.006 - DOI - PubMed

Publication types

MeSH terms