. 2019 Jun;286(12):2277-2294.
doi: 10.1111/febs.14802. Epub 2019 Mar 18.

RAF dimers control vascular permeability and cytoskeletal rearrangements at endothelial cell-cell junctions

Affiliations

RAF dimers control vascular permeability and cytoskeletal rearrangements at endothelial cell-cell junctions

Coralie Dorard et al. FEBS J. 2019 Jun.

Abstract

The endothelium functions as a semipermeable barrier regulating fluid homeostasis, nutrient, and gas supply to the tissue. Endothelial permeability is increased in several pathological conditions including inflammation and tumors; despite its clinical relevance, however, there are no specific therapies preventing vascular leakage. Here, we show that endothelial cell-restricted ablation of BRAF, a kinase frequently activated in cancer, prevents vascular leaking as well metastatic spread. BRAF regulates endothelial permeability by promoting the cytoskeletal rearrangements necessary for the remodeling of VE-Cadherin-containing endothelial cell-cell junctions and the formation of intercellular gaps. BRAF kinase activity and the ability to form complexes with RAS/RAP1 and dimers with its paralog RAF1 are required for proper permeability control, achieved mechanistically by modulating the interaction between RAF1 and the RHO effector ROKα. Thus, RAF dimerization impinges on RHO pathways to regulate cytoskeletal rearrangements, junctional plasticity, and endothelial permeability. The data advocate the development of RAF dimerization inhibitors, which would combine tumor cell autonomous effect with stabilization of the vasculature and antimetastatic spread.

Keywords: RAF kinases; cell-cell adhesions; cytoskeletal rearrangements; vascular permeability.


Conflict of interest statement

The authors declare no conflict of interest.

Figures
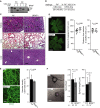
Figure 1
Figure 1
BRAF ablation does not impact embryonic development, tissue architecture, vessel maturation, and sprouting in 3D fibrin gels. (A) Efficient conversion of the flox to the Δ allele in VEC‐Cre pMECs. (B) BRAF Δ/Δ mice are viable and fertile. The number of mice recovered from F/F X F/F, VEC‐Cre intercrosses are shown. (C) BRAF ablation does not cause gross anomalies in the architecture of kidneys, lung, and liver. Tissue architecture was assessed from organs isolated from 8‐week‐old mice and stained with H&E to examine morphology. Scale bars represent 100 μm. (D) Slight increase in the progression of the angiogenic front in postnatal retinal development. The superficial vascular plexus in F/F and BRAF Δ/Δ mice is shown by tile‐scanning, composite confocal pictures of individual fields taken with a 10 × objective. Whole mounts were stained with CD31 antibody to visualize endothelial cells. Scale bar represents 1 mm. The graphs show the distance of the angiogenic front from the central optical nerve head (left) and the distance between arteries and the capillary bed (right) in (n = 7) F/F and (n = 8) BRAF Δ/Δ retinas. The P value was calculated according to Student's t‐test. (E) BRAF ablation does not influence the vascularization of subcutaneous Matrigel plugs containing FGF‐2 and VEGF (1 μg each). Whole‐mount plugs isolated from F/F (n = 5) and BRAF Δ/Δ (n = 4) mice were stained with CD31 antibody. CD31‐positive areas were quantified and are plotted in the graph. (F) BRAF ablation does not impact in vitro sprouting in 3D fibrin gels. pMECs were allowed to adhere to microcarriers and embedded in fibrin gels containing FGF‐2 and VEGF (200 ng·mL−1 each). Each pMEC sample consists of a pool of three animals. The number of sprouts/beads and the length of sprouts were microscopically assessed after 3 days in culture. The bar graphs represent means ± SD of biological replicas (E) or technical replicates (F; n equals the number of microcarriers and sprouts evaluated). Scale bars represent 50 μm (E) or 100 μm (F). The P values were calculated according to Student's t‐test.
Figure 2
Figure 2
Endothelial BRAF ablation reduces paracellular permeability. (A) Decreased response of BRAF Δ/Δ pMEC monolayers to permeability‐inducing factors. Paracellular permeability was measured as the leakage of high molecular weight FITC‐Dextran across pMEC monolayers stimulated with VEGF (200 ng·mL−1), histamine (100 μm), or thrombin (10 U·mL−1). Values are normalized to PBS controls (shown as 1) and are means ± SEM of four independent experiments. (B) BRAF ablation slightly increases transendothelial resistance (TER) of pMECs monolayers, as measured by the Roche xCELLigence system. F/F and BRAF Δ/Δ endothelial monolayers’ cell index numbers were measured and compared for 9 h after plating. Values are means ± SD of 3 technical replicates. (C, D) BRAF ablation decreases the TER drop stimulated by VEGF. The data in C represent a typical plot obtained by stimulating pMEC with VEGF (200 ng·mL−1) or PBS 9 h after plating. Cell indexes of PBS‐treated cultures were set to 0 (dotted line; baseline values) and changes in transendothelial electrical resistance (TER) were monitored for 40 min, at which time both genotypes had returned to, or exceeded, baseline values. The data in D show a comparison of the maximum drop in TER (normalized to PBS controls) induced by VEGF in F/F and BRAF‐deficient pMECs and are means ± SD of three technical replicates. F/F values were set to −1 to allow comparison among experiments. P values were calculated according to Student's t‐test.
Figure 3
Figure 3
BRAF ablation reduces intercellular gap formation and VEGF‐induced signaling to the cytoskeleton independently of ERK. (A) Intercellular gap and RSF formation induced by VEGF (50 ng·mL−1) are decreased in BRAF‐deficient pMEC monolayers. Arrows indicate intercellular gaps. The staining shows VE‐Cadherin (green), F‐actin (phalloidin, red) and cell nuclei (DAPI, blue). Scale bar represents 20 μm. The bottom panel shows a silhouette representation showing the gaps in black. B, Reduced RSF and increased CABs in quiescent BRAF Δ/Δ pMEC monolayers. F‐actin (phalloidin, red), VE‐Cadherin (green), and nuclei (DAPI, blue) staining are shown. Scale bar = 20 μm. The magnetic beads used for purifying the pMECs autofluoresce in green. C, Reduced F/G‐actin ratio in BRAF Δ/Δ pMECs. Filamentous and globular actin from F/F and BRAF Δ/Δ pMECs were separated by ultracentrifugation and their percentage was determined by immunoblotting. The bars represent the mean ± SD of immunoblots from three independent experiments analyzed using the imagej software. (D, E) the EPAC/RAP1 activator 007 changes the morphology and increases transendothelial resistance (TER; measured as in Fig. 2C) of F/F pMEC monolayers, rendering them more similar to BRAF‐deficient pMECs. D, F‐actin (phalloidin, red), VE‐Cadherin (green) and nuclei (DAPI, blue) staining are shown. Scale bar = 20 μm. The magnetic beads used for purifying the pMECs autofluoresce in green. (E) The plot shows F/F and BRAF Δ/Δ endothelial monolayers’ cell index numbers measured before (−007; minimum values) and after 007 treatment (+007, maximum values). Values are means ± SD of three technical replicates. (F) VEGF signaling is perturbed by BRAF ablation. Lysates from F/F and BRAF Δ/Δ pMECs stimulated with 200 ng·mL−1 VEGF were analyzed by immunoblotting using the indicated antibodies. RHOA activation was determined as the proportion of GTP‐loaded protein. (G) Trametinib (10 nm, 1 h prior to VEGF addition) efficiently inhibits MEK/ERK (left panel) but does not phenocopy the decreased VEGF‐stimulated TER of BRAF‐deficient pMECs (right panel). Values represent the maximum VEGF‐induced drop in TER (normalized to PBS controls) and are means ± SD of three technical replicates. DMSO‐treated pMECs were set to −1 to allow comparison. The numbers above the blots show the quantification of the specific experiments shown, while the values underneath the COFILIN and the ERK panels show quantifications of pCOFILIN and pERK levels obtained in three independent experiments, normalized to the phospho/total levels of unstimulated F/F pMECs, set as 1 (*P < 0.045). P values were calculated according to Student's t‐test.
Figure 4
Figure 4
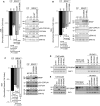
BRAF ablation increases RAF1 interaction with ROKα at VE‐Cadherin‐containing junctions. (A) BRAF ablation promotes the association of VEC with VEGFR2, Catenins, and ROKα. The asteriks (*) marks an unspecific band in the BRAF blot. (B) RAF1 is recovered with ROKα in RHOAGTP pull downs. The ability of ROKα to bind to active RHOA was determined by pull down with GSTRHOAGTPγS from lysates of F/F, BRAF Δ/Δ and RAF1Δ/Δ pMEC stimulated with 200 ng·mL−1 VEGF. RHOA‐binding proteins were detected by immunoblotting. The range of two experiments is shown in the table underneath the blot. (C) BRAF ablation increases the association of RAF1 with ROKα. (D) The association of ROKα with VEC depends on the presence of RAF1. VEC (A and D) or RAF1 (C) immunoprecipitates were prepared from F/F and BRAF Δ/Δ pMEC monolayers. In A, C, and D, the presence of VEC or RAF1 and coimmunoprecipitating proteins were detected by immunoblotting. The numbers above the blots show the quantification of the specific experiments shown, performed by normalizing the amount of coimmunoprecipitated proteins to the amount of immunoprecipitated antigen. The value of the F/F cells was set as 1. ‘bc’ refers to beads control (A, C, D).
Figure 5
Figure 5
RAF1 ablation rescues the molecular and cellular phenotypes of BRAF Δ/Δ pMECs. (A) Increased COFILIN and reduced ERK phosphorylation in BRAF Δ/Δ/RAF1Δ/Δ pMEC monolayers. Lysates were analyzed by immunoblotting using the indicated antibodies. The numbers above the blot show the quantification of the specific experiment shown. (B) RAF1 ablation increases the ratio of F/G‐actin in pMECs. Filamentous and globular actin from F/F (n = 3), BRAF Δ/Δ (n = 3), RAF1Δ/Δ (n = 2), and BRAF Δ/Δ/RAF1Δ/Δ (n = 3) pMECs were separated by ultracentrifugation and analyzed by immunoblotting. (C) RAF1 ablation rescues the permeability defect of BRAF‐deficient pMEC monolayers treated with 200 ng·mL−1 VEGF. TER was measured as described in the legend to Fig. 2. Values represent the maximum VEGF‐induced drop in TER (normalized to PBS controls) and are means ± SD of three technical replicates. F/F values were set to −1 to allow comparison among experiments. P values were calculated according to Student's t‐test. (D) RAF1 ablation normalizes intercellular gap formation induced by 50 ng·mL−1 VEGF in BRAF Δ/Δ pMEC monolayers. Arrows indicate intercellular gaps. The staining shows VE‐cadherin (green), F‐actin (phalloidin, red), and cell nuclei (DAPI, blue). Scale bar represents 20 μm. The bottom panel shows a silhouette representation showing the gaps in black.
Figure 6
Figure 6
BRAF kinase activity, RAS binding, and RAF dimerization are necessary for the regulation of VEGF‐induced permeability. BRAF Δ/Δ pMECs were reconstituted with empty vector (eV) or with the following GFP‐tagged BRAF constructs; wild‐type (B‐WT) in A; kinase dead (B‐K483M in A and B‐D594A in B); RAS‐binding deficient (B‐R188L in B); RAF dimerization mutants (B‐R509H, reduces RAF dimerization; and B‐E586K, promotes RAF dimerization) in C. VEGF‐induced permeability was monitored by TER (left panels). Values represent the maximum VEGF‐induced drop in TER (normalized to PBS controls) and are means ± SD of ≥ 3 technical replicates. F/F values were set to −1 to allow comparison among experiments. COFILIN and ERK phosphorylation (right panels) in the total lysates of the transfected cells were determined by immunoblotting. (D, E) RAF1 immunoprecipitates were prepared from COS7 cells reconstituted with WTBRAF, BRAF‐K483M, BRAF‐D594A, and BRAF‐R188L (D) or WTBRAF, BRAF‐R509H, BRAF‐E586K, and BRAF‐K483M (E). RAF1 and coimmunoprecipitating BRAF were detected by immunoblotting. The panels on the left show the expression levels of the different constructs. The numbers above the blots show the quantification of the specific experiments shown.
Figure 7
Figure 7
Endothelial BRAF ablation reduces vascular permeability and cell extravastation in vivo in a RAF1‐dependent manner. (A) Reduced dermal vascular permeability in response to permeability stimuli in BRAF Δ/Δ, RAF1Δ/Δ, and BRAF/RAF1Δ/Δ animals. Quantification of dermal vascular permeability after intradermal injection of VEGF (400 ng), histamine (1 μg), thrombin (10 U), or PBS into F/F and BRAF Δ/Δ mice. Evans Blue dye leakage is plotted as stimulus/PBS ratio (mean ± SEM). (B, C) BRAF Δ/Δ mice support the growth of Lewis lung carcinoma (LLC‐1, B) and B16F10 melanoma (C) allografts. Tumor volumes were assessed at the indicated days after subcutaneous implantation of 106 cells into F/F or BRAF Δ/Δ animals. Tumor‐bearing mice were sacrificed 14 (LLC1) or 13 (B16F10) days after injection of tumor cells. (D) Reduced extravasation of CMRA‐labeled B16F10 melanoma cells following tail vein injections in BRAF Δ/Δ mice. The number of extravasated B16F10 cells in the lungs of F/F and BRAF Δ/Δ animals was quantified 48 h after injection. The data represent average values ± SEM of the indicated biological replicates. (E) Reduced transendothelial migration of B16F10 melanoma cells through BRAF Δ/Δ pMEC, but not BRAF/RAF1Δ/Δ monolayers. CMRA‐labeled B16F10 melanoma cells were allowed to migrate through confluent pMEC monolayers on fibronectin‐coated transwell membranes. Transmigrated cells were counted after a 6‐h incubation with the indicated stimuli. The plots represent the mean (± SEM) of four independent experiments, each performed in triplicates. Values are normalized to PBS controls (shown as 1). A, D, and E P values were calculated according to Student's t‐test.
Figure 8
Figure 8
A BRAF/RAFRAF1/ROKα rheostat regulates paracellular permeability in endothelial monolayers. Working model (see text for detail). In endothelial cells, RAP1‐dependent localization of the RAF1/ROKα complex to VE‐Cadherin‐containing AJs and localized RHOA signaling favor CAB formation and junctional stability. BRAF/RAF1 dimerization antagonizes this, decreasing RHOA/ROKα signaling at the AJs. This allows the disruption of CAB and promotes the formation of RSFs, AJ remodeling, and the formation of intercellular gaps when permeabilization is induced (RHOA* active RHOA; RAP1* active RAP1). In the absence of BRAF, more RAF1/ROKα complexes colocalize with VEC, reinforcing CAB formation and cell–cell junctions, and resulting in decreased vessel permeability.

Comment in

Similar articles

Cited by

References

    1. Sukriti S, Tauseef M, Yazbeck P & Mehta D (2014) Mechanisms regulating endothelial permeability. Pulm Circ 4, 535–551. - PMC - PubMed
    1. Trani M & Dejana E (2015) New insights in the control of vascular permeability: vascular endothelial‐cadherin and other players. Curr Opin Hematol 22, 267–272. - PubMed
    1. Kreuger J & Phillipson M (2016) Targeting vascular and leukocyte communication in angiogenesis, inflammation and fibrosis. Nat Rev Drug Discov 15, 125–142. - PubMed
    1. Nguyen DX, Bos PD & Massague J (2009) Metastasis: from dissemination to organ‐specific colonization. Nat Rev Cancer 9, 274–284. - PubMed
    1. Pannekoek WJ, Post A & Bos JL (2014) Rap1 signaling in endothelial barrier control. Cell Adh Migr 8, 100–107. - PMC - PubMed

Publication types

MeSH terms