

EGFLAM correlates with cell proliferation, migration, invasion and poor prognosis in glioblastoma
- PMID: 30829611
- PMCID: PMC6484271
- DOI: 10.3233/CBM-181740
EGFLAM correlates with cell proliferation, migration, invasion and poor prognosis in glioblastoma
Abstract
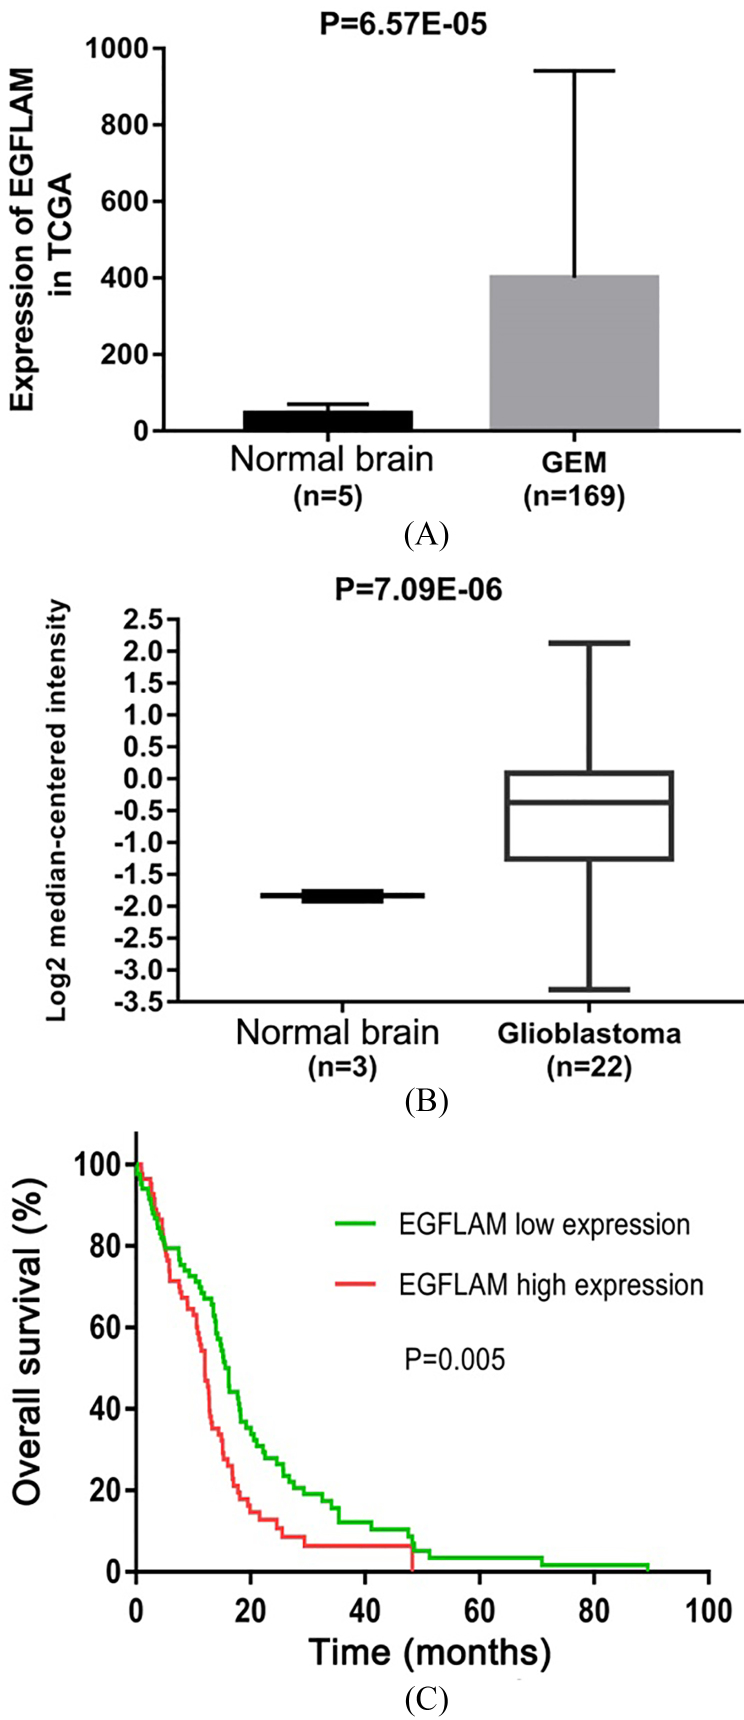
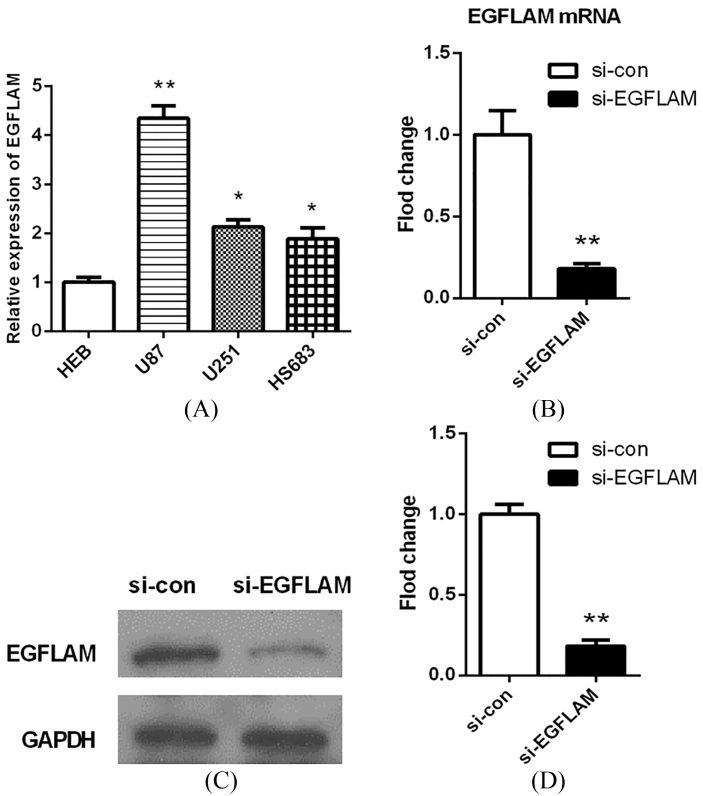
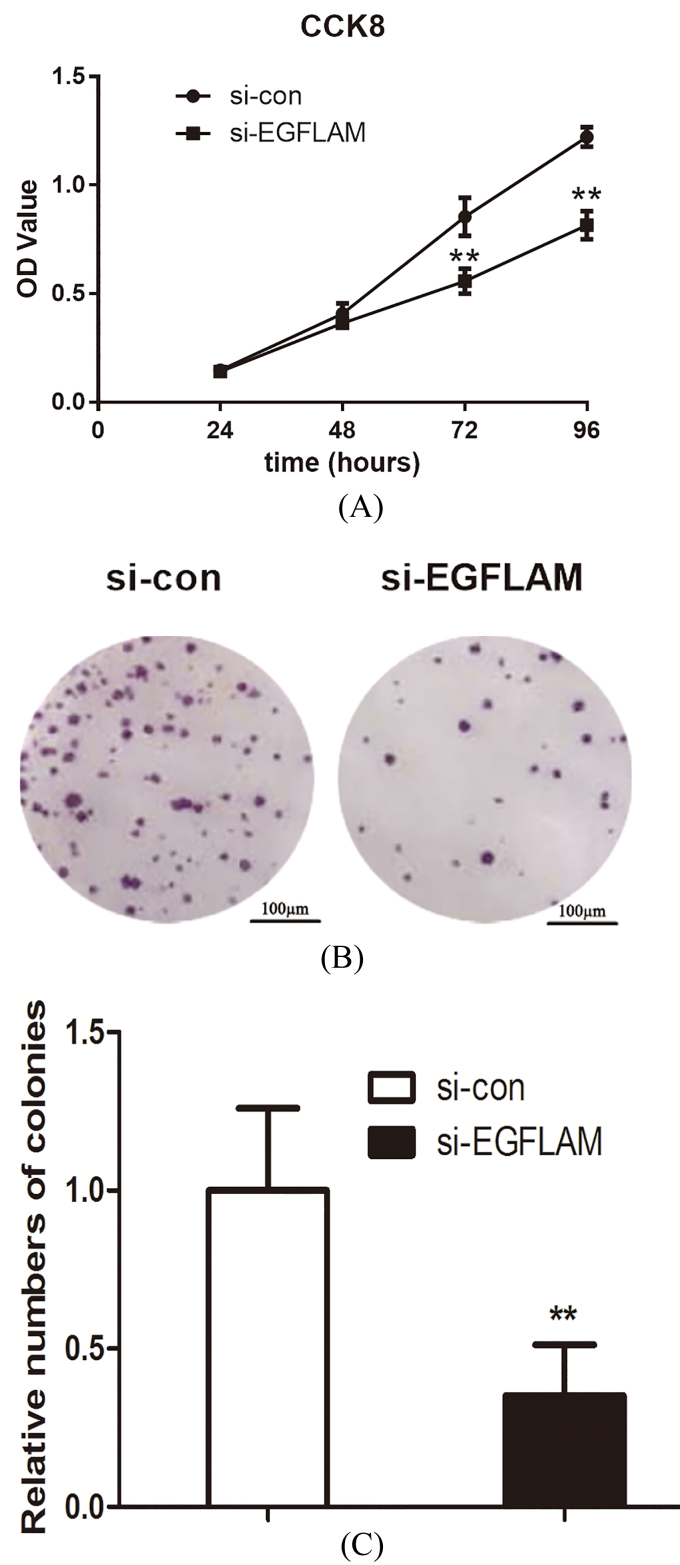
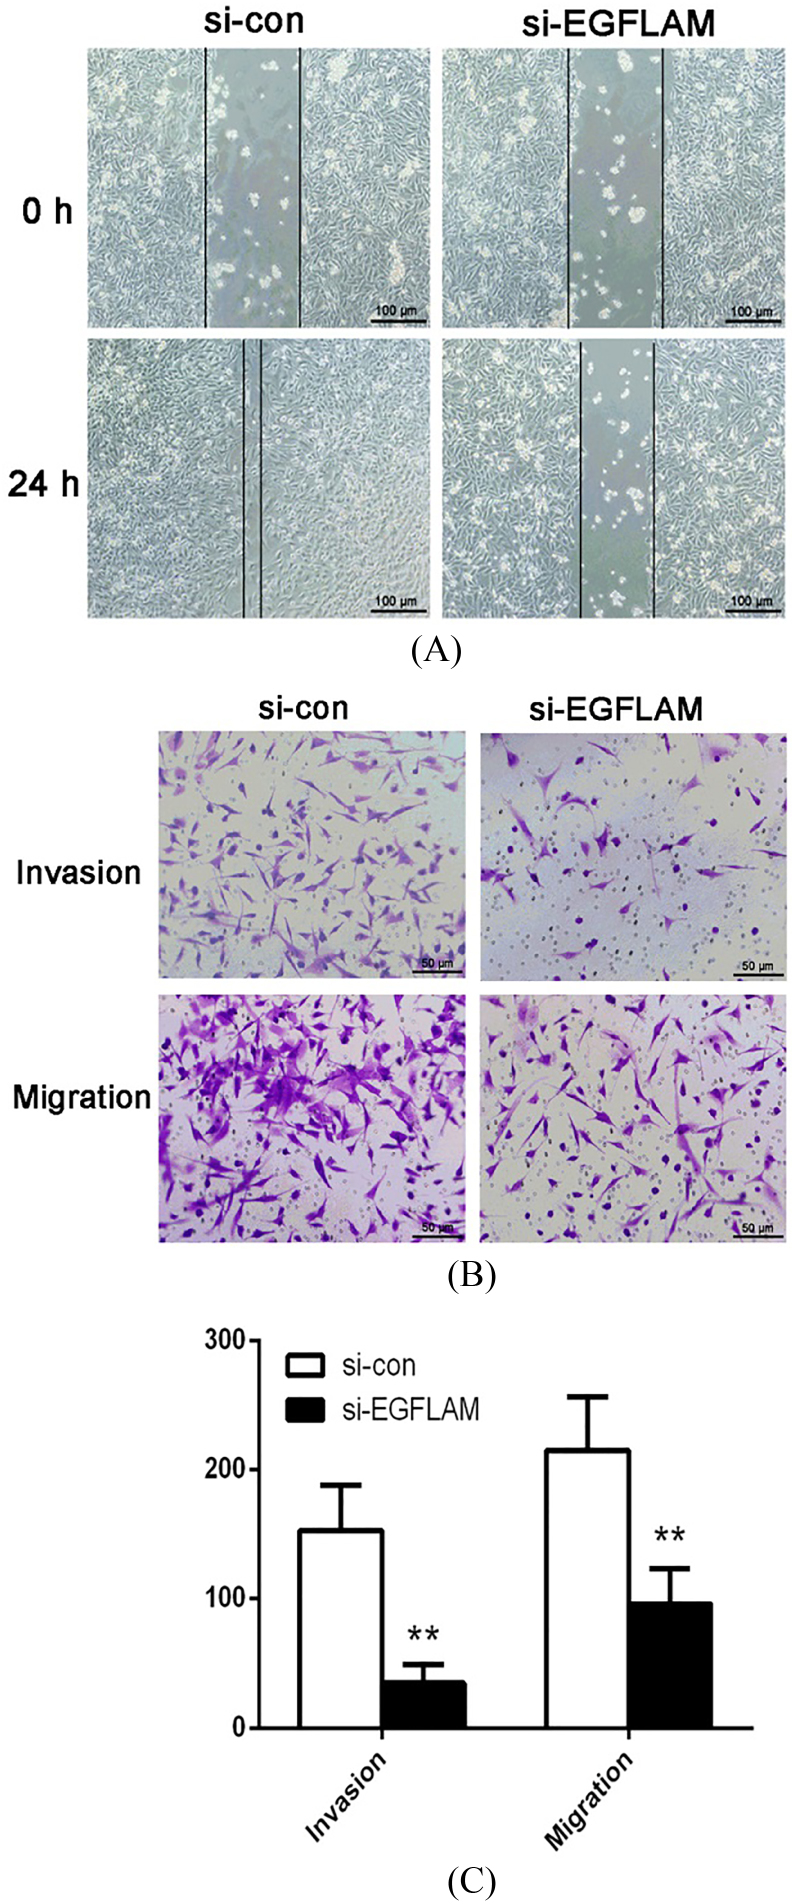
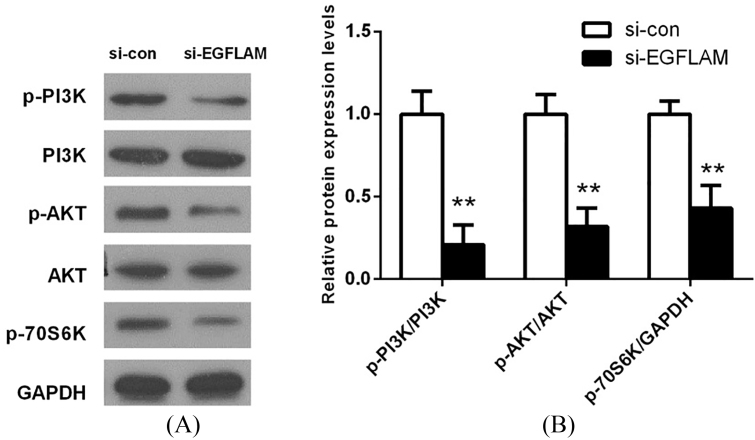
EGFLAM as a novel gene biomarker has been reported in some cancers but not glioblastoma (GBM) yet. To clarify the functional role of EGFLAM in GBM, we performed this study. Firstly, based on TCGA and Oncomine database, EGFLAM expression and clinical significance in GBM patients was analyzed. Furthermore, the biological effect of EGFLAM in GBM cells was determined by qRT-PCR, CCK-8 assay, colony formation assay, wound healing assay, transwell assays and western blot analysis. The databases analysis showed that EGFLAM expression was at higher levels in GBM patients with poor prognosis. The results indicated that EGFLAM silence inhibited the proliferation, migration and invasion of U87 cells, which was regulated through repression of PI3K/AKT pathway. Accordingly, the data from our work shed some light on EGFLAM might be a prognostic biomarker and therapeutic target for GBM.
Keywords: AKT; EGFLAM; PI3K; glioblastoma; prognosis; proliferation.
Figures
Similar articles
-
Overexpression of HOXC10 promotes glioblastoma cell progression to a poor prognosis via the PI3K/AKT signalling pathway.J Drug Target. 2019 Jan;27(1):60-66. doi: 10.1080/1061186X.2018.1473408. Epub 2018 Aug 6. J Drug Target. 2019. PMID: 29768063
-
EGFLAM exhibits oncogenic activity and shows promise as a prognostic biomarker and therapeutic target in glioblastoma.Int Immunopharmacol. 2024 Sep 10;138:112625. doi: 10.1016/j.intimp.2024.112625. Epub 2024 Jul 11. Int Immunopharmacol. 2024. PMID: 38996666
-
Up-regulated circular RNA hsa_circ_0067934 contributes to glioblastoma progression through activating PI3K-AKT pathway.Eur Rev Med Pharmacol Sci. 2019 Apr;23(8):3447-3454. doi: 10.26355/eurrev_201904_17709. Eur Rev Med Pharmacol Sci. 2019. PMID: 31081099
-
Recent advances of the regulation roles of MicroRNA in glioblastoma.Int J Clin Oncol. 2020 Jul;25(7):1215-1222. doi: 10.1007/s10147-020-01685-y. Epub 2020 Apr 29. Int J Clin Oncol. 2020. PMID: 32347433 Review.
-
Potential Diagnostic and Clinical Significance of Selected Genetic Alterations in Glioblastoma.Int J Mol Sci. 2024 Apr 18;25(8):4438. doi: 10.3390/ijms25084438. Int J Mol Sci. 2024. PMID: 38674026 Free PMC article. Review.
Cited by
-
Comparative genomic landscape of lower-grade glioma and glioblastoma.PLoS One. 2024 Aug 29;19(8):e0309536. doi: 10.1371/journal.pone.0309536. eCollection 2024. PLoS One. 2024. PMID: 39208202 Free PMC article.
-
Integrated multi-omics analysis and machine learning identify hub genes and potential mechanisms of resistance to immunotherapy in gastric cancer.Aging (Albany NY). 2024 Apr 22;16(8):7331-7356. doi: 10.18632/aging.205760. Epub 2024 Apr 22. Aging (Albany NY). 2024. PMID: 38656888 Free PMC article.
-
Tumor antigens and immune subtypes of glioblastoma: the fundamentals of mRNA vaccine and individualized immunotherapy development.J Big Data. 2022;9(1):92. doi: 10.1186/s40537-022-00643-x. Epub 2022 Jul 14. J Big Data. 2022. PMID: 35855914 Free PMC article.
-
Comprehensive multi-omics pan-cancer analysis revealed EGFLAM as a potential prognostic and immune infiltration-associated biomarker.BMC Cancer. 2025 Jul 1;25(1):1109. doi: 10.1186/s12885-025-14519-9. BMC Cancer. 2025. PMID: 40597847 Free PMC article.
-
Overall survival prediction of gastric cancer using the gene signature of CT-detected extramural venous invasion combined with M2 macrophages infiltration.J Transl Med. 2024 Sep 9;22(1):829. doi: 10.1186/s12967-024-05628-3. J Transl Med. 2024. PMID: 39252063 Free PMC article.
References
-
- Eder K. and Kalman B., Molecular heterogeneity of glioblastoma and its clinical relevance, Pathol Oncol Res 20 (2014), 777–87. - PubMed
MeSH terms
Substances
LinkOut - more resources
Full Text Sources
Medical
Molecular Biology Databases
