

Hands-on Tutorial on a Modeling Framework for Projections of Climate Change Impacts on Health
- PMID: 30829832
- PMCID: PMC6533172
- DOI: 10.1097/EDE.0000000000000982
Hands-on Tutorial on a Modeling Framework for Projections of Climate Change Impacts on Health
Abstract
Reliable estimates of future health impacts due to climate change are needed to inform and contribute to the design of efficient adaptation and mitigation strategies. However, projecting health burdens associated to specific environmental stressors is a challenging task because of the complex risk patterns and inherent uncertainty of future climate scenarios. These assessments involve multidisciplinary knowledge, requiring expertise in epidemiology, statistics, and climate science, among other subjects. Here, we present a methodologic framework to estimate future health impacts under climate change scenarios based on a defined set of assumptions and advanced statistical techniques developed in time-series analysis in environmental epidemiology. The proposed methodology is illustrated through a step-by-step hands-on tutorial structured in well-defined sections that cover the main methodological steps and essential elements. Each section provides a thorough description of each step, along with a discussion on available analytical options and the rationale on the choices made in the proposed framework. The illustration is complemented with a practical example of study using real-world data and a series of R scripts included as Supplementary Digital Content; http://links.lww.com/EDE/B504, which facilitates its replication and extension on other environmental stressors, outcomes, study settings, and projection scenarios. Users should critically assess the potential modeling alternatives and modify the framework and R code to adapt them to their research on health impact projections.
Conflict of interest statement
The authors report no conflicts of interest.
Figures
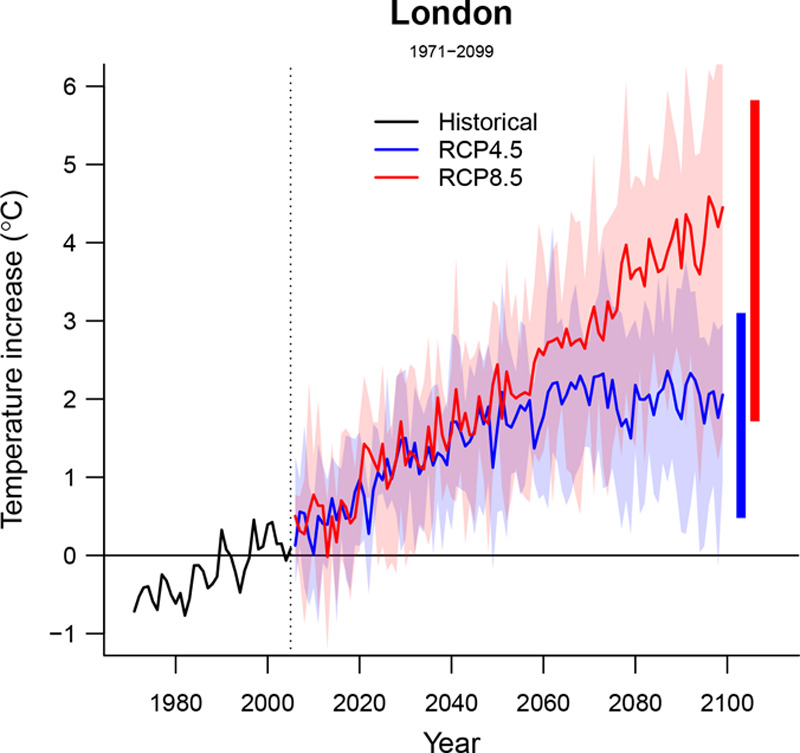
 , and the observed temperature series
  . GCM indicates general circulation model.
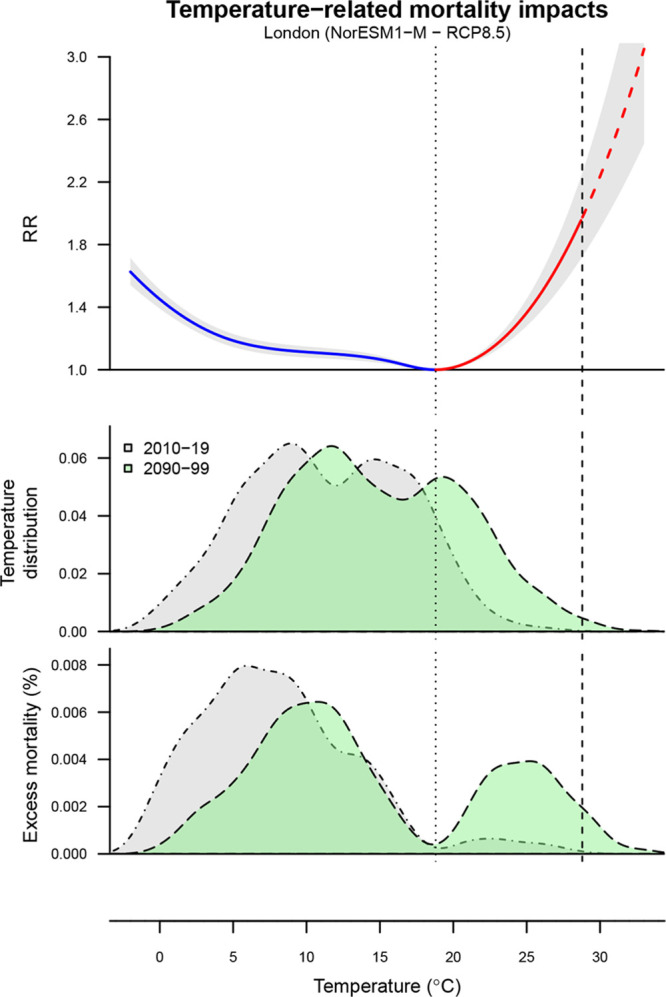
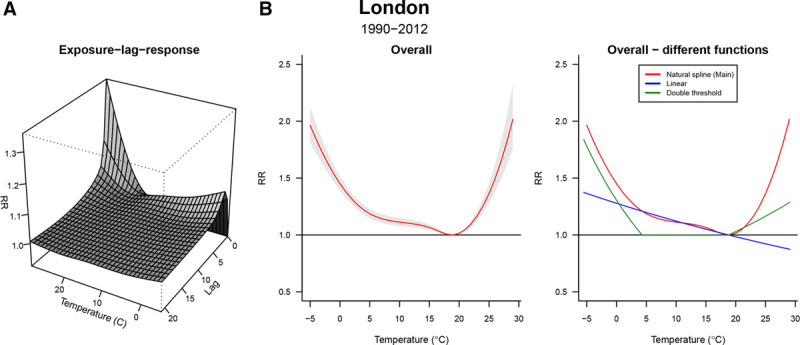
 ) used as reference, which defines the two portions of the curve related to cold and heat (blue and red, respectively). The dashed part of the curve represents the extrapolation beyond the maximum temperature observed in 2010–2019 (dashed vertical line). Mid panel: distribution of
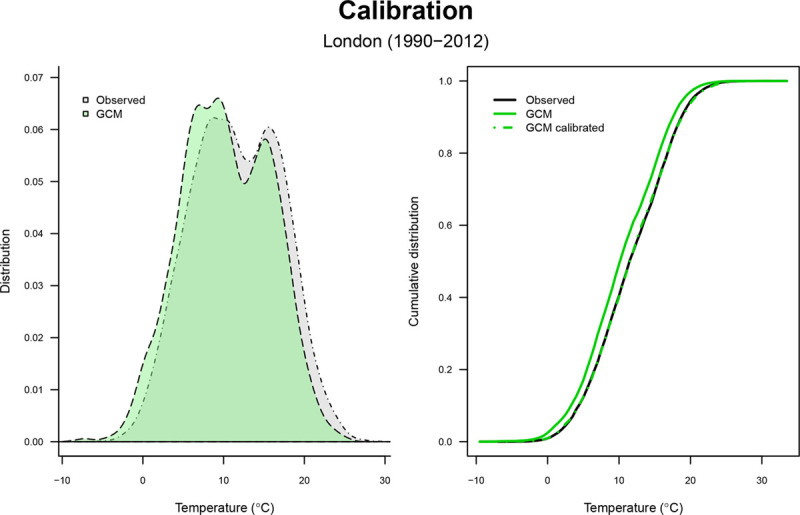
  for the current (2010–2019, gray area) and at the end of the century (2090–2099, green area), projected using a specific climate model (NorESM1−M) and scenario (RCP8.5). Bottom panel: the related distribution of excess mortality, expressed as the fraction of additional deaths (%) attributed to nonoptimal temperature compared with
  .
.
References
Publication types
MeSH terms
Grants and funding
LinkOut - more resources
Full Text Sources
Medical
