

New methods to identify high peak density artifacts in Fourier transform mass spectra and to mitigate their effects on high-throughput metabolomic data analysis
- PMID: 30830442
- PMCID: PMC6153687
- DOI: 10.1007/s11306-018-1426-9
New methods to identify high peak density artifacts in Fourier transform mass spectra and to mitigate their effects on high-throughput metabolomic data analysis
Abstract
Introduction: Direct injection Fourier-transform mass spectrometry (FT-MS) allows for the high-throughput and high-resolution detection of thousands of metabolite-associated isotopologues. However, spectral artifacts can generate large numbers of spectral features (peaks) that do not correspond to known compounds. Misassignment of these artifactual features creates interpretive errors and limits our ability to discern the role of representative features within living systems.
Objectives: Our goal is to develop rigorous methods that identify and handle spectral artifacts within the context of high-throughput FT-MS-based metabolomics studies.
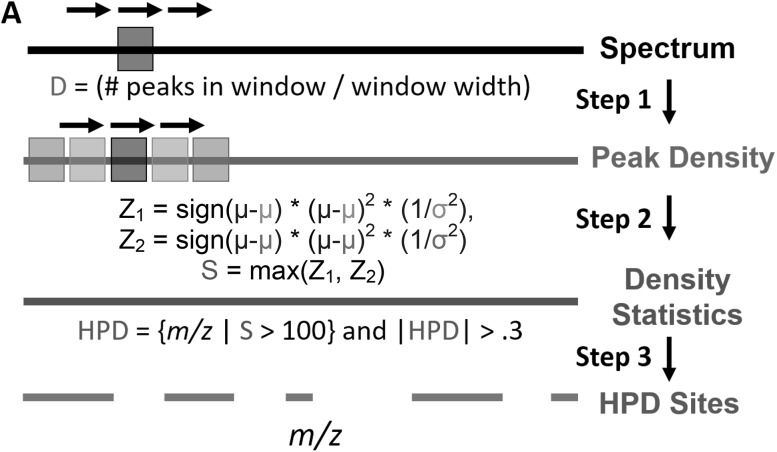
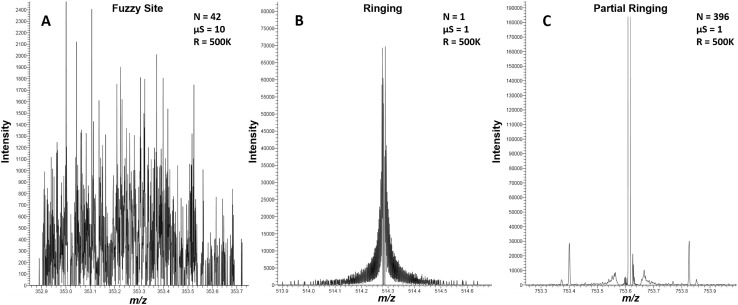
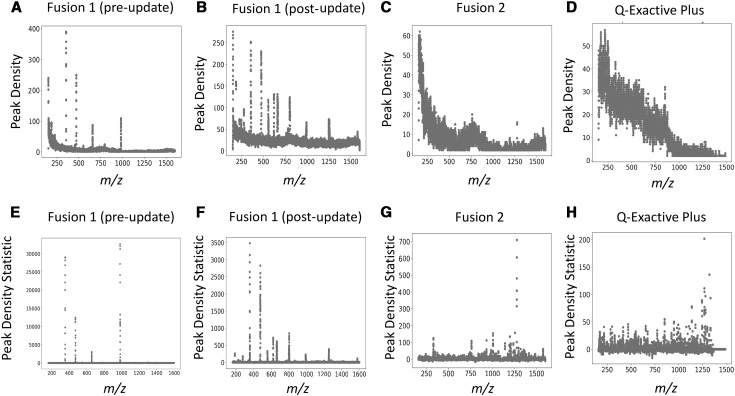
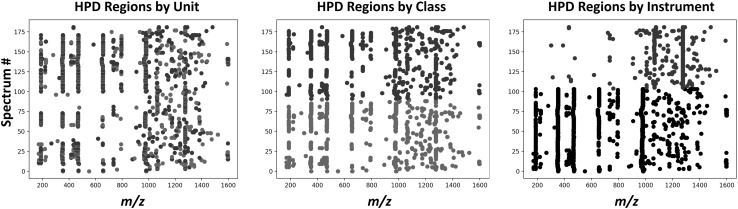
Results: We observed three types of artifacts unique to FT-MS that we named high peak density (HPD) sites: fuzzy sites, ringing and partial ringing. While ringing artifacts are well-known, fuzzy sites and partial ringing have not been previously well-characterized in the literature. We developed new computational methods based on comparisons of peak density within a spectrum to identify regions of spectra with fuzzy sites. We used these methods to identify and eliminate fuzzy site artifacts in an example dataset of paired cancer and non-cancer lung tissue samples and evaluated the impact of these artifacts on classification accuracy and robustness.
Conclusion: Our methods robustly identified consistent fuzzy site artifacts in our FT-MS metabolomics spectral data. Without artifact identification and removal, 91.4% classification accuracy was achieved on an example lung cancer dataset; however, these classifiers rely heavily on artifactual features present in fuzzy sites. Proper removal of fuzzy site artifacts produces a more robust classifier based on non-artifactual features, with slightly improved accuracy of 92.4% in our example analysis.
Keywords: Artifact; Data analysis; Fourier transform; Mass spectrometry; Metabolomics.
Conflict of interest statement
Conflict of interest
The authors declare that they have no conflict of interest.
Ethical approval
The base study providing the de-identified data analyzed was approved by IRB protocol (IRB 14-0288-F6A) at the University of Kentucky and IRB protocol (#523.05) at the University of Louisville.
Informed consent
Written consent was obtained for the collection of human tissue samples under an IRB approved protocol (IRB 14-0288-F6A) at the University of Kentucky and IRB protocol (#523.05) at the University of Louisville.
Figures


References
-
- Breiman L. Random forests. Machine Learning. 2001;45:5–32. doi: 10.1023/A:1010933404324. - DOI
Publication types
MeSH terms
Grants and funding
- UL1TR001998-01/NH/NIH HHS/United States
- R03 CA211835/CA/NCI NIH HHS/United States
- R01 ES022191/ES/NIEHS NIH HHS/United States
- P20 GM121327/GM/NIGMS NIH HHS/United States
- 1R01ES022191-01/NH/NIH HHS/United States
- 1U24DK097215-01A1/NH/NIH HHS/United States
- AHA16GRNT31310020/American Heart Association/International
- 1R03CA211835-01/NH/NIH HHS/United States
- P01 CA163223/CA/NCI NIH HHS/United States
- P30 CA177558/CA/NCI NIH HHS/United States
- UL1 TR001998/TR/NCATS NIH HHS/United States
- U24 DK097215/DK/NIDDK NIH HHS/United States
- 1252893/National Science Foundation/International
LinkOut - more resources
Full Text Sources
Other Literature Sources
Medical