Review
. 2019 Mar 4;10(1):28.
doi: 10.1186/s13244-019-0703-0.

How clinical imaging can assess cancer biology

Affiliations
Review

How clinical imaging can assess cancer biology

Roberto García-Figueiras et al. Insights Imaging. .

Abstract

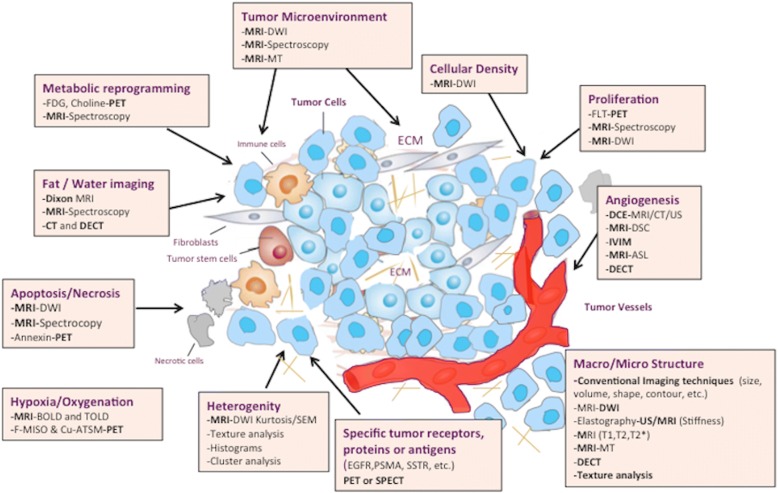
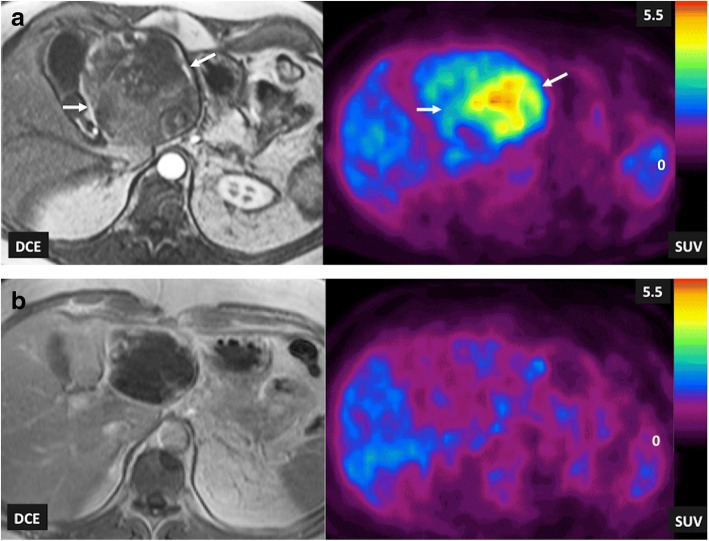
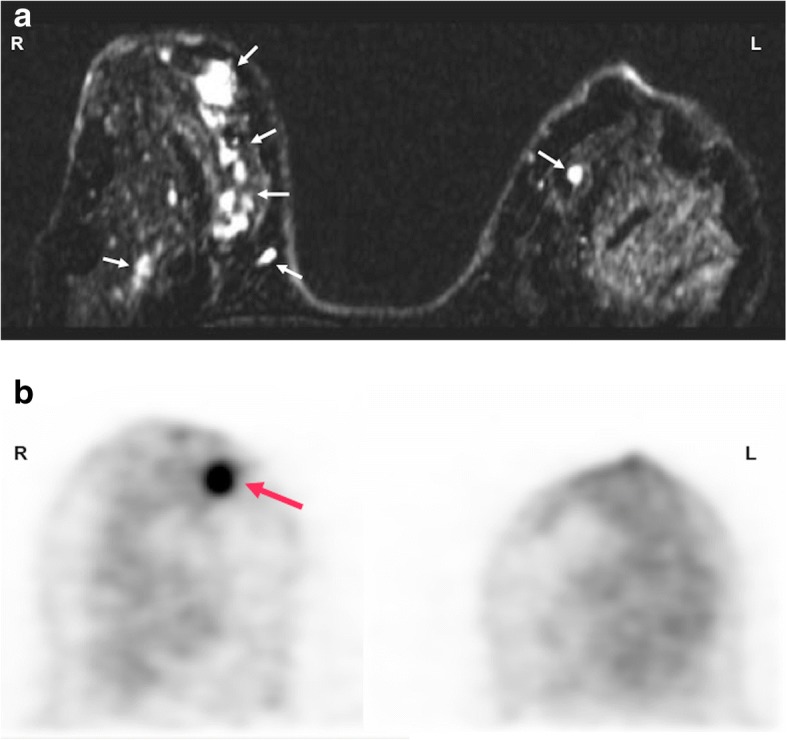
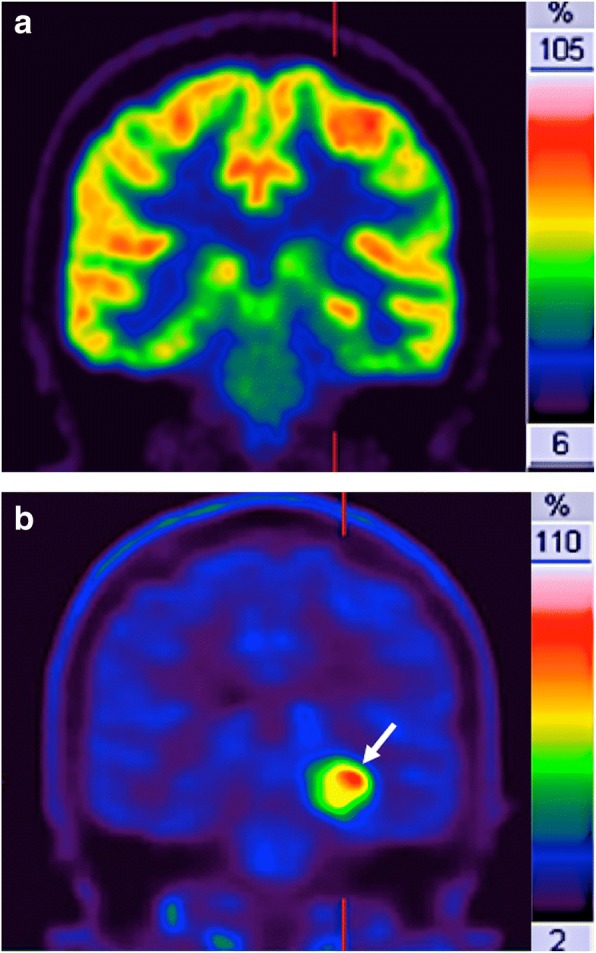
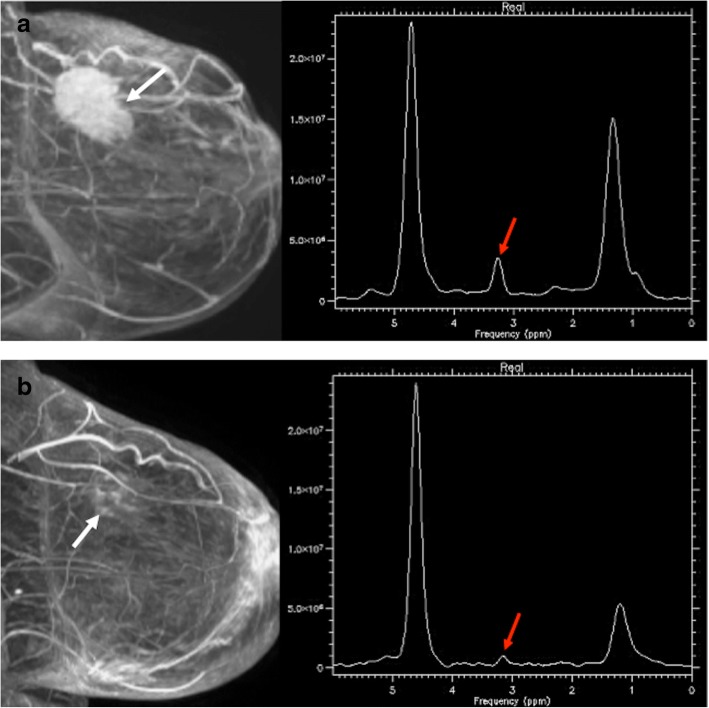
Human cancers represent complex structures, which display substantial inter- and intratumor heterogeneity in their genetic expression and phenotypic features. However, cancers usually exhibit characteristic structural, physiologic, and molecular features and display specific biological capabilities named hallmarks. Many of these tumor traits are imageable through different imaging techniques. Imaging is able to spatially map key cancer features and tumor heterogeneity improving tumor diagnosis, characterization, and management. This paper aims to summarize the current and emerging applications of imaging in tumor biology assessment.

Keywords: Multimodal imaging; Neoplasms; Phenotype.


Conflict of interest statement

Competing interests

The authors declare that they have no competing interests.

Publisher’s Note

Springer Nature remains neutral with regard to jurisdictional claims in published maps and institutional affiliations.

Figures

Fig. 1
Fig. 1
Main imaging techniques in the evaluation of tumor biology and microenvinroment
Fig. 2
Fig. 2
Rectal gastrointestinal stromal tumor (GIST) (white asterisk) in a 68-year-old man. a Optical colonoscopic image showed a rectal tumor (arrow). b Endorectal ultrasonographic (US) image (right) with strain elastogram (left) showed that tumor (asterisk) appeared harder (more blue) than the reference tissue on the elastogram. c A cut surface of the surgical specimen revealed a well-defined homogeneous aspect of the submucosal mass (GIST)
Fig. 3
Fig. 3
A 69-year-old man with Gleason 4 + 3 prostate cancer (white arrows). Diffusion signal evaluated using different models of analysis: mono-exponential (a) intravoxel incoherent exponential model (IVIM) (b), diffusion kurtosis imaging (DKI) (c), and diffusion tensor imaging (DTI) (d). DWI can offer multiple parameters depending on the model of analysis, including ADC, perfusion fraction (f), or apparent kurtosis (Kapp) with a different biological meaning. Biological and physiological correlation of parameters obtained from analysis is not entirely clear and their clinical value may depend on tumor type
Fig. 4
Fig. 4
Rectal cancer in a 65-year-old woman. a Axial T2-weighted image demonstrated a rectal mass deeply extending to the mesorectal fat (white arrow). b Perfusion fraction (f), apparent kurtosis diffusion (Kapp), and the curve of signal intensity decay in diffusion pretherapy. Note that this curve showed a marked attenuation of signal intensity at low b values (red arrow) due to the influence of tumor perfusion on diffusion. c Following therapy, there are reduction of both f and Kapp and dissapearance of the fast attenuation of the signal intensity at low b values, related to tumor response with reducer perfusion on IVIM model
Fig. 5
Fig. 5
A 68-year-old man with lung adenocarcinoma. a The whole-body diffusion weighted MR image (b = 900 s/mm2) depicted a metastatic deposit in the sacrum (white arrow). b Coronal reformatted T1W images obtained using the Dixon technique water only (WATER) (left), fat only (FAT) (middle), and fat-fraction in colored scale (right) evidenced not fat content and increased water in the metastatic lesion (white arrow)
Fig. 6
Fig. 6
A 52-year-old woman with metastatic breast cancer treated with chemotherapy (a). Whole body diffusion-weighted inverted gray-scale maximun intensity projection (MIP) of b = 900 s/mm2 images superimposing the ADC values associated with each voxel in color scale before (left) and after one cycle of therapy (right). Red colored voxels represent untreated disease or those with no-detectable response. Thus, yellow voxels represent regions “likely” to be responding. Green colored voxels have ADC values ≥ 1500 μm2/s representing voxels that are “highly likely” to be responding with tumor cell kill. Tumor evaluation showed a great change in ADC values (predominantly green voxels with ADC values ≥ 1500 μm2/s) indicating tumor necrosis. b A detailed ADC analysis of histogram metrics evidenced a reduced tumor volume as well as improvement in several histogram metrics (mean ADC, kurtosis, etc.) that have changed significantly during treatment due to extensive necrosis (compare to Fig. 7)
Fig. 7
Fig. 7
A 63-year-old woman with metastatic breast cancer treated with an anti-HER2 agent and hormonotherapy. a Whole body diffusion-weighted inverted gray-scale maximun intensity projection (MIP) of b = 900 s/mm2 images superimposing the ADC values associated with each voxel in color scale before (left) and after one cycle of therapy (right). Red colored voxels represent untreated disease or those with no-detectable response. The yellow voxels lie between the 95th centile value of the pre-treatment histogram and 1500 μm2/s. Thus, yellow voxels represent regions “likely” to be responding. Green colored voxels have ADC values ≥ 1500 μm2/s representing voxels that are “highly likely” to be responding with tumor cell kill. In this case, response assessment demonstrated a discrete change in ADC values (predominantly yellow voxels). b The detailed ADC analysis of histogram metrics evidenced an increased tumor volume with moderate changes in several histogram metrics (mean ADC, kurtosis, etc.) suggesting an apoptotic effect of targeted therapies (compare to Fig. 6)
Fig. 8
Fig. 8
An 8-year-old patient with high-grade tectal plate glioma (white arrow). a Post-contrast T1-weighted (+C) and magnetization transfer (MT) images were obtained before (top row) and after (bottom row) chemoradiotherapy; and (b) the corresponding MT ratio histograms of lesion are as shown. The magnetization transfer acquisition comprised a set of four geometry-matched 3D-GRE scans: two flip angles (4 and 24°), with/without MT pulse (1.5 kHz offset) on a 1.5 T MR system. Note the reduction in the MT ratio (histogram in b) associated with response to treatment, accompanied by slight increase in size and enhancement of the tumor (a). [Images courtesy of Dr. Neil P. Jerome, Norwegian University of Science and Technology]
Fig. 9
Fig. 9
Desmoplastic reaction in a 51-year-old patient with pancreatic adenocarcinoma. a Imaging evaluation including an axial fat-suppresed contrast-enhanced T1-weighted dynamic MR image (DCE-MRI, top, left), a time/signal intensity curve analysis (botton, left), a parametric map corresponding to the initial area under the curve (iAUC), and a fusion of axial T2-weighted image fused with a superimposed color-coded map derived from high b value DWI (FUSION) clearly showed a hypoperfunded mass with a pattern of progressive enhancement (curve type 1, red arrows) and no restricted diffusion in the tumor in the fusion image. These findings were secondary to the predominance of fibrosis within the lesion. b Histological analysis (H&E, × 20) confirmed an abundant tumor desmoplastic reaction (asterisks) with clusters of tumor cells (arrow)
Fig. 10
Fig. 10
BOLD sequence and tumor oxygenation. a Axial T2-weighted image in a 63-year-old man evidenced a poor defined hypointense mass in the anterior part of the transitional gland corresponding to prostate cancer (white arrow). b BOLD exam acquired in the axial plane at baseline and after evidenced that in baseline conditions the tumor (white arrow) showed low signal in the T2* map (high R2* values), which is related to a lower oxygenation compared to the rest of the prostate. BOLD images after 95% oxygen breathing at 5, 10, and 15 m evidenced that the signal increased witihin the tumor (red arrow in the acquisition at 15 min) with an inverted ∆R2* time-intensity curve (red arrowhead). These features evidence the presence of radiosensitive areas within the tumor with increasing pass of oxygen from blood to the tissue. The concentration of deoxyHb increases with rising oxygen consumption, leading to a decreasing T2* relaxation time of the surrounding tissue
Fig. 11
Fig. 11
Theranostic in oncology with PSMA. 177Lu-PSMA radioligand therapy in a 67-year-old man with metastatic castration-resistant prostate cancer. a Pretherapy. PET image evidenced a difuse metastatic involvement. PSA value 50 ng/ml. b 4 months following the treatment with 177Lu-PSMA radioligand therapy (8000 MBq), PET showed a complete metabolic response. PSA value 0 ng/ml
Fig. 12
Fig. 12
An axial 18F-Choline PET/CT image depicted a mass in the prostate bed (white arrow) in a 72-year-old man with a biochemical relapse of a prostate cancer following radical prostatectomy
Fig. 13
Fig. 13
Liver metastasis of a gastrointestinal stromal tumor (GIST) in a 68-year-old man. T1-weighted contrast-enhanced MRI (DCE) images and FDG-PET SUV parametric maps (SUV) acquired pretherapy (a) and following the administration of imatinib (b) and pretherapy (a), imaging findings evidenced a metabolic active tumor with areas of heterogenic enhancement (white arrows). Post-therapy (b), the tumor presented almost a total absence of enhancement and a complete metabolic response on PET imaging
Fig. 14
Fig. 14
A 48-year-old woman with breast cancer. a Axial contrast-enhanced T1-weighted MR image of breasts performed during last week of menstrual cycle showed bilateral multiple nodular areas of enhancement in both mammary glands (white and red arrows). b A dedicated FDG-PET exam only depicted a nodular mass (red arrow) with increased FDG uptake in the right breast, corresponding to a invasive ductal carcinoma
Fig. 15
Fig. 15
Relapsing brain astrocitoma (white arrow) in a 54 year-old-man. a 18F-FDG and b 11C-methionine coronal-reformatted images. Normal uptake of FDG in brain impeded an adequate tumor detection and delineation. However, 11C-methionine PET clearly depicted the tumor (white arrow)
Fig. 16
Fig. 16
A 56-year-old woman with an invasive ductal carcinoma of the breast. Pretherapy (a) the sagittal reformatted maximum intensity projection (MIP) image from DCE-MRI (left) demonstrating a 5-cm enhancing mass (white arrow). MR spectrum (right) depicts a marked choline peak (red arrow). Images obtained after chemotherapy and anti-HER2 therapy with trastuzumab (b) evidenced a residual lesion. Sagittal reformatted maximum intensity projection (MIP) image from DCE-MRI demonstrated discrete dots of enhancement (white arrow), while MR spectrum showed a decreased choline peak (red arrow). Tumorectomy revealed residual fibrosis without tumor cells
Fig. 17
Fig. 17
A 71-year-old man with a Gleason 7 prostate cancer (PSA 6.05). A suspicious area with low ADC values was depicted in the left peripheral area (white arrow). The hyperpolarized 13C spectra and the time course for the dynamic conversion hyperpolarized [1-13C] pyruvate to lactate following the injection of hyperpolarized pyruvate were revaluated (top, right). Note the change of the MR spectra with the pyruvate quickly reached a maximum at t: 57.3 s (bottom, middle) before being converted to lactate. Compared with the spectrum at t: 18.6 s (top, middle). [Images courtesy of Kayvan R Keshari, PhD. Laboratory Head. Memorial Sloan Kettering Cancer Center]
Fig. 18
Fig. 18
Perfusion CT exam in a 42-year-old man with a metastatic renal carcinoma. Blood flow (BF), blood volume (BV), and permeability (PS) parametric maps evidenced the heterogeneity of the functional status of the vasculature within the tumor with several combinations of the obtained parameters (top-left) and clear differences between the time density curves coresponding to the peripheral areas of viable tumor with increased BV, BF, and PS (a) with a wash-in/wash-out pattern and the central necrotic necrotic areas (a)
Fig. 19
Fig. 19
Brain perfusion in a 55-year-old woman with a meningioma. a An axial fluid attenuation inversion recovery (FLAIR) image of the brain demonstrated a hyperintense extra-axial insular lesion (white arrow). Both (b) dynamic susceptibility contrast (DSC)-MRI and (c) arterial spin labelling (ASL) parametric maps demonstrated and increased perfusion in the mass. Comparison to normal brain parenchyma evdenced a higher decrease in MR signal intensity curves during the first-pass of the contrast bolus (b, blue curve)
Fig. 20
Fig. 20
A 70-year-old woman with high-grade serous ovarian cancer who underwent FDG-PET/CT (standardized uptake value map of the fluorodeoxyglucose uptake [FDG SUV] is showed) and MRI, which included T2, diffusion (DWI), and dynamic contrast-enhanced (DCE) sequences (images on the left) showing a primary ovarian mass as well as multiple peritoneal/serosal implants including in the cul-de-sac. A composite “habitat” map of the implant in the cul-de-sac was performed (right) containing three clusters derived from PET and MRI data. Tissue sampling from each cluster represented by a different color on the habitat map demonstrated genomic heterogeneity underpinning the phenotypic heterogeneity observed on imaging
Fig. 21
Fig. 21
Colorectal cancer liver metastasis in a 56-year-old man. FDG-PET (left) and b500 diffusion-weighted (middle) images demonstrated the presence of a mismatch between the obtained parameters. Note that the size of the FDG abnormality is smaller than the diffusion one (black arrow) (right). Tumor biology may explain this feature. Higher FDG uptake occurs at the edge of the necrotic cavity (white arrow) which is of relative low SI on b500 image. The edge of the necrotic cavity usually represents an area of relative tumor hypoxia, which may promote a high metabolic activity (vascular metabolic-mismatch). On its part, the periphery of the mass generally presents good perfusion and it is the most cellular area of the tumor, explaining the restricted diffusion at this level
Fig. 22
Fig. 22
Whole-body DWI evaluation in a 72-year-old man with metastatic prostate cancer treated with (docetaxel + prednisone). A comparison between images pre (left) and posttherapy (right) demonstrated that tumor volume decreased (1280 cm3 → 640 cm3) and mean ADC moved from 0.7 to 1.61 confirmed an increasing % of voxels at higher ADC values after therapy consistent with reductions in cellularity due to tumor necrosis. However, tumor response was heterogeneous in this patient and there were some anatomical areas that presented a limited tumor response (black dotted circle on lumbar spine and black arrows)

References

    1. Hanahan D, Weinberg RA. Hallmarks of cancer: the next generation. Cell. 2011;144:646–674. - PubMed
    1. O'Neill AC, Alessandrino F, Tirumani SH, Ramaiya NH. Hallmarks of Cancer in the Reading Room: A Guide for Radiologists. AJR Am J Roentgenol. 2018;11:1–15. - PubMed
    1. Sala E, Mema E, Himoto Y, et al. Unravelling tumor heterogeneity using next-generation imaging: radiomics, radiogenomics, and habitat imaging. Clin Radiol. 2017;72:3–10. - PMC - PubMed
    1. Hricak H. 2016 New Horizons Lecture: Beyond Imaging-Radiology of Tomorrow. Radiology. 2018;286:764–775. - PubMed
    1. Winfield JM, Payne GS, deSouza NM. Functional MRI and CT biomarkers in oncology. Eur J Nucl Med Mol Imaging. 2015;42:562–578. - PubMed

LinkOut - more resources