

The haemodynamic effects of crystalloid and colloid volume resuscitation on primary, derived and efficiency variables in post-CABG patients
- PMID: 30830495
- PMCID: PMC6399368
- DOI: 10.1186/s40635-019-0224-7
The haemodynamic effects of crystalloid and colloid volume resuscitation on primary, derived and efficiency variables in post-CABG patients
Abstract
Background: Recent studies in haemodynamic management have focused on fluid management and assessed its effects in terms of increase in cardiac output based on fluid challenges or variations in pulse pressure caused by cyclical positive pressure ventilation. The theoretical scope may be characterised as Starling-oriented. This approach ignores the actual events of right-sided excitation and left-sided response which is consistently described in a Guyton-oriented model of the cardiovascular system.
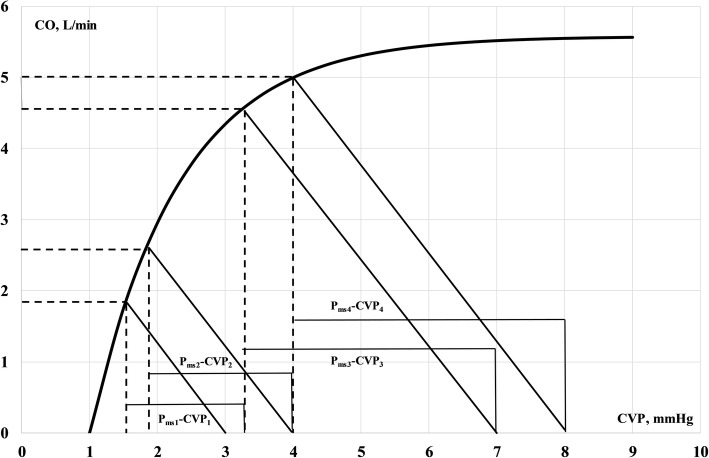
Aim: Based on data from a previous study, we aim to elucidate the primary response to crystalloid and colloid fluids in terms of cardiac output, mean blood pressure and right atrial pressure as well as derived and efficiency variables defined in terms of Guyton venous return physiology.
Method: Re-analyses of previously published data.
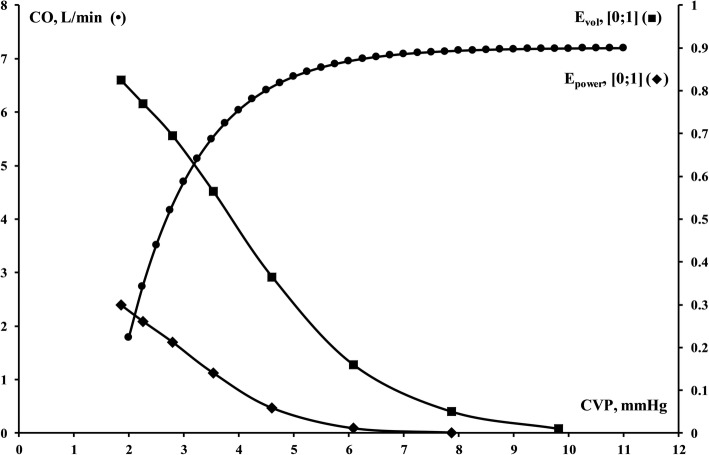
Results: Cardiac output invariably increased on infusion of crystalloid and colloid solutions, whereas static and dynamic efficiency measures declined in spite of increasing pressure gradient for venous return.
Discussion: We argue that primary as well as derived and efficiency measures should be reported and discussed when haemodynamic studies are reported involving fluid administrations.
Keywords: Cardiovascular; Fluid therapy; Haemodynamics; Methods; Models; Physiology; Utilisation.
Conflict of interest statement
Consent for publication
Not applicable.
Competing interests
The authors declare that they have no financial or non-financial competing interests in terms of reimbursements, fees, funding, or salary, stocks or shares, holding, or currently applying for, patents; political, personal, religious, ideological, academic, and intellectual competing interests.
Publisher’s Note
Springer Nature remains neutral with regard to jurisdictional claims in published maps and institutional affiliations.
Figures


References
-
- Skytte Larsson J, Bragadottir G, Krumbholz V, Redfors B, Sellgren J, Ricksten SE. Effects of acute plasma volume expansion on renal perfusion, filtration, and oxygenation after cardiac surgery: a randomized study on crystalloid vs colloid. Br J Anaesth. 2015;115:736–742. - PubMed
-
- Nadler SB, Hidalgo JH, Bloch T. Prediction of blood volume in normal human adults. Surgery. 1962;51:224–232. - PubMed
-
- Weber E-H, (1850) Ueber die Anwendung der Wellenlehre vom Kreislaufe des Blutes und insbesondere auf die Pulslehre Berichte über die Verhandlungen der Königlichen Sächsischen Gesellschaft der Wissenschaften zu Leipzig Mathematisch-Physische Classe 2: 164–204
-
- Starling EH. Some points in the pathology of heart disease. Lecture II. Lancet March. 1897;6:652–655.
-
- Guyton AC. Determination of cardiac output by equating venous return curves with cardiac response curves. Physiol Rev. 1955;35:123–129. - PubMed
LinkOut - more resources
Full Text Sources
