. 2019 Mar 4;11(5):1440-1456.
doi: 10.18632/aging.101844.

Genetic variation underlying cognition and its relation with neurological outcomes and brain imaging

Affiliations

Genetic variation underlying cognition and its relation with neurological outcomes and brain imaging

Maria J Knol et al. Aging (Albany NY). .

Abstract

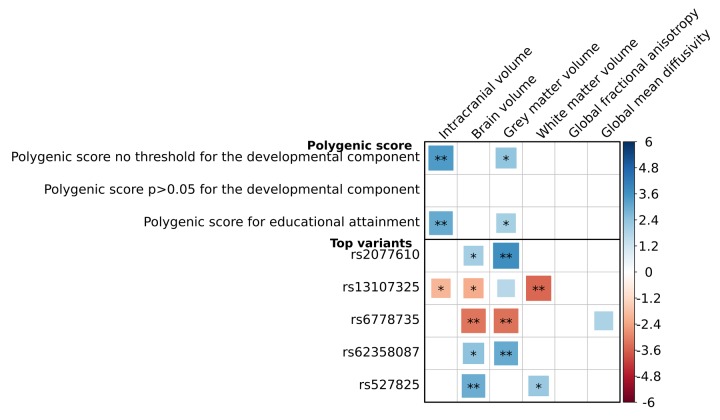
Cognition in adults shows variation due to developmental and degenerative components. A recent genome-wide association study identified genetic variants for general cognitive function in 148 independent loci. Here, we aimed to elucidate possible developmental and neurodegenerative pathways underlying these genetic variants by relating them to functional, clinical and neuroimaging outcomes. This study was conducted within the population-based Rotterdam Study (N=11,496, mean age 65.3±9.9 years, 58.0% female). We used lead variants for general cognitive function to construct a polygenic score (PGS), and additionally excluded developmental variants at multiple significance thresholds. A higher PGS was related to more years of education (β=0.29, p=4.3x10⁻⁷) and a larger intracranial volume (β=0.05, p=7.5x10⁻⁴). To a smaller extent, the PGS was associated with less cognitive decline (βΔG-factor=0.03, p=1.3x10⁻³), which became non-significant after adjusting for education (p=1.6x10⁻²). No associations were found with daily functioning, dementia, parkinsonism, stroke or microstructural white matter integrity. Excluding developmental variants attenuated nearly all associations. In conclusion, this study suggests that the genetic variants identified for general cognitive function are acting mainly through the developmental pathway of cognition. Therefore, cognition, assessed cross-sectionally, seems to have limited value as a biomarker for neurodegeneration.

Keywords: cognition; cognitive reserve; genetics; neuroimaging; neurological disorders.


Conflict of interest statement

CONFLICTS OF INTEREST: WJN is cofounder and shareholder of Quantib B.V. Other authors did not report conflicts of interest.

Figures

Figure 1
Figure 1
Flowchart presenting the in- and exclusions of participants in the different analyses. Abbreviations: magnetic resonance imaging (MRI).
Figure 2
Figure 2
Association of genetic variants for general cognitive function with (decline in) cognition and daily functioning, and educational attainment. Association between genetic variants and cognitive performance and daily functioning at one point in time, as well as years of education, adjusted for age and sex with and without adjustment for years of education (A), and change in cognitive performance and daily functioning over time (B), additionally adjusted for baseline measurement and time between baseline and follow-up measurement. Three polygenic scores are presented: a cognition polygenic score including all independent lead variants (N=170); a cognition polygenic score only including variants with a p>0.05 for the association with the developmental component of cognition, i.e. educational attainment and intracranial volume (N=36); and an educational attainment polygenic score, which contains the lead genetic variants for cognitive performance (N=170) but uses the weights for educational attainment. Larger blocks indicate higher t-values. Higher scores indicate better performance, except for the Stroop test, the Basic Activities of Daily Living and Instrumental Activities of Daily Living. Significance levels are indicated by asterisks: *p<0.05, nominally significant; **p<0.0038 (A) or p<0.0040 (B), adjusted for the number of independent traits as calculated through 10,000 permutations; ***p<2.2x10⁻⁵ (A; 0.0038/170) or p<2.4x10⁻⁵ (B; 0.0040/170), additionally adjusted for the number of genetic variants.
Figure 3
Figure 3
Polygenic scores for general cognitive function and disease-free probability for dementia, parkinsonism and stroke. Kaplan-Meier curves presenting the association between low (i.e. below the median) and high (above the median) polygenic scores and the disease-free probability over time for dementia, parkinsonism, and stroke. Abbreviations: polygenic score (PGS).
Figure 4
Figure 4
Association between genetic variants for general cognitive function and global brain imaging markers. Association between genetic variants for general cognitive function and both volumetric and global white matter microstructural integrity markers. For the volumetric outcomes, analyses were adjusted for age and sex, and additionally for intracranial volume if the outcome was not intracranial volume. For the microstructural integrity outcomes, analyses were adjusted for age, sex, white matter and white matter lesion volume. Three polygenic scores are presented: a cognition polygenic score including all independent lead variants (N=170); a cognition polygenic score only including variants with a p>0.05 for the association with the developmental component of cognition, i.e. educational attainment and intracranial volume (N=36); and an educational attainment polygenic score, which contains the lead genetic variants for cognitive performance (N=170) but uses the weights for educational attainment. Also, the five top genetic variants for the association with these brain imaging markers are presented. Positive associations depicted in blue correspond to a larger volume or a better white matter microstructural integrity. Larger blocks indicate higher t-values. Significance levels are indicated by asterisks: *p<0.05, nominally significant; **p<0.0101, adjusted for the number of independent traits as calculated through 10,000 permutations. No association was significant after additional adjustments for the number of genetic variants tested (p<5.9x10⁻⁵; 0.0101/170).
Figure 5
Figure 5
Association of polygenic scores for cognition and tract-specific diffusion-MRI measures. Nominally significant tracts are color-coded: dark-blue – inferior-fronto-occipital fasciculus; green – medial lemniscus; yellow – posterior thalamic radiation. Non-significant tracts are colored in light-blue.

References

    1. Gerstorf D, Ram N, Hoppmann C, Willis SL, Schaie KW. Cohort differences in cognitive aging and terminal decline in the Seattle Longitudinal Study. Dev Psychol. 2011; 47:1026–41. 10.1037/a0023426 - DOI - PMC - PubMed
    1. Hoogendam YY, Hofman A, van der Geest JN, van der Lugt A, Ikram MA. Patterns of cognitive function in aging: the Rotterdam Study. Eur J Epidemiol. 2014; 29:133–40. 10.1007/s10654-014-9885-4 - DOI - PubMed
    1. Davies G, Lam M, Harris SE, Trampush JW, Luciano M, Hill WD, Hagenaars SP, Ritchie SJ, Marioni RE, Fawns-Ritchie C, Liewald DC, Okely JA, Ahola-Olli AV, et al.. Study of 300,486 individuals identifies 148 independent genetic loci influencing general cognitive function. Nat Commun. 2018; 9:2098. 10.1038/s41467-018-04362-x - DOI - PMC - PubMed
    1. Razani J, Bayan S, Funes C, Mahmoud N, Torrence N, Wong J, Alessi C, Josephson K. Patterns of deficits in daily functioning and cognitive performance of patients with Alzheimer disease. J Geriatr Psychiatry Neurol. 2011; 24:23–32. 10.1177/0891988710390812 - DOI - PMC - PubMed
    1. Williams-Gray CH, Foltynie T, Brayne CE, Robbins TW, Barker RA. Evolution of cognitive dysfunction in an incident Parkinson’s disease cohort. Brain. 2007; 130:1787–98. 10.1093/brain/awm111 - DOI - PubMed

Publication types

LinkOut - more resources