. 2019 Feb 21;4(4):e124574.
doi: 10.1172/jci.insight.124574.

Single-cell analysis of fate-mapped macrophages reveals heterogeneity, including stem-like properties, during atherosclerosis progression and regression

Affiliations

Single-cell analysis of fate-mapped macrophages reveals heterogeneity, including stem-like properties, during atherosclerosis progression and regression

Jian-Da Lin et al. JCI Insight. .

Abstract

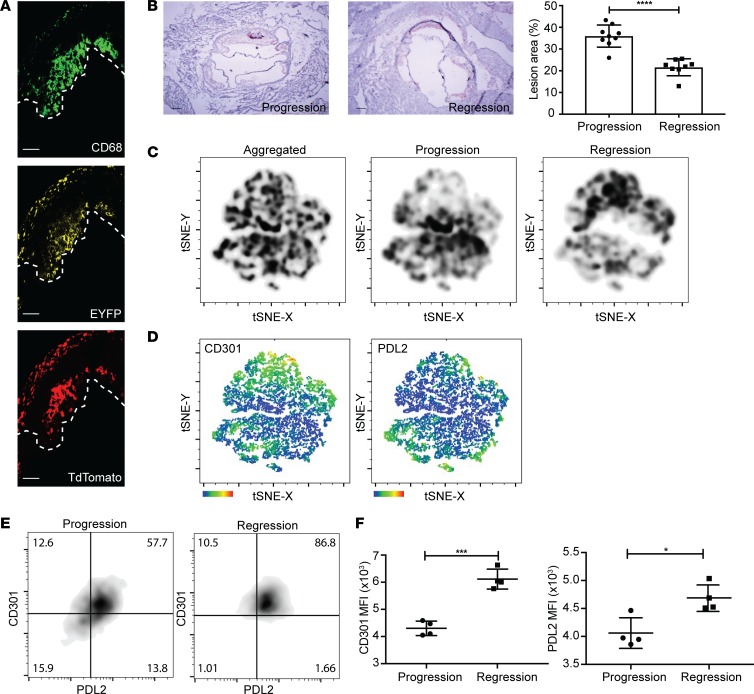
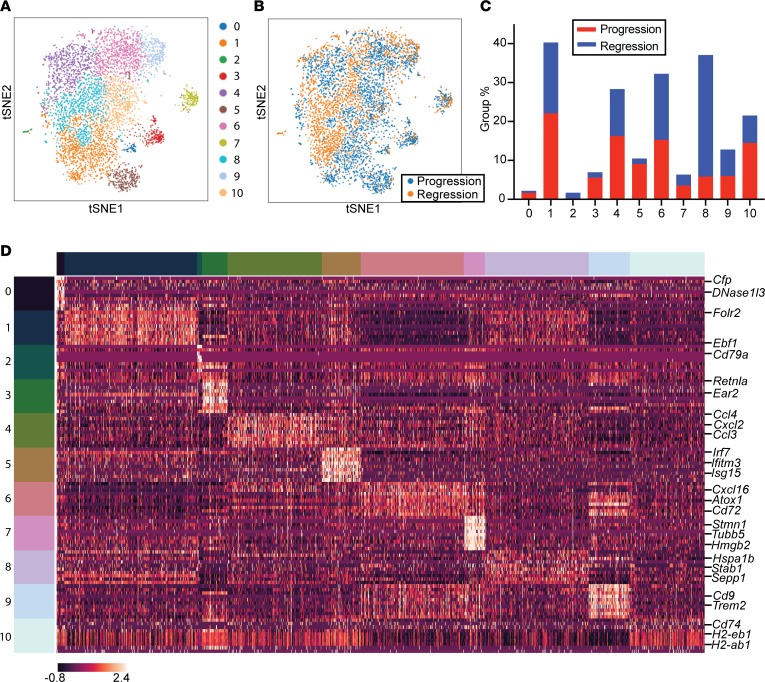
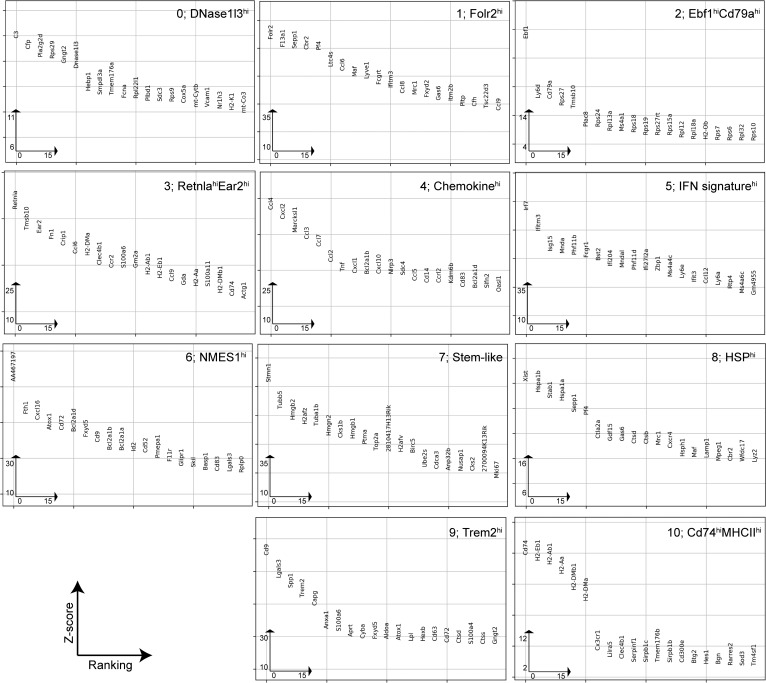
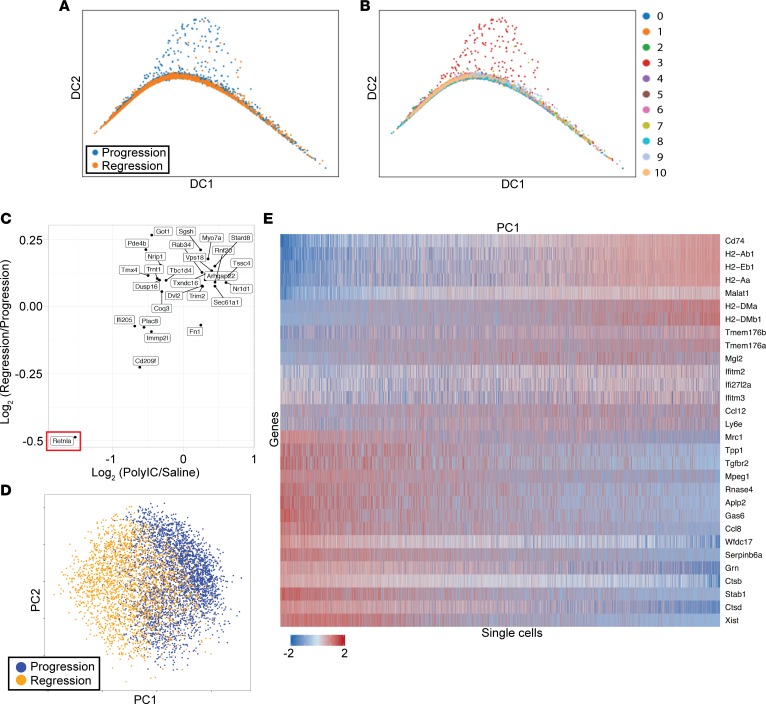
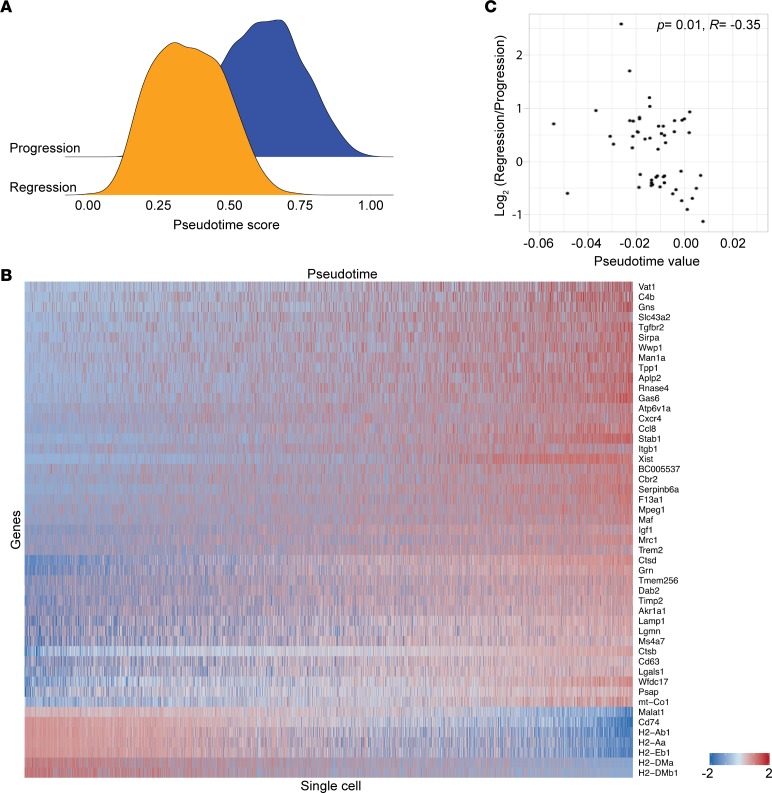
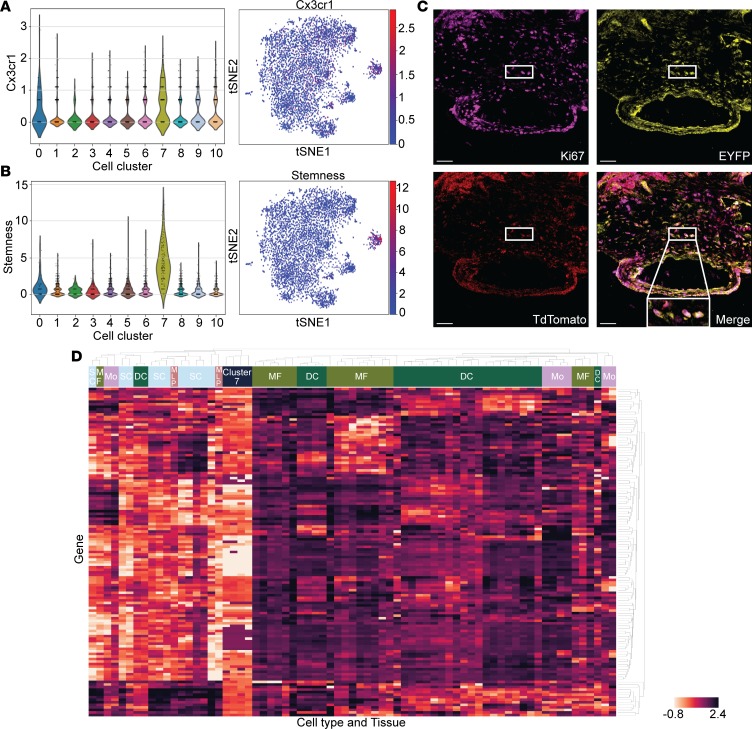
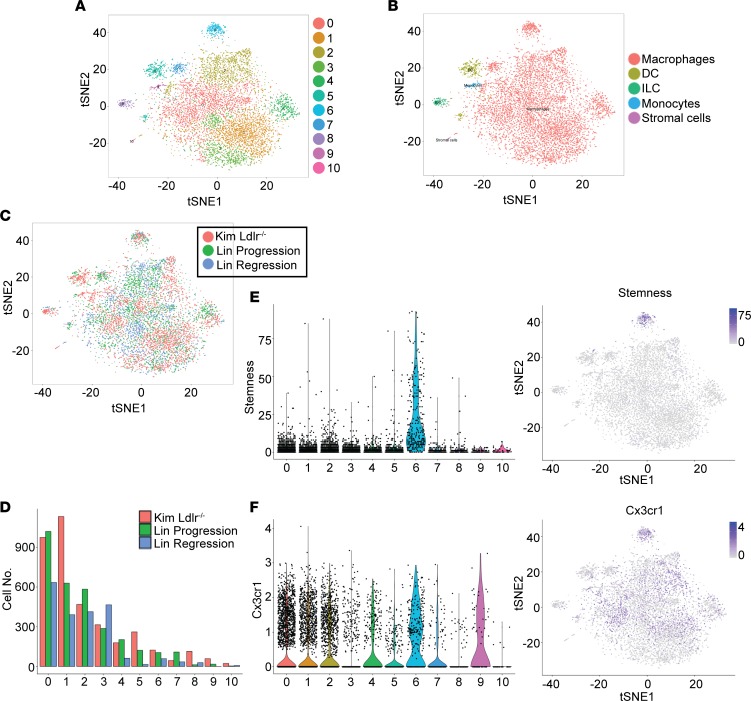
Atherosclerosis is a leading cause of death worldwide in industrialized countries. Disease progression and regression are associated with different activation states of macrophages derived from inflammatory monocytes entering the plaques. The features of monocyte-to-macrophage transition and the full spectrum of macrophage activation states during either plaque progression or regression, however, are incompletely established. Here, we use a combination of single-cell RNA sequencing and genetic fate mapping to profile, for the first time to our knowledge, plaque cells derived from CX3CR1+ precursors in mice during both progression and regression of atherosclerosis. The analyses revealed a spectrum of macrophage activation states with greater complexity than the traditional M1 and M2 polarization states, with progression associated with differentiation of CXC3R1+ monocytes into more distinct states than during regression. We also identified an unexpected cluster of proliferating monocytes with a stem cell-like signature, suggesting that monocytes may persist in a proliferating self-renewal state in inflamed tissue, rather than differentiating immediately into macrophages after entering the tissue.

Keywords: Atherosclerosis; Cardiology; Immunology; Macrophages; Molecular diagnosis.


Conflict of interest statement

Conflict of interest: The authors have declared that no conflict of interest exists.

Figures

Figure 1
Figure 1. Fate mapping the conversion of CX3CR1+ cells into plaque macrophages.
(A) Representative confocal images of aortic roots stained with CD68 (green), EYFP (yellow), and TdTomato (red) in BM chimeras of Ldlr–/– mice reconstituted with BM from Cx3cr1CreERT2-IRES-YFP/+Rosa26fl-tdTomato/+ mice (n = 3) gavaged with tamoxifen (TAM) at 14 and 15 weeks after feeding on a Western diet (WD) to label cells derived from CX3CR1+ monocytes. Scale bars: 50 μm. (BF) Analysis of aortic arches by flow cytometry of Cx3cr1CreERT2-IRES-YFP/+Rosa26fl-tdTomato/+ mice injected with AAV-PCSK9 and fed WD for 18 weeks before TAM treatment. Progression group mice (n = 4) were then kept on WD, while regression group mice were switched to chow and treated with ApoB-ASO for 2 weeks (n = 4). (B) Representative bright-field images and quantification of lesion areas of aortic roots. Scale bars: 50 um. (C) Density plot of t-distributed stochastic neighbor embedding (t-SNE) analysis of CD11b+TdTomato+ cells from aortic arches of mice in progression and regression groups subjected to aortic digestion. The aortic arches were analyzed by flow cytometry for expression of PD-L2, CD301, EYFP, F4/80, and MHCII markers (n = 8). (D) Heatmaps of geometric mean fluorescence, (E) quadrant plots, and (F) geometric MFI of PD-L2 and CD301 expression on CD11b+TdTomato+ cells from progression and regression groups in atherosclerotic Cx3cr1CreERT2-IRES-YFP/+Rosa26fl-tdTomato/+ mice with AAV-mPCSK9 induction. Progression, n = 4–9; regression, n = 4–8. Statistical significance was calculated using Student’s t test, and data are presented as mean ± SEM (B and F). *P < 0.05, ***P < 0.001, ****P < 0.0001.
Figure 2
Figure 2. Heterogeneity of plaque macrophages derived from CX3CR1+ monocyte precursors in atherosclerosis progression and regression.
Mice were treated as described in Figure 1. (A and B) We used Louvain clustering and multicore t-SNE to visualize 5355 CD11b+TdTomato+ single cells isolated from aortic arches of Cx3cr1CreERT2-IRES-YFP/+Rosa26fl-tdTomato/+ mice from the progression and regression groups (points, n = 4 mice per group; colored by [A] sub-cluster and [B] experimental group). (C) Cluster composition by percentages of experimental group (red, progression; blue, regression) in total sorted CD11b+TdTomato+ cells. (D) Cell type signatures are shown in heatmap in the relative expression level. Row-wise Z score of ln(X + 1), where X denotes transcript count per cell after normalization (mean = 0, SD = 1); color scale of genes (rows) across cell clusters (columns) is shown.
Figure 3
Figure 3. Classifications and gene lists of clusters of plaque macrophages derived from CX3CR1+ monocyte precursors in atherosclerosis progression and regression.
Ranking of top 20 genes significantly overexpressed in each Louvain cluster, determined by statistical testing of one versus the rest with overestimated-variance t test. Mean of row-wise Z-score in the indicated cluster (y axis) is compared with bulk mean of Z-score for the ranking (x axis).
Figure 4
Figure 4. Diffusion pseudotime and principal component analysis identification of genes associated with atherosclerosis progression and regression.
(A) Diffusion pseudotime (DPT) analysis identified a cellular branching point only present in the progression group (blue) for the RetnlahiEar2hi cell cluster 3 (red). (B) The population with the highest expression of CX3CR1 was selected as the “root” cells to perform the DPT analysis to predict differentiation of CX3CR1+ cells. (C) Merged gene expression log2 (polyI:C/saline) values from a previous atherosclerosis regression/progression study in Reversa mice (31) compared with gene-level log2(regression/progression) values from supervised analysis of the single-cell data for 27 differentially expressed genes, which confirms that Retnla expression (red box) is most negatively associated with regression in both data sets. (D) Principal component analysis (PCA) reveals a smooth transition of cells from progression and regression groups along the PC1 axis. (E) Heatmap of the genes with the greatest loading factors for the PC1 axis.
Figure 5
Figure 5. Pseudotime scores and related genes associated with atherosclerosis progression and regression.
(A) We used PC1 scores as a pseudotime measure and show shifted distributions of progression and regression cells. (B) Heatmap of genes identified to be significantly correlated with the pseudotime score. (C) We identified 53 genes significantly correlated with the pseudotime score that are negatively associated (r = –0.347, P = 0.01103) with merged gene expression log2 (polyI:C/saline) values from a previous atherosclerosis regression/progression study (38).
Figure 6
Figure 6. Identification of a proliferative “stem-like” cell cluster that retains CX3CR1 expression.
(A) Violin plot and heatmap showing higher expression of CX3CR1 in cluster 7. (B) Violin plot and heatmap showing higher expression of cell cycle genes in cluster 7. (C) Representative immunofluorescence images of aortic root staining with Ki-67 (purple), EYFP (yellow), and TdTomato (red) from the Cx3cr1CreERT2-IRES-YFP/+Rosa26fl-tdTomato/+ atherosclerotic mice in the progression group. Scale bars: 50 μm. (D) 138 genes that were expressed more than one read in 90% of cells in cluster 7 were compared with macrophages, monocytes, myeloid progenitors, stem cells, and DCs extracted from the ImmGen database. Cells from cluster 7 were randomly grouped into 4 subgroups (shown in black), and the median expression of each gene is shown. Heatmap analysis illustrates the clustering of similar cell types and genes based on normalized gene expression profiles.
Figure 7
Figure 7. Validation of the presence of a “stem-like” cell cluster from an independent study of atherosclerotic mice.
A recently published single-cell data set from Kim et al. (ref. ; “Kim”) from sorted CD45+ cells isolated from whole aortas of Ldlr–/– mice fed WD for 12 weeks was combined with our progression and regression data sets (Lin Progression, Lin Regression) with Seurat merging and aligned with canonical correlation analysis (CCA). (A) t-SNE visualization of the 8906 single cells from both data sets after Louvain clustering and colored by sub-cluster.(B) SingleR method was used for unbiased cell classifications of each sub-cluster against the ImmGen database and colored and labeled accordingly on the t-SNE plot. (C) t-SNE plot colored based on experimental group and data sets, showing that cluster 6 includes cells from all 3 experiments. (D) Cluster composition by cell numbers of experimental groups and data sets (red, Kim Ldlr–/–; green, Lin Progression; blue, Lin Regression) in total single cells. (E) Violin plot and heatmap showing the highest expression of cell cycle (“Stemness”) genes in cluster 6. (F) Violin plot and heatmap showing the expression of CX3CR1 in cluster 6.

Similar articles

Cited by

References

    1. McGill HC, McMahan CA, Gidding SS. Preventing heart disease in the 21st century: implications of the Pathobiological Determinants of Atherosclerosis in Youth (PDAY) study. Circulation. 2008;117(9):1216–1227. doi: 10.1161/CIRCULATIONAHA.107.717033. - DOI - PubMed
    1. Libby P, Tabas I, Fredman G, Fisher EA. Inflammation and its resolution as determinants of acute coronary syndromes. Circ Res. 2014;114(12):1867–1879. doi: 10.1161/CIRCRESAHA.114.302699. - DOI - PMC - PubMed
    1. Moore KJ, Sheedy FJ, Fisher EA. Macrophages in atherosclerosis: a dynamic balance. Nat Rev Immunol. 2013;13(10):709–721. doi: 10.1038/nri3520. - DOI - PMC - PubMed
    1. Epelman S, Lavine KJ, Randolph GJ. Origin and functions of tissue macrophages. Immunity. 2014;41(1):21–35. doi: 10.1016/j.immuni.2014.06.013. - DOI - PMC - PubMed
    1. Gundra UM, et al. Vitamin A mediates conversion of monocyte-derived macrophages into tissue-resident macrophages during alternative activation. Nat Immunol. 2017;18(6):642–653. doi: 10.1038/ni.3734. - DOI - PMC - PubMed

Publication types

MeSH terms