. 2019 Feb 21;4(4):e124952.
doi: 10.1172/jci.insight.124952.

Hyperglycemia induces skeletal muscle atrophy via a WWP1/KLF15 axis

Affiliations

Hyperglycemia induces skeletal muscle atrophy via a WWP1/KLF15 axis

Yu Hirata et al. JCI Insight. .

Abstract

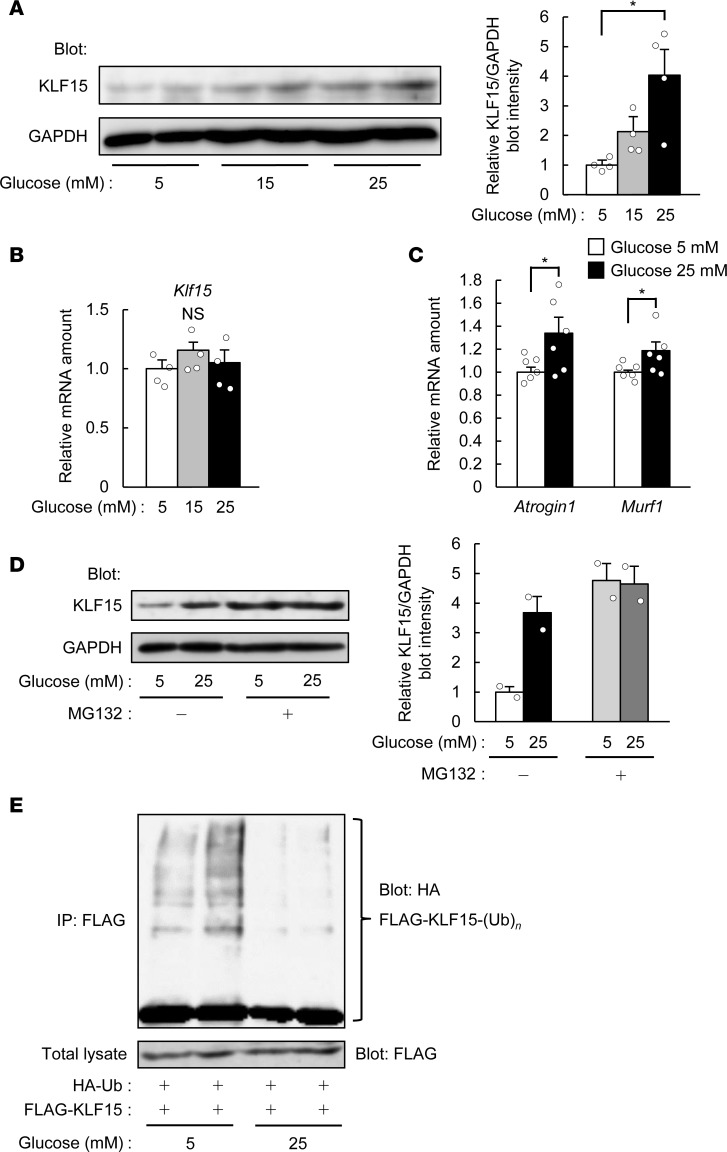
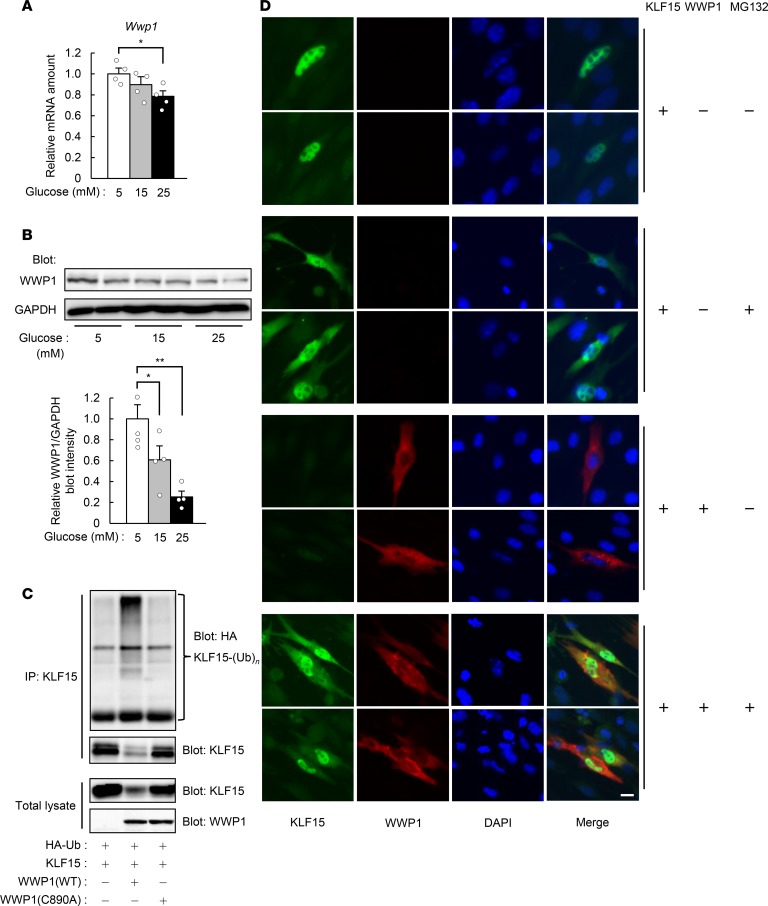
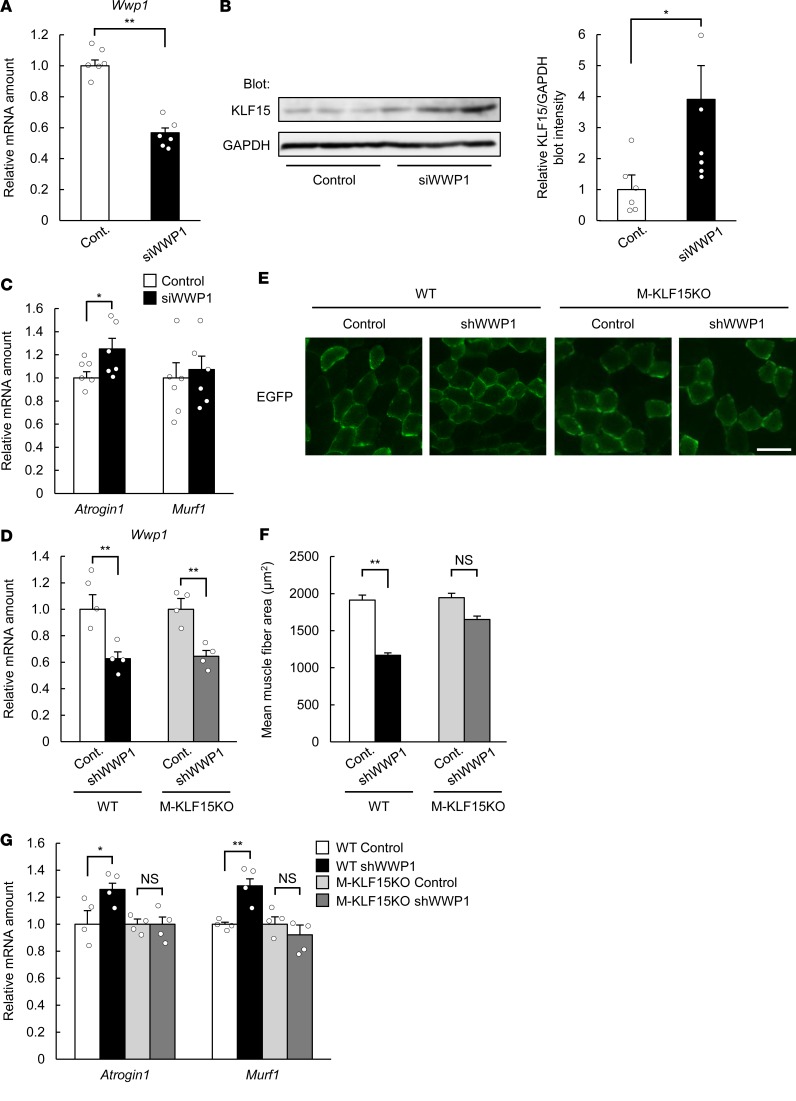
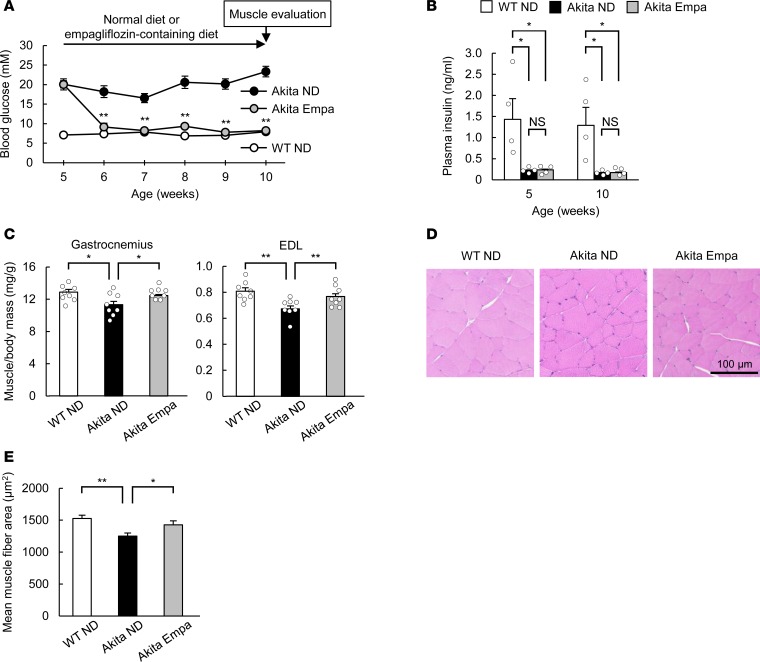
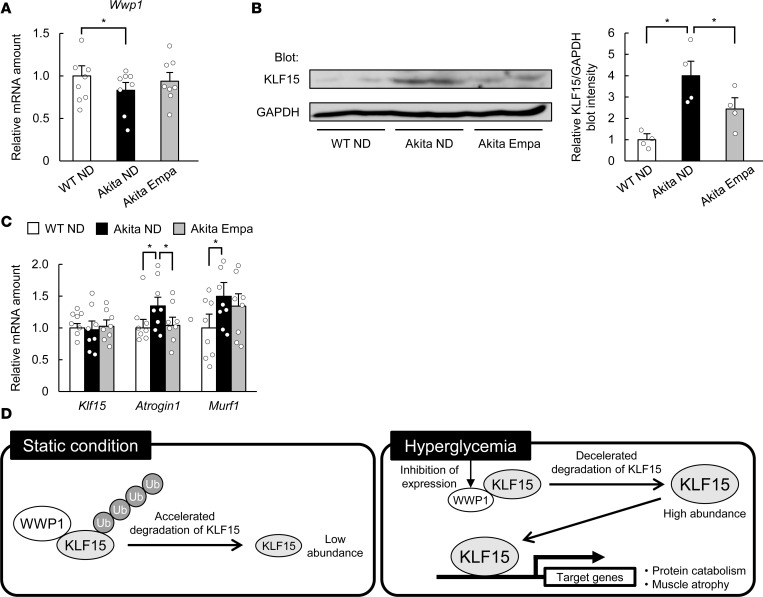
Diabetes mellitus is associated with various disorders of the locomotor system including the decline in mass and function of skeletal muscle. The mechanism underlying this association has remained ambiguous, however. We now show that the abundance of the transcription factor KLF15 as well as the expression of genes related to muscle atrophy are increased in skeletal muscle of diabetic model mice, and that mice with muscle-specific KLF15 deficiency are protected from the diabetes-induced decline of skeletal muscle mass. Hyperglycemia was found to upregulate the KLF15 protein in skeletal muscle of diabetic animals, which is achieved via downregulation of the E3 ubiquitin ligase WWP1 and consequent suppression of the ubiquitin-dependent degradation of KLF15. Our results revealed that hyperglycemia, a central disorder in diabetes, promotes muscle atrophy via a WWP1/KLF15 pathway. This pathway may serve as a therapeutic target for decline in skeletal muscle mass accompanied by diabetes mellitus.

Keywords: Diabetes; Metabolism; Muscle; Muscle Biology.


Conflict of interest statement

Conflict of interest: WO has received a research grant and lecture fees from Boehringer Ingelheim.

Figures

Figure 1
Figure 1. Skeletal muscle atrophy associated with diabetes is prevented in mice with skeletal muscle deficiency of KLF15.
(AD) Ratio of gastrocnemius or extensor digitorum longus (EDL) muscle mass to body mass (A; n = 12), quantitative reverse transcription PCR (RT-PCR) analysis of Klf15 mRNA in gastrocnemius (B; n = 6), immunoblot analysis of KLF15 and glyceraldehyde-3-phosphate dehydrogenase (GAPDH, loading control) in soleus muscle (nuclear fraction from 3 mice was loaded in 1 lane) (C; n = 2), and quantitative RT-PCR analysis of atrophy-related gene expression in gastrocnemius (D; n = 6) for control mice and diabetes-model mice at 21 days after the onset of STZ administration. (EH) Ratio of muscle mass to body mass (E; n = 12), histological determination of muscle fiber area in EDL (F and G), and atrophy-related gene expression in gastrocnemius (H; n = 6) for WT or M-KLF15KO mice at 21 days after the onset of STZ administration or vehicle (Cont.) injection. In G, the areas of 500 fibers were measured in each condition. All quantitative data are means ± SEM for the indicated numbers of mice. *P < 0.05, **P < 0.01; NS, not significant. Unpaired t test (A, B, and D) or 2-way ANOVA with Bonferroni’s post hoc test (E, G, and H).
Figure 2
Figure 2. Glucose decreases the ubiquitination of, and increases the protein abundance of, KLF15.
(A and B) Immunoblot analysis of KLF15 protein (A) and quantitative RT-PCR analysis of Klf15 mRNA (B; n = 4) in C2C12 myotubes exposed to the indicated concentrations of glucose for 24 hours. In A, a representative blot and quantitative data (n = 4) are shown in the left and right panels, respectively. (C) Quantitative RT-PCR analysis of muscle atrophy–related gene expression for myotubes treated as in A. n = 6. (D) Immunoblot analysis of KLF15 in myotubes exposed to 5 or 25 mM glucose in the absence or presence of 15 μM MG132 for 6 hours. A representative blot and quantitative data (n = 2) are shown in the left and right panels, respectively. (E) C2C12 myoblasts expressing HA-ubiquitin (Ub) and FLAG-KLF15 were incubated with 5 or 25 mM glucose for 24 hours and then subjected to immunoprecipitation (IP) with antibodies against FLAG. The resulting precipitates were analyzed by immunoblot with antibodies against HA to detect polyubiquitinated [-(Ub)n] KLF15, and the original cell lysates were analyzed by immunoblot with antibodies against FLAG. Representative data from 3 independent experiments are shown. All quantitative data are means ± SEM for the indicated numbers of independent experiments. *P < 0.05; NS, not significant. Two-way ANOVA with Bonferroni’s post hoc test (A and B) or unpaired t test (C).
Figure 3
Figure 3. WWP1 regulates the polyubiquitination and abundance of KLF15.
(A and B) Quantitative RT-PCR analysis of Wwp1 mRNA (A; n = 4) and immunoblot analysis of WWP1 protein (B) in C2C12 myotubes exposed to the indicated concentrations of glucose for 24 hours. In B, a representative blot and quantitative data (n = 4) are shown in the left and right panels, respectively. (C) COS-7 cells transfected with vectors for HA-Ub, KLF15, and either WT or C890A mutant forms of WWP1 were subjected to immunoprecipitation with antibodies against KLF15. The resulting precipitates and the original cell lysates were analyzed by immunoblot as indicated. (D) Immunofluorescence analysis of KLF15 and WWP1 in C2C12 myoblasts transfected with vectors for these proteins and exposed to 15 μM MG132 for 6 hours as indicated. Nuclei were stained with DAPI. Scale bar: 10 μm. In C and D, representative data from at least 3 independent experiments are shown. All quantitative data are means ± SEM for the indicated numbers of independent experiments. *P < 0.05, **P < 0.01. Two-way ANOVA with Bonferroni’s post hoc test (A and B).
Figure 4
Figure 4. WWP1 regulates skeletal muscle atrophy in a KLF15-dependent manner.
(A) Quantitative RT-PCR analysis of Wwp1 mRNA in C2C12 myotubes transfected with control or WWP1 siRNA. n = 6. (B and C) Immunoblot analysis of KLF15 (B) and quantitative RT-PCR analysis of Atrogin1 and Murf1 mRNAs (C; n = 6) in C2C12 myotubes transfected as in A. In B, a representative blot and quantitative data (n = 6) are shown in the left and right panels, respectively. (D) Quantitative RT-PCR analysis of Wwp1 mRNA in tibialis anterior muscle of WT or M-KLF15KO mice injected with AAVs encoding EGFP with or without (Cont.) WWP1 shRNA. n = 4. (E) Fluorescence microscopic detection of EGFP-positive muscle fibers of mice infected as in D. Scale bar: 100 μm. (F) Cross-sectional area of EGFP-positive muscle fibers determined from images as in E. The areas of 100 fibers were measured in each condition. (G) Quantitative RT-PCR analysis of Atrogin1 and Murf1 mRNAs in tibialis anterior muscle of mice infected as in D. n = 4. All quantitative data are means ± SEM for the indicated numbers of independent experiments (AC) or mice (D, F, and G). *P < 0.05, **P < 0.01; NS, not significant. Unpaired t test (AC) or 2-way ANOVA with Bonferroni’s post hoc test (D, F, and G).
Figure 5
Figure 5. SGLT2 inhibitor ameliorates age-dependent muscle atrophy in Akita mice.
(A and B) Blood glucose (A; n = 8) and plasma insulin (B; n = 4) levels of WT or Akita mice fed a normal diet (ND) or a diet containing empagliflozin (Empa) beginning at 5 weeks of age. (CE) Skeletal muscle/body mass ratios (C; n = 8) as well as histological determination of muscle fiber area in tibialis anterior muscle (D and E) of mice as in A at 10 weeks of age. In E, the areas of 200 fibers were measured in each condition. All quantitative data are means ± SEM for the indicated numbers of mice. *P < 0.05, **P < 0.01 for Akita Empa versus Akita ND (A) or for the indicated comparisons. NS, not significant. Two-way ANOVA with Bonferroni’s post hoc test (AC, and E).
Figure 6
Figure 6. SGLT2 inhibitor prevents the alteration of gene expression in Akita mice.
(AC) Quantitative RT-PCR analysis of Wwp1 (A; n = 8) or Klf15, Atrogin1, and Murf1 (C; n = 8) mRNAs, and immunoblot analysis of KLF15 (B) in gastrocnemius (A and C) or soleus muscle (nuclear fraction from 2 mice was loaded on one lane) (B) of mice as in Figure 5A at 10 weeks of age. In B, a representative blot and quantitative data (n = 4) are shown in the left and right panels, respectively. All quantitative data are means ± SEM for the indicated numbers of mice. *P < 0.05. Two-way ANOVA with Bonferroni’s post hoc test (AC). (D) Proposed role for the WWP1/KLF15 axis in hyperglycemia-induced muscle atrophy.

References

    1. Kodl CT, Seaquist ER. Cognitive dysfunction and diabetes mellitus. Endocr Rev. 2008;29(4):494–511. doi: 10.1210/er.2007-0034. - DOI - PMC - PubMed
    1. Calle EE, Kaaks R. Overweight, obesity and cancer: epidemiological evidence and proposed mechanisms. Nat Rev Cancer. 2004;4(8):579–591. doi: 10.1038/nrc1408. - DOI - PubMed
    1. Wong E, et al. Diabetes and risk of physical disability in adults: a systematic review and meta-analysis. Lancet Diabetes Endocrinol. 2013;1(2):106–114. doi: 10.1016/S2213-8587(13)70046-9. - DOI - PubMed
    1. Monaco CMF, Perry CGR, Hawke TJ. Diabetic myopathy: current molecular understanding of this novel neuromuscular disorder. Curr Opin Neurol. 2017;30(5):545–552. doi: 10.1097/WCO.0000000000000479. - DOI - PubMed
    1. Kalyani RR, Corriere M, Ferrucci L. Age-related and disease-related muscle loss: the effect of diabetes, obesity, and other diseases. Lancet Diabetes Endocrinol. 2014;2(10):819–829. doi: 10.1016/S2213-8587(14)70034-8. - DOI - PMC - PubMed

Publication types

MeSH terms