

Both increases and decreases in energy density lead to sustained changes in preschool children's energy intake over 5 days
- PMID: 30831180
- PMCID: PMC6475467
- DOI: 10.1016/j.physbeh.2019.02.042
Both increases and decreases in energy density lead to sustained changes in preschool children's energy intake over 5 days
Abstract
Background and objective: To investigate preschool children's ability to self-regulate their energy intake, we assessed their response to increases or decreases in dietary energy density (ED) over 5 consecutive days, a period likely long enough for compensatory behavior.
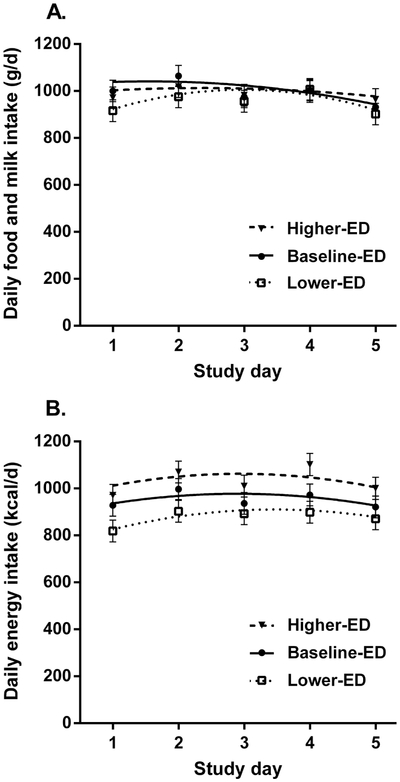
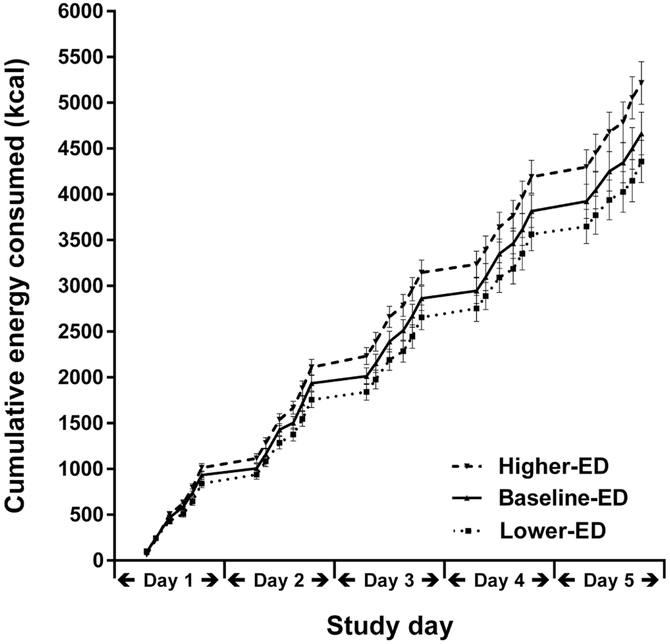
Methods: Using a crossover design, over 3 periods we served the same 5 daily menus to 49 children aged 3-5 y in their childcare centers. During each 5-day period, 3 main dishes and 1 snack per day were systematically varied in ED, from baseline ED to either higher ED (increased by 20%) or lower ED (decreased by 20%). All of the served items were weighed to determine individual intakes.
Results: Modifying the ED of 4 dishes per day had a significant and sustained effect on preschool children's daily energy intake across 5 days. In the baseline condition, children's intakes were similar to daily energy needs (98 ± 2%), but serving higher-ED foods increased energy intake by 84 ± 16 kcal/d (to 105 ± 2% of needs) and serving lower-ED foods decreased energy intake by 72 ± 17 kcal/d (to 89 ± 2% of needs; both P < .0001). The patterns of daily energy intake over the 5 days did not differ across conditions (P = .20), thus there was no evidence that either surfeits or deficits in energy intake led to adjustment over this time period. Furthermore, the response to ED varied, as children with a higher weight status had greater amounts of overconsumption when served higher-ED foods and of underconsumption when served lower-ED foods compared to children with a lower weight status.
Conclusions: These findings counter the suggestion that preschool children's regulatory systems can be relied on to adjust intake in response to energy imbalances. Increasing or decreasing the ED of several foods per day leads to sustained changes in the energy intake of preschool children.
Keywords: Eating behavior; Energy density; Energy intake; Energy regulation; Preschool children.
Copyright © 2019 Elsevier Inc. All rights reserved.
Conflict of interest statement
The authors’ responsibilities were as follows – ADS: design of the experiment, collection and analysis of data, and writing of the manuscript; LSR: design of the experiment, analysis of data, and writing of the manuscript; CES: design of the experiment, collection of data; FMZ: design of the experiment, collection of data; KLK: design of the experiment; BJR: design of the experiment and writing of the manuscript. None of the authors had a personal or financial conflict of interest.
Figures
References
-
- Davis CM. (1928). Self-selection of diets by newly weaned infants. American Journal of Clinical Nutrition, 36(4), 651–679.
-
- Birch LL, Johnson SL, Andersen MS, Peters JC, Schulte MC. (1991). The variability of young children’s energy intake. The New England Journal of Medicine, 324(4), 232–235. - PubMed
-
- Shea S, Stein AD, Basch CE, Contento IR, Zybert P. (1992). Variability and self-regulation of energy intake in young children in their everyday environment. Pediatrics, 90(4), 542–546. - PubMed
-
- Pearcey SM, de Castro JM. (1997). Food intake and meal patterns of one year old infants. Appetite, 29, 201–212. - PubMed
