. 2019 May:202:1-10.
doi: 10.1016/j.clim.2019.03.002. Epub 2019 Mar 1.

Compendium of synovial signatures identifies pathologic characteristics for predicting treatment response in rheumatoid arthritis patients

Affiliations

Compendium of synovial signatures identifies pathologic characteristics for predicting treatment response in rheumatoid arthritis patients

Ki-Jo Kim et al. Clin Immunol. 2019 May.

Abstract

Rheumatoid arthritis (RA) is therapeutically challenging due to patient heterogeneity and variability. Herein we describe a novel integration of RA synovial genome-scale transcriptomic profiling of different patient cohorts that can be used to provide predictive insights on drug responses. A normalized compendium consisting of 256 RA synovial samples that cover an intersection of 11,769 genes from 11 datasets was build and compared with similar datasets derived from OA patients and healthy controls. Differentially expression genes (DEGs) that were identified in three independent methods were fed into functional network analysis, with subsequent grouping of the samples based on a non-negative matrix factorization method. RA-relevant pathway activation scores and four machine learning classification techniques supported the generation of a predictive model of patient treatment response. We identified 876 up-regulated DEGs including 24 known genetic risk factors and 8 drug targets. DEG-based subgrouping revealed 3 distinct RA patient clusters with distinct activity signatures for RA-relevant pathways. In the case of infliximab, we constructed a classifier of drug response that was highly accurate with an AUC/AUPR of 0.92/0.86. The most informative pathways in achieving this performance were the NFκB-, FcεRI- TCR-, and TNF signaling pathways. Similarly, the expression of the HMMR, PRPF4B, EVI2A, RAB27A, MALT1, SNX6, and IFIH1 genes contributed in predicting the patient outcome. Construction and analysis of normalized synovial transcriptomic compendia can provide useful insights for understanding RA-related pathway involvement and drug responses for individual patients.

Keywords: Clustering; Drug responsiveness; Gene expression; Machine learning; Rheumatoid arthritis.


Conflict of interest statement

Competing financial interests

The authors have no conflicts of interest to disclose.

Figures
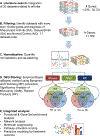
Fig. 1.
Fig. 1.. Overview of the data processing steps.
(A) Twenty studies maximally covering 20,511 genes were retrieved from the literature. (B) Selected were 11 datasets adequate to integrated analysis, which included 256 RA, 41 OA, and 36 NC samples covering 11,769 gene. (C) The merged dataset was normalized using quantile method and its batch effect was corrected. (D) DEG of RA compared to OA or NC were obtained using three methods, eBayes, SAM, and RP. Intersection of three DEG sets was chosen as significant DEG. The number of DEG was 2762 in RA versus OA and 3087 in RA versus NC. (E) A list of strategies for integrated analysis. (Abbreviation: RA, rheumatoid arthritis; OA, osteoarthritis; NC, normal controls; DEG, differentially expressed genes; eBayes, empirical Bayes; SAM, significance analysis of microarray; RP, rank products).
Fig. 2.
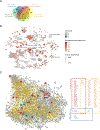
Fig. 2.. Differentially expressed genes and their functional network.
(A) Venn diagram showing the overlap of up- and down-regulated DEG between RA versus OA and RA versus NC. (B) Gene-Set enrichment map for up-regulated DEG. Nodes represent GO-termed gene-sets. Their color intensity and size is proportional to the enrichment significance and the gene size, respectively. Edge thickness represents the degree of overlap between gene sets and only edges with a Jaccard coefficient larger than 0.25 were visualized. Clusters of functionally related gene-sets were manually curated based on the GO parent-child hierarchy and assigned a label. (C) Protein-Protein interaction network of up-regulated DEG. Red and blue nodes indicate the known RA-susceptible genes and drug target molecules, respectively. Drug targets were defined subject to the targets of drugs currently in use or under clinical trial and development. Yellow nodes correspond to the hub molecules, which are determined as the shared genes in top 10% with the highest rank in each arm of three centrality parameters; degree, closeness, and betweenness. Orange, green, and purple colored-nodes are the overlapped between red and yellow, yellow and blue, and red and blue ones, respectively. Right-side inset box is the schematic diagram of the interesting genes.
Fig. 3.
Fig. 3.. Identification of novel RA subgroups according to synovial signatures.
(A) Reordered consensus matrices on RA compendium. The samples were clustered using average linkage and 1-correlation distances. Deep-red color indicates perfect agreement of the solution, whilst blue color indicates no agreement (Right-side color bar). Basis and consensus represent clusters based on the basis and consensus matrices, respectively. The silhouette score is a similarity measure within its own cluster compared to other clusters. (B) t-SNE and (C) PCA reduces the dimensions of a multivariate dataset. Each data point is assigned a location in a two-dimensional map to illustrate potential clusters of neighboring samples, which contain similar gene expression patterns.
Fig. 4.
Fig. 4.. Pathway activation scores according to RA subgroups.
Chord diagram shows interrelationship among pathways and link thickness is proportional to the overlap between two pathways, calculated using the Jaccard coefficients. Turkey boxplots reveals pathway activation scores across the RA subgroups and ANOVA test was used to analyze the differences among groups. *, P<0.05; **, P<0.01; ***, P<0.001.
Fig. 5.
Fig. 5.
(A) Frequency and distribution of 3 subgroups by seropositivity. Estimation was on basis of the information available in the 9 datasets (233 samples). (B) Frequency and distribution of 3 subgroups by the two-opposing datasets. To examine the association of disease duration and activity, two distinctively opposing datasets were selected from the compendium for comparison. GSE45867 is a group of samples with shorter duration and moderate disease activity and GSE21537 is with longer duration and high disease activity. The number of samples assigned by subgroups and characteristics of the dataset was summarized. Distribution of 3 subgroups did not differ between two datasets (P=0.754).
Fig. 6.
Fig. 6.. Predictive models and their performance.
(a) Pathway-driven models. (b) DEG-driven models. (Left plot) The training and testing balanced accuracy for each classifier as compared with the baseline. All models outperformed the baseline (all P<0.001) and the performance of the trained models was significantly compromised in testing sets (all P<0.001). (Middle and right plots) Averaged ROC and PR curves showing the performance of each classifier.

References

    1. Lee DM, Weinblatt ME. Rheumatoid arthritis. Lancet, 2001;358:903–11. - PubMed
    1. Smolen JS, Aletaha D. Rheumatoid arthritis therapy reappraisal: strategies, opportunities and challenges. Nat Rev Rheumatol, 2015;11:276–89. - PubMed
    1. Burska AN, Roget K, Blits M, Soto Gomez L, van de Loo F, Hazelwood LD et al. Gene expression analysis in RA: towards personalized medicine. Pharmacogenomics J, 2014;14:93–106. - PMC - PubMed
    1. You S, Cho CS, Lee I, Hood L, Hwang D, Kim WU. A systems approach to rheumatoid arthritis. PLoS One, 2012;7:e51508. - PMC - PubMed
    1. van Baarsen LG, Wijbrandts CA, Timmer TC, van der Pouw Kraan TC, Tak PP, Verweij CL. Synovial tissue heterogeneity in rheumatoid arthritis in relation to disease activity and biomarkers in peripheral blood. Arthritis Rheum, 2010;62:1602–7. - PubMed