Review
. 2019 Jun:193:35-45.
doi: 10.1016/j.neuroimage.2019.02.057. Epub 2019 Mar 1.

Ten simple rules for predictive modeling of individual differences in neuroimaging

Affiliations
Review

Ten simple rules for predictive modeling of individual differences in neuroimaging

Dustin Scheinost et al. Neuroimage. 2019 Jun.

Abstract

Establishing brain-behavior associations that map brain organization to phenotypic measures and generalize to novel individuals remains a challenge in neuroimaging. Predictive modeling approaches that define and validate models with independent datasets offer a solution to this problem. While these methods can detect novel and generalizable brain-behavior associations, they can be daunting, which has limited their use by the wider connectivity community. Here, we offer practical advice and examples based on functional magnetic resonance imaging (fMRI) functional connectivity data for implementing these approaches. We hope these ten rules will increase the use of predictive models with neuroimaging data.

Keywords: Classification; Connectome; Cross-validation; Machine learning; Neural networks.


Figures

Fig. 1.
Fig. 1.
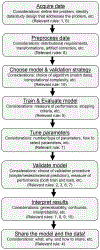
General workflow for a predictive modeling study using neuroimaging data. Each box illustrates a different step in a typical study, along with relevant considerations. Pertinent rules discussed in the text are highlighted in each box as appropriate.
Fig. 2.
Fig. 2.
Comparison of standardized MSE for different cross-validation methods for either A) variable training data size or B) constant training data size. A) Using 200 iterations of random sampling of 500 individuals from the Human Connectome (HCP) dataset, connectome-based predictive modeling (CPM) was applied to predict a measure of fluid intelligence (PMAT) with 4 different cross-validation strategies: split-half, 5-fold, 10-fold, and leave-one-out (LOO) cross-validation. For each strategy, the size of the training data was variable (i.e. the total sample was held constant) with split-half cross-validation using the least individuals for training (N = 250) and leave-one-out using the most individuals for training (N = 499). All cross-validation strategies give similar prediction performance with leave-out-one cross-validation performing the best due to the greater amount of training data. B) In contrast, when using 200 iterations of random sampling of individuals from the HCP dataset but keeping the number of individuals in training data constant (N = 180) (i.e. the total sample for each strategy was variable), leave-out-one cross-validation exhibited the largest variance in performance. Additionally, split-half cross-validation exhibited the smallest variance in performance. These data demonstrate the bias-variance tradeoff of different cross-validation strategies. See Supplemental Methods for further methodological details.
Fig. 3.
Fig. 3.
Comparison of prediction R2 calculated directly from comparing observed and predicted values and explanatory R2 calculated from linear regression. Using 200 iterations of 400 individual for training and 400 individuals for testing randomly selected from the HCP dataset, CPM was used to predict PMAT using split-half, 5-fold, 10-fold, and leave-one-out (LOO) cross-validation. Each point represents the same CPM model evaluated with prediction R2 (on the y-axis) and explanatory R2 (on the x-axis). Prediction R2 was calculated as 1 minus normalized mean squared error between the observed and predicted values (see Rule #5), while explanatory R2 was calculated as the square of the Pearson correlation between the observed and predicted values. For all cross-validation strategies, R2 from linear regression over-estimates performance when compared to R2 calculated directly from comparing observed and predicted values. This bias is the greatest at lower prediction performance and reduces for better predicting models. The line in each plot represents the y = x line. See Supplemental Methods for further methodological details.
Fig. 4.
Fig. 4.
Comparison of prediction performance as a function of the number of individuals in the training data. Using 200 iterations of 400 individuals for training and 400 individuals for testing randomly selected from the HCP dataset, CPM was used to predict PMAT using a variable number of individuals in the training data, starting with 25 individual up to 400 individual in steps of 25 individuals. Each CPM model was then evaluated on the same 400 test subjects, for each iteration. Increasing the number of individuals in the training data increased the performance of the CPM model with performance beginning to plateau with >200 individuals for training. The panel on the left shows model performance evaluated with standardized MSE. The panel on the right shows model performance evaluated with Pearson’s correlation. See Supplemental Methods for further methodological details.

References

    1. Abraham A, Milham MP, Di Martino A, Craddock RC, Samaras D, Thirion B, Varoquaux G, 2017. Deriving reproducible biomarkers from multi-site resting-state data: an Autism-based example. Neuroimage 147, 736–745. - PubMed
    1. Alexander DL, Tropsha A, Winkler DA, 2015. Beware of R(2): simple, unambiguous assessment of the prediction accuracy of QSAR and QSPR models. J. Chem. Inf. Model 55, 1316–1322. - PMC - PubMed
    1. Andrews-Hanna JR, Snyder AZ, Vincent JL, Lustig C, Head D, Raichle ME, Buckner RL, 2007. Disruption of large-scale brain systems in advanced aging. Neuron 56, 924–935. - PMC - PubMed
    1. Baehrens D, Schroeter T, Harmeling S, Kawanabe M, Hansen K, M K-R, 2010. How to explain individual classification decisions. #252, ller J. Mach. Learn. Res 11, 1803–1831.
    1. Baldi P, Brunak S, Chauvin Y, Andersen CA, Nielsen H, 2000. Assessing the accuracy of prediction algorithms for classification: an overview. Bioinformatics 16, 412–424. - PubMed

Publication types