. 2019 May:77:169-177.
doi: 10.1016/j.neurobiolaging.2018.12.009. Epub 2019 Jan 4.

Functional network resilience to pathology in presymptomatic genetic frontotemporal dementia

Collaborators, Affiliations

Functional network resilience to pathology in presymptomatic genetic frontotemporal dementia

Timothy Rittman et al. Neurobiol Aging. 2019 May.

Abstract

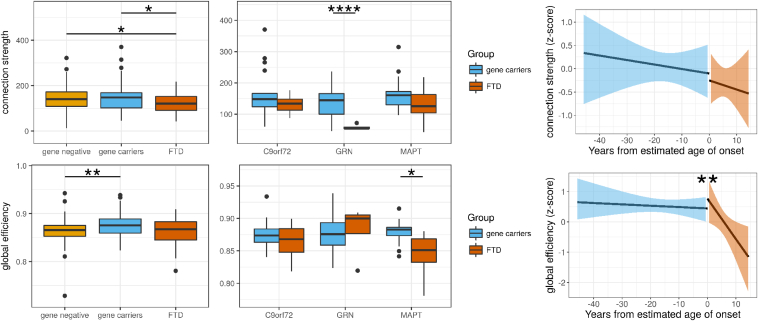
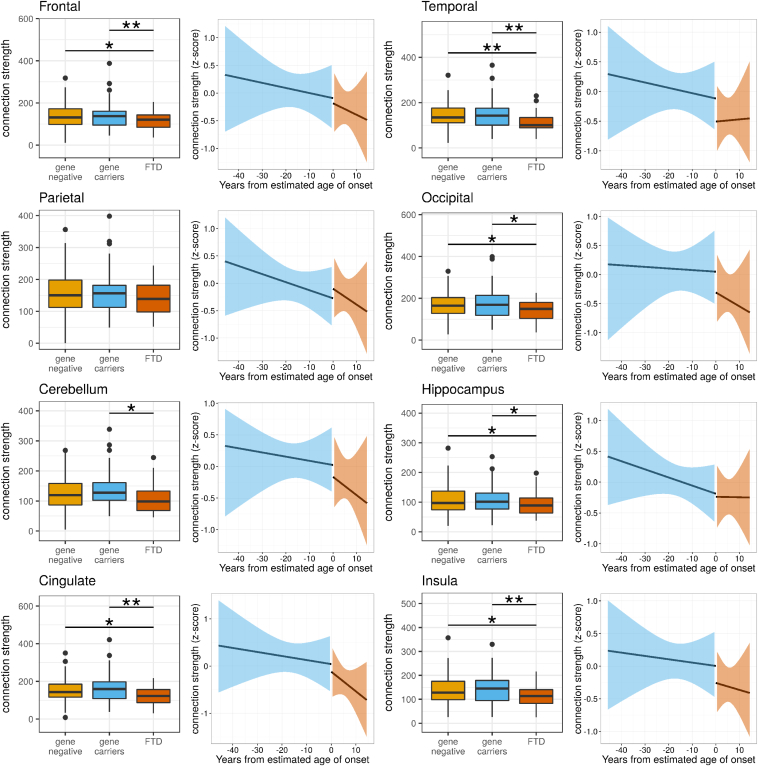
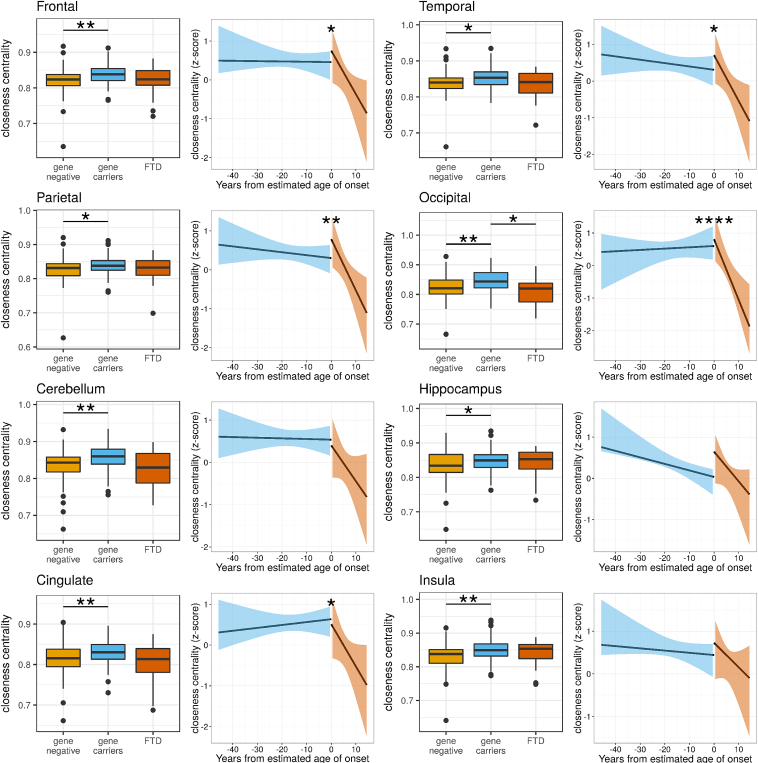
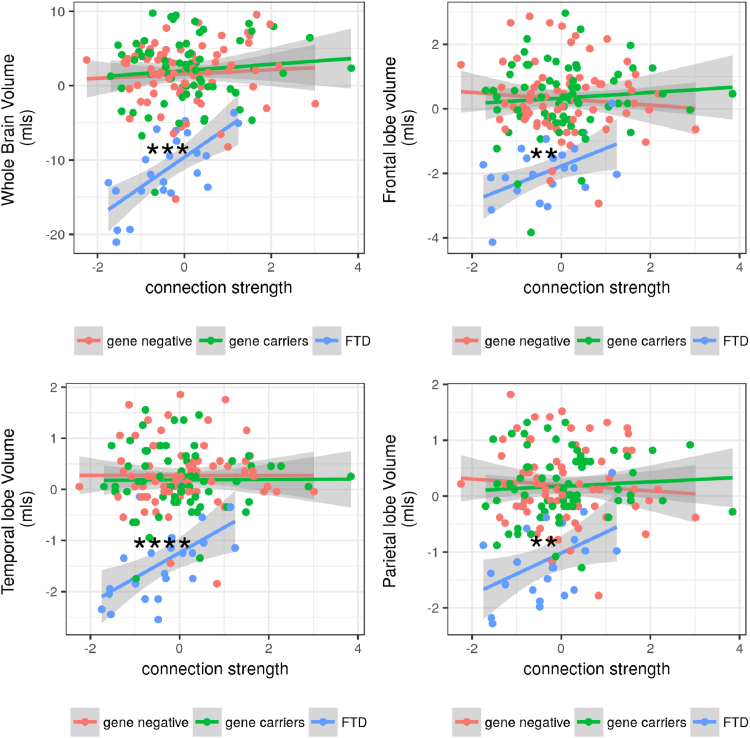
The presymptomatic phase of neurodegenerative diseases are characterized by structural brain changes without significant clinical features. We set out to investigate the contribution of functional network resilience to preserved cognition in presymptomatic genetic frontotemporal dementia. We studied 172 people from families carrying genetic abnormalities in C9orf72, MAPT, or PGRN. Networks were extracted from functional MRI data and assessed using graph theoretical analysis. We found that despite loss of both brain volume and functional connections, there is maintenance of an efficient topological organization of the brain's functional network in the years leading up to the estimated age of frontotemporal dementia symptom onset. After this point, functional network efficiency declines markedly. Reduction in connectedness was most marked in highly connected hub regions. Measures of topological efficiency of the brain's functional network and organization predicted cognitive dysfunction in domains related to symptomatic frontotemporal dementia and connectivity correlated with brain volume loss in frontotemporal dementia. We propose that maintaining the efficient organization of the brain's functional network supports cognitive health even as atrophy and connectivity decline presymptomatically.

Keywords: Cognition; Connectivity; Frontotemporal dementia; Functional imaging; Genetics.


Figures

Fig. 1
Fig. 1
Connection strength is reduced in genetic FTD compared to asymptomatic gene–carrying relatives. Differences between the genetic FTD group and presymptomatic-gene carrying relatives demonstrate reduced connection strength using a mixed-effects linear model (p = 0.01) with no difference in global efficiency (p = 0.2). The results for individual genes are shown for completeness, although we would be cautious in interpreting these results, given the small group sizes. Using a simple t-test, there was significantly reduced connection strength in the PGRN FTD group (p < 0.00001) and global efficiency in the MAPT FTD group (p = 0.02). To assess whether there was a nonlinear relationship between network measures and time to the estimated age of symptom onset, we performed discontinuous breakpoint analysis. There was a significant breakpoint in global efficiency (p = 0.009) but not for connection strength (p = 0.9). Significance values: <0.05, ∗∗<0.01, ∗∗∗<0.001. FTD, frontotemporal dementia.
Fig. 2
Fig. 2
Although relevant brain regions demonstrate reduced connectivity in FTD, there is no significant change at symptom onset. For each brain region, the difference in connection strength between gene carrier and FTD groups is presented; significant values were calculated using a mixed-effects linear regression model. There were significant differences in the frontal, temporal, occipital, cingulate, and insula cortices (see eResults). However, no brain region demonstrated a significant breakpoint in connect strength at the age of symptom onset (using a piecewise linear regression model). Significance values: <0.05, ∗∗<0.01, ∗∗∗<0.001. FTD, frontotemporal dementia.
Fig. 3
Fig. 3
Brain regions demonstrate both reduced efficiency in FTD and a significant decline in efficiency beginning at symptom onset. For each brain region, the difference in closeness centrality between gene carrier and FTD groups are presented; significant values were calculated using a mixed-effects linear regression model (see eResults). There were significant differences in the frontal, temporal, occipital, cerebellar, and cingulate cortices. In contrast to the connectivity results, there were significant breakpoints in closeness centrality at the age of symptom onset in frontal, temporal, parietal, occipital, and cingulate cortices. These findings suggest that an efficient brain structure is maintained in these brain regions up to the time that symptoms of FTD emerge but that the efficient structure rapidly breaks down thereafter. Significance values: <0.05, ∗∗ <0.01. FTD, frontotemporal dementia.
Fig. 4
Fig. 4
Whole-brain atrophy and the atrophy in relevant brain regions are correlated with the loss of connectivity only after symptom onset. We examined whether the volume of the whole brain and brain regions was associated with loss of connection strength. There was a relationship between volume and connection strength in the whole brain (p = 0.0002), frontal lobe (p = 0.005), and temporal lobes (p < 0.00001) in the FTD group only and not in the gene carrier group; in each case, there was a significant difference between the relationship in the FTD group and gene carrier groups (whole-brain p = 0.001; frontal lobes p = 0.02; temporal lobes p = 0.0002). Significance values: ∗∗<0.01, ∗∗∗<0.001, ∗∗∗∗<0.0001. FTD, frontotemporal dementia.

References

    1. Achard S., Bullmore E.T. Efficiency and cost of economical brain functional networks. PLoS Comput. Biol. 2007;3:e17. - PMC - PubMed
    1. Achard S., Salvador R., Whitcher B., Suckling J., Bullmore E.T. A resilient, low-frequency, small-world human brain functional network with highly connected association cortical hubs. J. Neurosci. 2006;26:63–72. - PMC - PubMed
    1. Achard S., Delon-Martin C., Vértes P.E., Renard F., Schenck M., Schneider F., Heinrich C., Kremer S., Bullmore E.T. Hubs of brain functional networks are radically reorganized in comatose patients. Proc. Natl. Acad. Sci. U. S. A. 2012;109:20608–20613. - PMC - PubMed
    1. Biswal B., van Kylen J., Hyde J.S. Simultaneous assessment of flow and BOLD signals in resting-state functional connectivity maps. NMR Biomed. 1997;10:165–170. - PubMed
    1. Brookes M.J., Woolrich M., Luckhoo H., Price D., Hale J.R., Stephenson M.C., Barnes G.R., Smith S.M., Morris P.G. Investigating the electrophysiological basis of resting state networks using magnetoencephalography. Proc. Natl. Acad. Sci. U. S. A. 2011;108:16783–16788. - PMC - PubMed

Publication types

MeSH terms