

Speech synthesis from ECoG using densely connected 3D convolutional neural networks
- PMID: 30831567
- PMCID: PMC6822609
- DOI: 10.1088/1741-2552/ab0c59
Speech synthesis from ECoG using densely connected 3D convolutional neural networks
Abstract
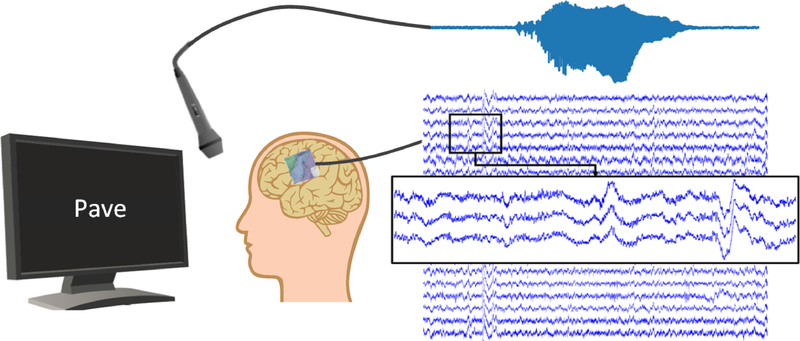
Objective: Direct synthesis of speech from neural signals could provide a fast and natural way of communication to people with neurological diseases. Invasively-measured brain activity (electrocorticography; ECoG) supplies the necessary temporal and spatial resolution to decode fast and complex processes such as speech production. A number of impressive advances in speech decoding using neural signals have been achieved in recent years, but the complex dynamics are still not fully understood. However, it is unlikely that simple linear models can capture the relation between neural activity and continuous spoken speech.
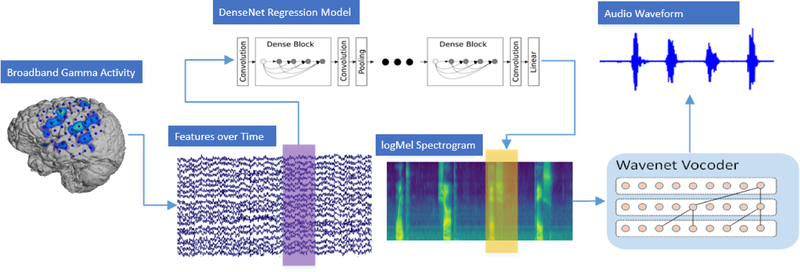
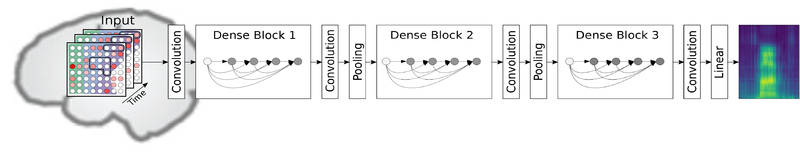
Approach: Here we show that deep neural networks can be used to map ECoG from speech production areas onto an intermediate representation of speech (logMel spectrogram). The proposed method uses a densely connected convolutional neural network topology which is well-suited to work with the small amount of data available from each participant.
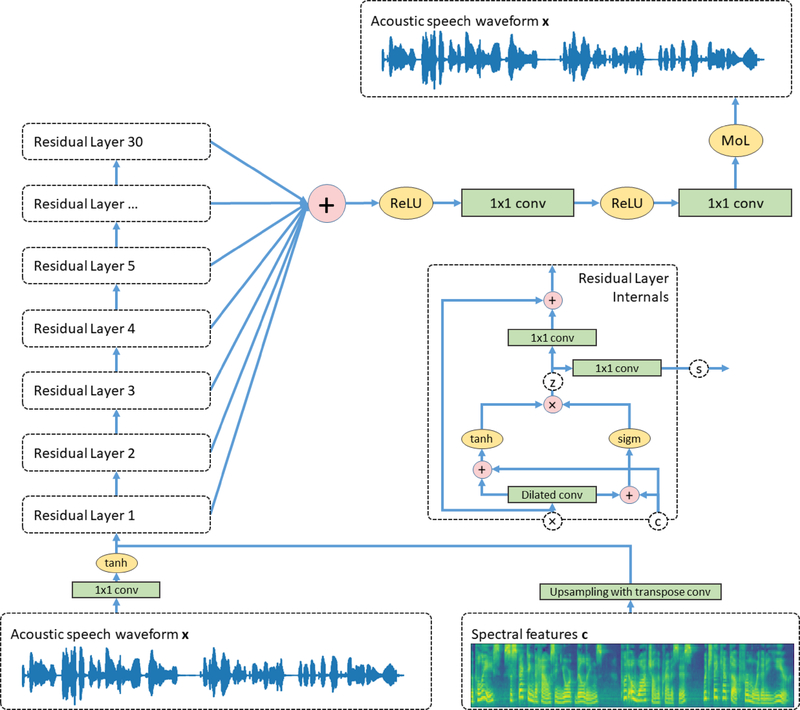
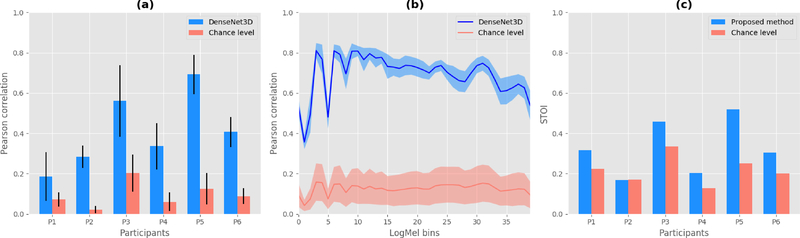
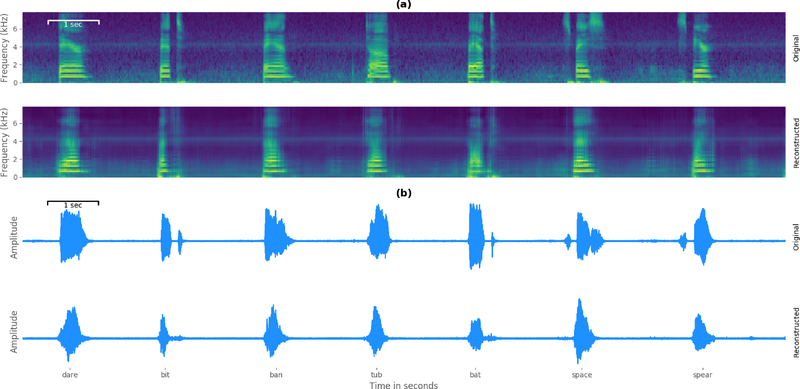
Main results: In a study with six participants, we achieved correlations up to r = 0.69 between the reconstructed and original logMel spectrograms. We transfered our prediction back into an audible waveform by applying a Wavenet vocoder. The vocoder was conditioned on logMel features that harnessed a much larger, pre-existing data corpus to provide the most natural acoustic output.
Significance: To the best of our knowledge, this is the first time that high-quality speech has been reconstructed from neural recordings during speech production using deep neural networks.
Figures
References
-
- Pirila S, van der Meere J, Pentikainen T, Ruusu-Niemi P, Korpela R, Kilpinen J, and Nieminen P, “Language and motor speech skills in children with cerebral palsy,” Journal of communication disorders, vol. 40, no. 2, pp. 116–128, 2007. - PubMed
-
- Turner GS, Tjaden K, and Weismer G, “The influence of speaking rate on vowel space and speech intelligibility for individuals with amyotrophic lateral sclerosis,” Journal of Speech, Language, and Hearing Research, vol. 38, no. 5, pp. 1001–1013, 1995. - PubMed
-
- Kent RD, Kent JF, Weismer G, Sufit RL, Rosenbek JC, Martin RE, and Brooks BR, “Impairment of speech intelligibility in men with amyotrophic lateral sclerosis,” Journal of Speech and Hearing Disorders, vol. 55, no. 4, pp. 721–728, 1990. - PubMed
-
- Starmer HM, Tippett DC, and Webster KT, “Effects of laryngeal cancer on voice and swallowing,” Otolaryngologic Clinics of North America, vol. 41, no. 4, pp. 793–818, 2008. - PubMed
-
- Schultz T, Wand M, Hueber T, Krusienski DJ, Herff C, and Brumberg JS, “Biosignal-based spoken communication: A survey,” IEEE/ACM Transactions on Audio, Speech and Language Processing, vol. 25, no. 12, pp. 2257–2271, November 2017.
Publication types
MeSH terms
Grants and funding
LinkOut - more resources
Full Text Sources
Other Literature Sources