. 2019 Mar 1;11(3):207.
doi: 10.3390/v11030207.

Low Temperature and Low UV Indexes Correlated with Peaks of Influenza Virus Activity in Northern Europe during 2010⁻2018

Affiliations

Low Temperature and Low UV Indexes Correlated with Peaks of Influenza Virus Activity in Northern Europe during 2010⁻2018

Aleksandr Ianevski et al. Viruses. .

Abstract

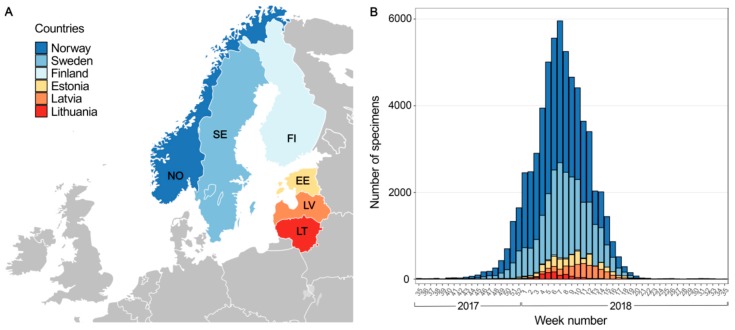
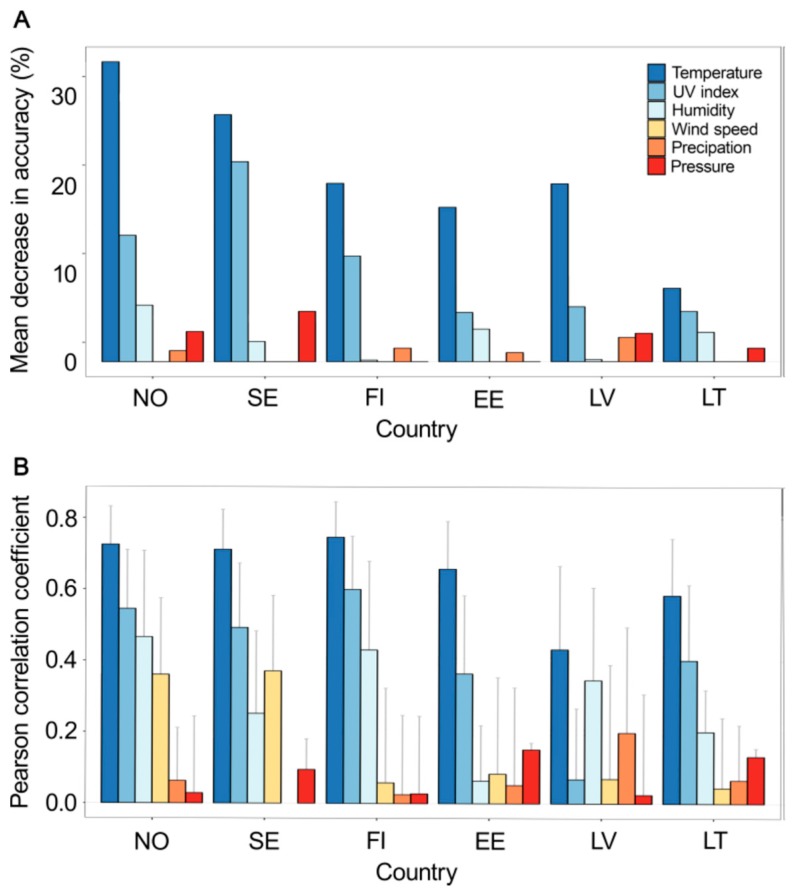
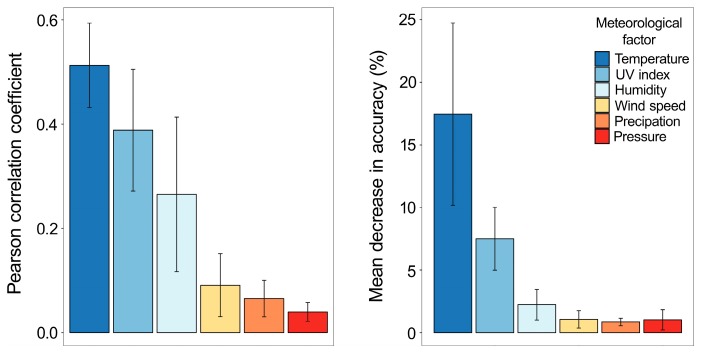
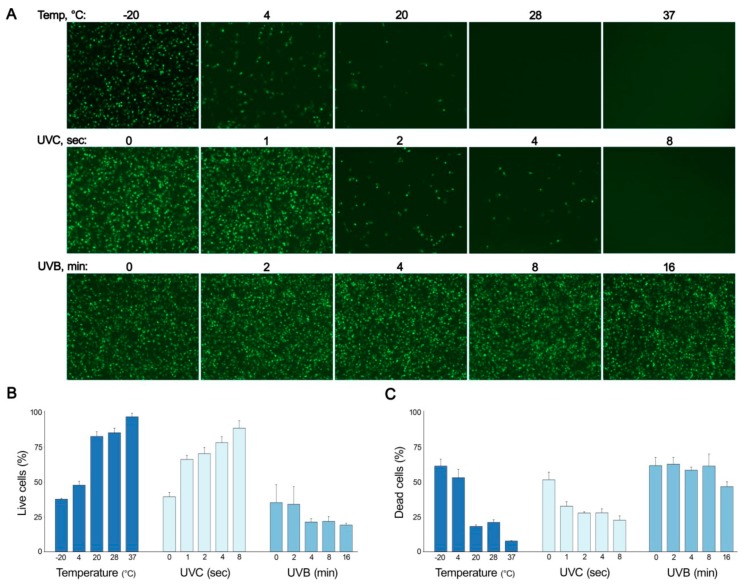
With the increasing pace of global warming, it is important to understand the role of meteorological factors in influenza virus (IV) epidemics. In this study, we investigated the impact of temperature, UV index, humidity, wind speed, atmospheric pressure, and precipitation on IV activity in Norway, Sweden, Finland, Estonia, Latvia and Lithuania during 2010⁻2018. Both correlation and machine learning analyses revealed that low temperature and UV indexes were the most predictive meteorological factors for IV epidemics in Northern Europe. Our in vitro experiments confirmed that low temperature and UV radiation preserved IV infectivity. Associations between these meteorological factors and IV activity could improve surveillance and promote development of accurate predictive models for future influenza outbreaks in the region.

Keywords: UV; epidemics; influenza; temperature; weather.


Conflict of interest statement

The authors declare no conflicts of interest.

Figures

Figure 1
Figure 1
Weekly number of detections of influenza viruses in six Northern European countries, 2017–2018. (A). Map showing six Northern European countries included in the analysis. A blank map of Europe in SVG format from Wikimedia Commons, was used as a template. (B) Stacked bar chart representing the number of influenza-positive specimens distributed across six countries between week 35 of 2017 and week 34 of 2018. Each country is shown as a bar in the same color as (A).
Figure 2
Figure 2
Association between six meteorological factors (temperature, UV index, humidity, wind speed, precipitation, and pressure) and influenza activity in six Northern Europe countries (Norway, Sweden, Finland, Estonia, Latvia and Lithuania) between week 35 of 2017 and week 34 of 2018. (A) Contribution of each meteorological factor to predictive performance of a machine learning Random Forest model trained to predict influenza activity. The contribution is measured as percentage mean decrease in accuracy (the higher the bar, the more important the factor). (B) Correlation between meteorological factors and influenza activity. Absolute values of Pearson correlation coefficient (95% confidence interval) are shown.
Figure 3
Figure 3
Association between meteorological factors (temperature, UV index, humidity, wind speed, precipitation, and pressure) and influenza activity in six Northern Europe countries averaged for the period from week 35 of 2010 and week 34 of 2017. (Left) Correlation analysis between meteorological factors and influenza activity. (Right) Contribution of each meteorological factor to predictive performance of machine-learning Random Forest models trained to predict the influenza virus (IV) activity in six Northern European countries. Contribution is measured as percentage mean decrease in accuracy (the higher the bar, the more important the feature is). Both metrics are averaged for the period from 2010 to 2017 epidemic seasons. Each error bar shows a 95% confidence interval for the mean of six countries (n = 6).
Figure 4
Figure 4
Effect of temperature and UV radiation on infectivity of GFP-encoding influenza A virus (PR8-GFP). (A) PR8-GFP was incubated at indicated temperatures for 48 h or exposed to UVB or UVC radiation for the indicated times. Human telomerase reverse transcriptase-immortalized retinal pigment (RPE) cells were subsequently infected with the virus. GFP expression was visualized using fluorescent microscopy. The size of each image corresponds to 1000 × 1250 μM2. (B) Viruses were obtained and RPE cells were infected as for (A). Viability of cells were measured using Cell Titer Glow assay. Mean ± SD, n = 3. (C) Viruses were obtained and RPE cells were infected as for panel A. Death of cells were measured using Cell Tox Green assay. Mean ± SD, n = 3.

References

    1. Influenza. [(accessed on 10 October 2018)]; Available online: http://www.who.int/influenza/en/
    1. Types of Influenza Viruses. [(accessed on 10 October 2018)]; Available online: https://www.cdc.gov/flu/about/viruses/types.htm.
    1. Iuliano A.D., Roguski K.M., Chang H.H., Muscatello D.J., Palekar R., Tempia S., Cohen C., Gran J.M., Schanzer D., Cowling B.J., et al. Estimates of global seasonal influenza-associated respiratory mortality: A modelling study. Lancet. 2018;391:1285–1300. doi: 10.1016/S0140-6736(17)33293-2. - DOI - PMC - PubMed
    1. Kash J.C., Taubenberger J.K. The role of viral, host, and secondary bacterial factors in influenza pathogenesis. Am. J. Pathol. 2015;185:1528–1536. doi: 10.1016/j.ajpath.2014.08.030. - DOI - PMC - PubMed
    1. Sooryanarain H., Elankumaran S. Environmental role in influenza virus outbreaks. Annu. Rev. Anim. Biosci. 2015;3:347–373. doi: 10.1146/annurev-animal-022114-111017. - DOI - PubMed

Publication types