. 2019 Mar 2;9(3):41.
doi: 10.3390/metabo9030041.

Characterization of Yak Common Biofluids Metabolome by Means of Proton Nuclear Magnetic Resonance Spectroscopy

Affiliations

Characterization of Yak Common Biofluids Metabolome by Means of Proton Nuclear Magnetic Resonance Spectroscopy

Chenglin Zhu et al. Metabolites. .

Abstract

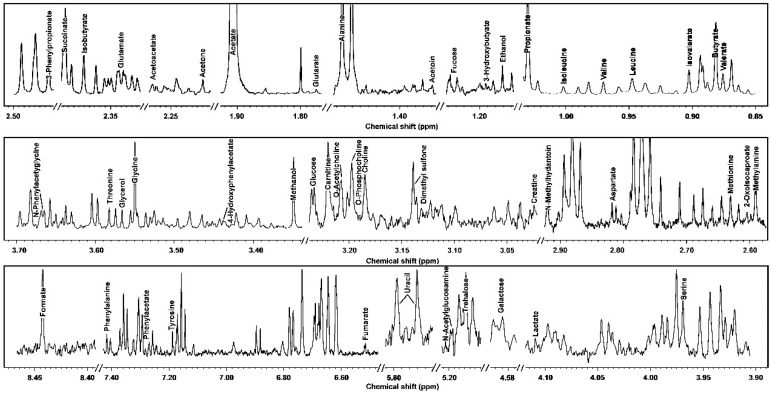
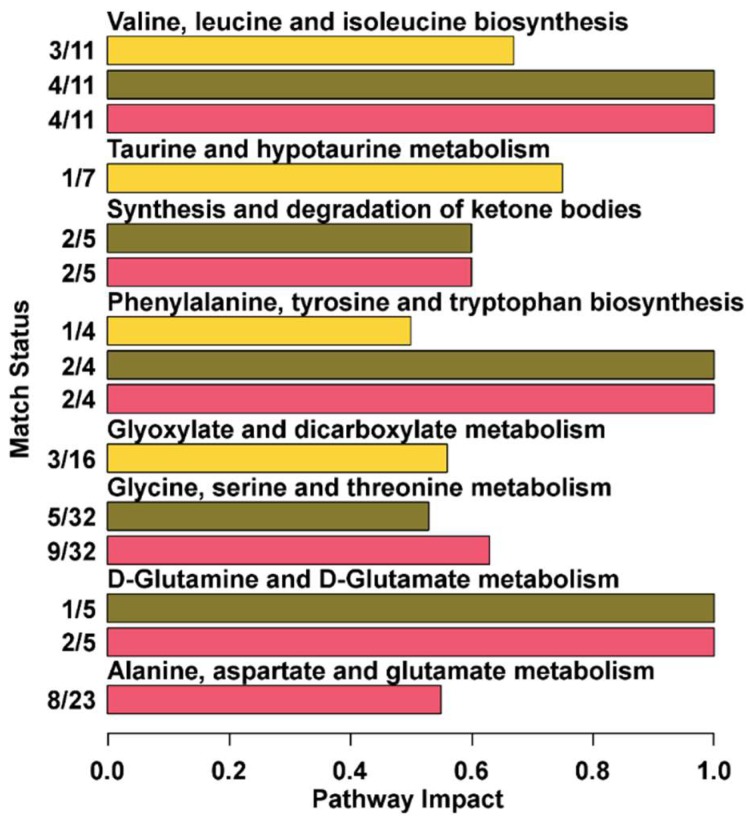
The aim of this study was to evaluate the metabolic profiles of yak (Bos grunniens) serum, feces, and urine by using proton nuclear magnetic resonance (¹H-NMR), to serve as a reference guide for the healthy yak milieu. A total of 108 metabolites, giving information about diet, protein digestion, and energy generation or gut-microbial co-metabolism, were assigned across the three biological matrices. A core metabolome of 15 metabolites was ubiquitous across all biofluids. Lactate, acetate, and creatinine could be regarded as the most abundant metabolites in the metabolome of serum, feces, and urine, respectively. Metabolic pathway analysis showed that the molecules identified could be able to give thorough information about four main metabolic pathways, namely valine, leucine, and isoleucine biosynthesis; phenylalanine, tyrosine, and tryptophan biosynthesis; glutamine and glutamate metabolism; and taurine and hypotaurine metabolism.

Keywords: 1H-NMR; Bos grunniens; feces; metabolomics; serum; urine; yak.


Conflict of interest statement

The authors declare no conflict of interest.

Figures

Figure 1
Figure 1
1H-NMR signals from yak serum, representative of those registered in the present work. The name of each molecule appears over the signal used for its quantification. To ease the reader’s visual inspection, for each portion the spectrum with a convenient signal-to-noise ratio has been selected.
Figure 2
Figure 2
1H-NMR signals from yak feces, representative of those registered in the present work. The name of each molecule appears over the signal used for its quantification. To ease the reader’s visual inspection, for each portion the spectrum with a convenient signal-to-noise ratio has been selected.
Figure 3
Figure 3
1H-NMR signals from yak urine, representative of those registered in the present work. The name of each molecule appears over the signal used for its quantification. To ease the reader’s visual inspection, for each portion the spectrum with a convenient signal-to-noise ratio has been selected.
Figure 4
Figure 4
Venn diagram showing unique and shared metabolites among yak serum, urine, and feces. The number of metabolites is listed in each of the diagram components.
Figure 5
Figure 5
The relative abundance of the classes of molecules assigned in serum, feces, and urine metabolome. As a reference, the lines inside the bars are written in 10% steps. C = carbohydrates and derivatives, O = organic acids and derivatives, A = amino acids, peptides, and derivatives, N = nucleosides, nucleotides, and analogs, M = miscellaneous.
Figure 6
Figure 6
Metabolic pathways evidenced by enrichment analysis based on the metabolites detected in serum, feces, and urine (impact value > 0.5 [27]).

Similar articles

Cited by

References

    1. Nicholson J.K., Lindon J.C., Holmes E. “Metabonomics”: understanding the metabolic responses of living systems to pathophysiological stimuli via multivariate statistical analysis of biological NMR spectroscopic data. Xenobiotica. 1999;29:1181–1189. doi: 10.1080/004982599238047. - DOI - PubMed
    1. Laghi L., Zhu C., Campagna G., Rossi G., Bazzano M., Laus F. Probiotic Supplementation in Trained Trotter Horses: Effect on Blood Clinical Pathology Data and Urine Metabolomic Assessed in Field. J. Appl. Physiol. 2018;125:654–660. doi: 10.1152/japplphysiol.01131.2017. - DOI - PMC - PubMed
    1. Zhu C., Faillace V., Laus F., Bazzano M., Laghi L. Characterization of trotter horses urine metabolome by means of proton nuclear magnetic resonance spectroscopy. Metabolomics. 2018;14:106. doi: 10.1007/s11306-018-1403-3. - DOI - PubMed
    1. Chen Y., Wu J., Tu L., Xiong X., Hu X., Huang J., Xu Z., Zhang X., Hu C., Hu X., et al. 1H-NMR Spectroscopy Revealed Mycobacterium tuberculosis Caused Abnormal Serum Metabolic Profile of Cattle. PLoS One. 2013;8:e74507. doi: 10.1371/journal.pone.0074507. - DOI - PMC - PubMed
    1. Sun Y., Xu C., Li C., Xia C., Xu C., Wu L., Zhang H. Characterization of the serum metabolic profile of dairy cows with milk fever using 1H-NMR spectroscopy. Vet. Q. 2014;34:159–163. doi: 10.1080/01652176.2014.924642. - DOI - PubMed