. 2019 Mar 2;19(5):1074.
doi: 10.3390/s19051074.

On-Line Laser Triangulation Scanner for Wood Logs Surface Geometry Measurement

Affiliations

On-Line Laser Triangulation Scanner for Wood Logs Surface Geometry Measurement

Piotr Siekański et al. Sensors (Basel). .

Abstract

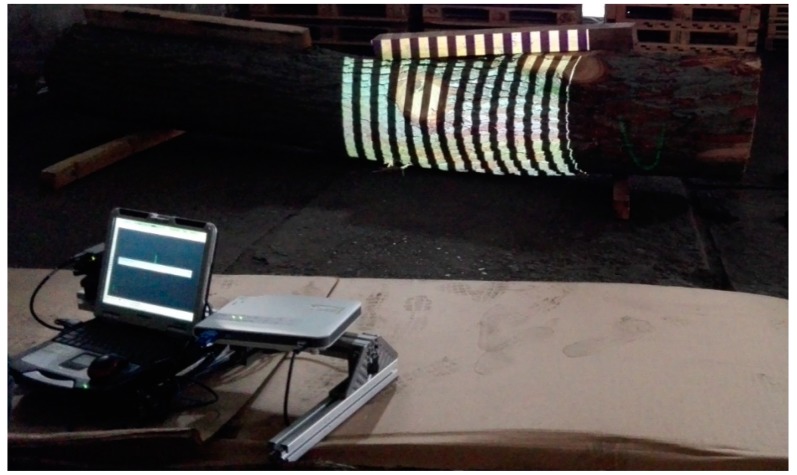
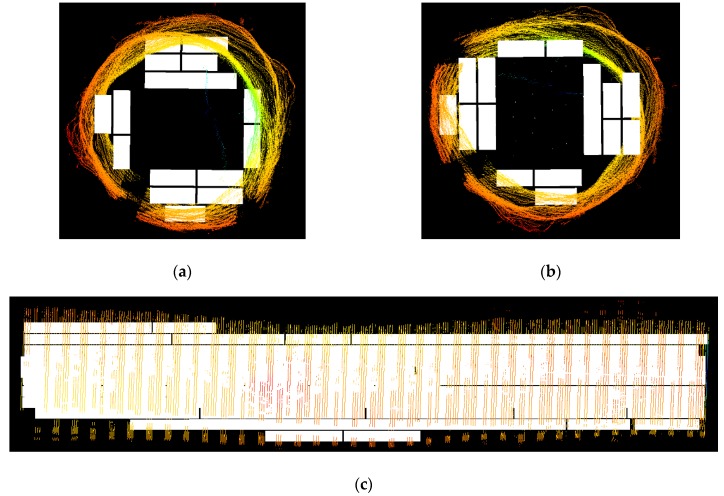
The paper presents the automated on-line system for wood logs 3D geometry scanning. The system consists of 6 laser triangulation scanners and is able to scan full wood logs which can have the diameter ranging from 250 mm to 500 mm and the length up to 4000 mm. The system was developed as a part of the BIOSTRATEG project aiming to optimize the cutting of logs in the process of wood planks manufacturing by intelligent positioning in sawmill operation. This paper illustrates the detailed description of scanner construction, full measurement process, system calibration and data processing schemes. The full 3D surface geometry of products and their applied portion of selected wood logs formed after cutting out the cant is also demonstrated.

Keywords: calibration; laser triangulation scanner; wood logs geometry measurement.


Conflict of interest statement

The authors declare no conflict of interest.

Figures

Figure 1
Figure 1
A measuring system utilizing structural lighting for examining the shape of the wood log surface.
Figure 2
Figure 2
Visualization of the laser triangulation system, with laser line projected on the object and camera capturing pictures: (a) isometric view; (b) geometry of 3D vision system.
Figure 3
Figure 3
Operating scheme of time of flight (ToF) systems.
Figure 4
Figure 4
Operating principle of the SfM method—multiple images of the object captured from different angles.
Figure 5
Figure 5
3D model of the laser triangulation scanner with measuring heads marked.
Figure 6
Figure 6
A construction of measurement head, the major components (laser, camera, mirrors) are mounted on a frame made from aluminum profiles.
Figure 7
Figure 7
Log scanning system. In the picture the following elements of the system can be seen: scanned log placed on the conveyor, laser triangulation scanner, part of the log marking system, computer controlling the scanning process.
Figure 8
Figure 8
An exemplary image of the calibration pattern: (a) raw image; (b) image with extracted centers of the circles used to calibrate the camera.
Figure 9
Figure 9
An exemplary image of a calibration pattern: (a) raw image; (b) image after switching on the laser.
Figure 10
Figure 10
Hexagonal calibration artifact: (a) sample view; (b) detected markers on the artifact seen by the camera despite the reflections. Correctly detected markers are surrounded in green and calibration points (detected chessboard corners) are marked as blue squares.
Figure 11
Figure 11
A symbolic representation of the calibration pattern and the determined positions of the cameras (red—determined directly through the image analysis; blue—after correcting the x-axis position). Each side of the calibration pattern is drawn in different color. The points represent the internal corners of each chessboard used in the global calibration procedure.
Figure 12
Figure 12
Exemplary effects of composing point clouds from different measuring heads. Data from different systems are marked with colors: (a) side view; (b) front view. Parts of magenta and yellow clouds are missing because they were occluded by the conveyor during measurement.
Figure 13
Figure 13
Flowchart of the data processing algorithm.
Figure 14
Figure 14
Visualization of the differences between the proposed scanner and the reference measurement on the example of a steel tube. The bottom of the tube was occluded during measurement.
Figure 15
Figure 15
A view from the measurement head located at the bottom during the global calibration procedure. Some of the fields are occluded by the conveyor and therefore camera pose is estimated from a reduced set of chessboard corners and may be estimated sub-optimally.
Figure 16
Figure 16
The close-up on the calibration pattern. A huge amount of noise is noticeable.
Figure 17
Figure 17
Sample log with the products fitted to the side parts of the log formed after cutting out the square cant. Simplified geometry of the log is drawn in colors ranging from green to red, depending on distance to the center axis of the log. Products are marked in white; (a,b): frontal views; (c,d): side views of the log.
Figure 17
Figure 17
Sample log with the products fitted to the side parts of the log formed after cutting out the square cant. Simplified geometry of the log is drawn in colors ranging from green to red, depending on distance to the center axis of the log. Products are marked in white; (a,b): frontal views; (c,d): side views of the log.

References

    1. Janak K. Differences in round wood measurements using electronic 2D and 3D systems and standard manual method. Drv. Ind. Znan. Časopis Pitanja Drv. Tehnol. 2007;58:127–133.
    1. Janák K. Advanced Topics in Measurements. InTech; Rijeka, Croatia: 2012. Round Wood Measurement System; pp. 103–130.
    1. JoeScan JoeScan Scanners. [(accessed on 16 February 2019)]; Available online: https://www.joescan.com/products/scanners/
    1. Hermary Full Length Log Scanning. [(accessed on 16 February 2019)]; Available online: https://www.hermary.com/applications/wood-industry/full-length-log-scanning.
    1. Porter Engineering Ltd. RT3 System. [(accessed on 16 February 2019)]; Available online: https://portereng.com/primary-breakdown/

LinkOut - more resources