

Architectures and accuracy of artificial neural network for disease classification from omics data
- PMID: 30832569
- PMCID: PMC6399893
- DOI: 10.1186/s12864-019-5546-z
Architectures and accuracy of artificial neural network for disease classification from omics data
Abstract
Background: Deep learning has made tremendous successes in numerous artificial intelligence applications and is unsurprisingly penetrating into various biomedical domains. High-throughput omics data in the form of molecular profile matrices, such as transcriptomes and metabolomes, have long existed as a valuable resource for facilitating diagnosis of patient statuses/stages. It is timely imperative to compare deep learning neural networks against classical machine learning methods in the setting of matrix-formed omics data in terms of classification accuracy and robustness.
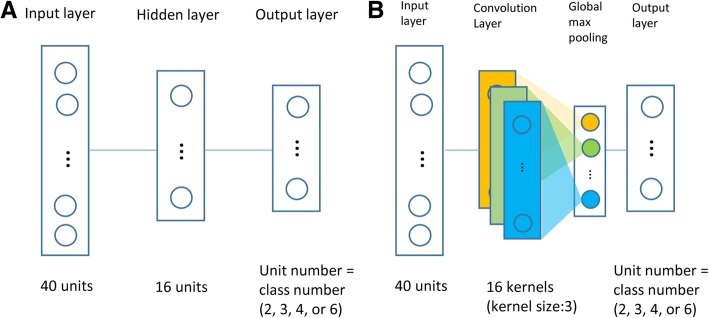
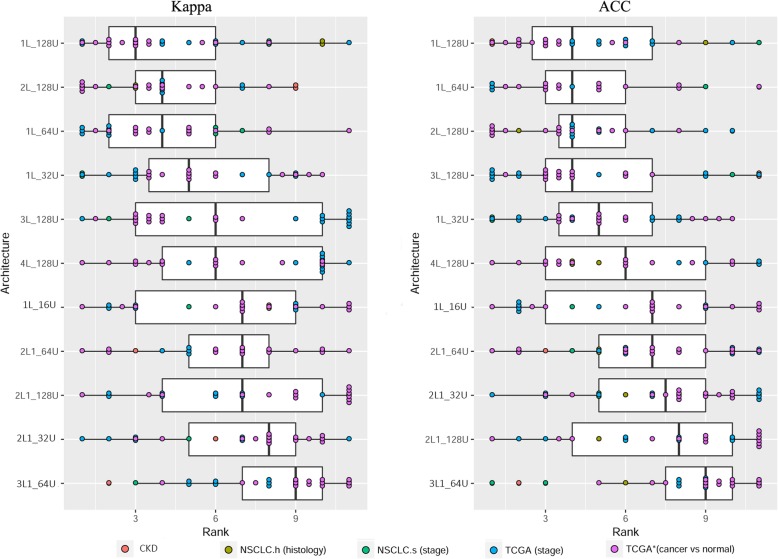
Results: Using 37 high throughput omics datasets, covering transcriptomes and metabolomes, we evaluated the classification power of deep learning compared to traditional machine learning methods. Representative deep learning methods, Multi-Layer Perceptrons (MLP) and Convolutional Neural Networks (CNN), were deployed and explored in seeking optimal architectures for the best classification performance. Together with five classical supervised classification methods (Linear Discriminant Analysis, Multinomial Logistic Regression, Naïve Bayes, Random Forest, Support Vector Machine), MLP and CNN were comparatively tested on the 37 datasets to predict disease stages or to discriminate diseased samples from normal samples. MLPs achieved the highest overall accuracy among all methods tested. More thorough analyses revealed that single hidden layer MLPs with ample hidden units outperformed deeper MLPs. Furthermore, MLP was one of the most robust methods against imbalanced class composition and inaccurate class labels.
Conclusion: Our results concluded that shallow MLPs (of one or two hidden layers) with ample hidden neurons are sufficient to achieve superior and robust classification performance in exploiting numerical matrix-formed omics data for diagnosis purpose. Specific observations regarding optimal network width, class imbalance tolerance, and inaccurate labeling tolerance will inform future improvement of neural network applications on functional genomics data.
Keywords: Artificial neural network; Cancer diagnosis; Deep learning; Omics; Supervised classification.
Conflict of interest statement
Ethics approval and consent to participate
TCGA datasets and NSCLC datasets used human genomic data deposited in public repositories, so ethics approval is not applicable to these datasets. CKD metabolome data were generated in another study under consideration by a journal, and that study was approved by the Ethical Committee of Northwest University, Xi’an, China. All patients provided written informed consent form prior to entering the study.
Consent for publication
Not applicable.
Competing interests
The authors declare that they have no competing interests.
Publisher’s Note
Springer Nature remains neutral with regard to jurisdictional claims in published maps and institutional affiliations.
Figures


References
-
- Min S, Lee B, Yoon S. Deep learning in bioinformatics. Brief Bioinform. 2017;18(5):851–869. - PubMed
-
- Alipanahi B, Delong A, Weirauch MT, Frey BJ. Predicting the sequence specificities of DNA- and RNA-binding proteins by deep learning. Nat Biotechnol. 2015;33(8):831–838. - PubMed
-
- Morrow A, Shankar V, Petersohn D, Joseph A, Recht B, Yosef N. arXiv preprint arXiv:1706.00125. 2017. Convolutional Kitchen Sinks for Transcription Factor Binding Site Prediction.
-
- Lanchantin J, Singh R, Lin Z, Qi Y. arXiv preprint arXiv:1605.01133. 2016. Deep motif: Visualizing genomic sequence classifications.
MeSH terms
Grants and funding
LinkOut - more resources
Full Text Sources
Other Literature Sources
