

Importance of the Left Atrium: More Than a Bystander?
- PMID: 30832811
- PMCID: PMC6813805
- DOI: 10.1016/j.hfc.2018.12.001
Importance of the Left Atrium: More Than a Bystander?
Abstract
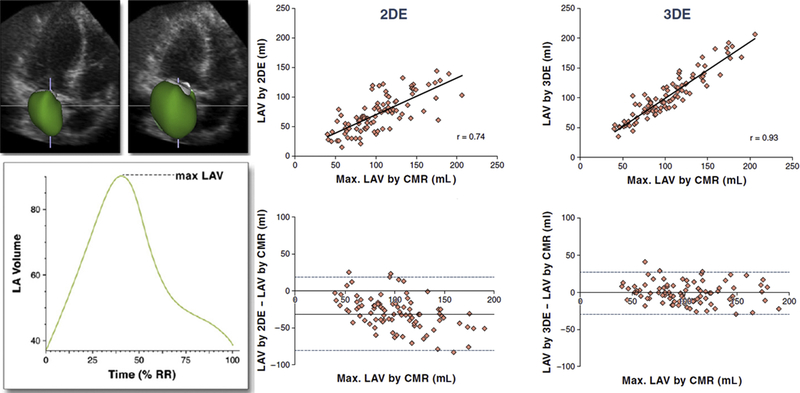
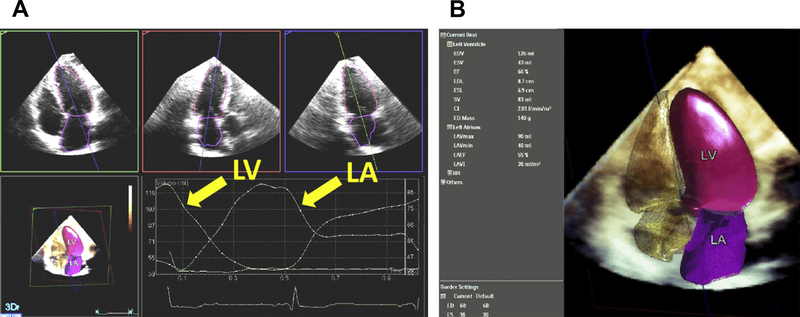
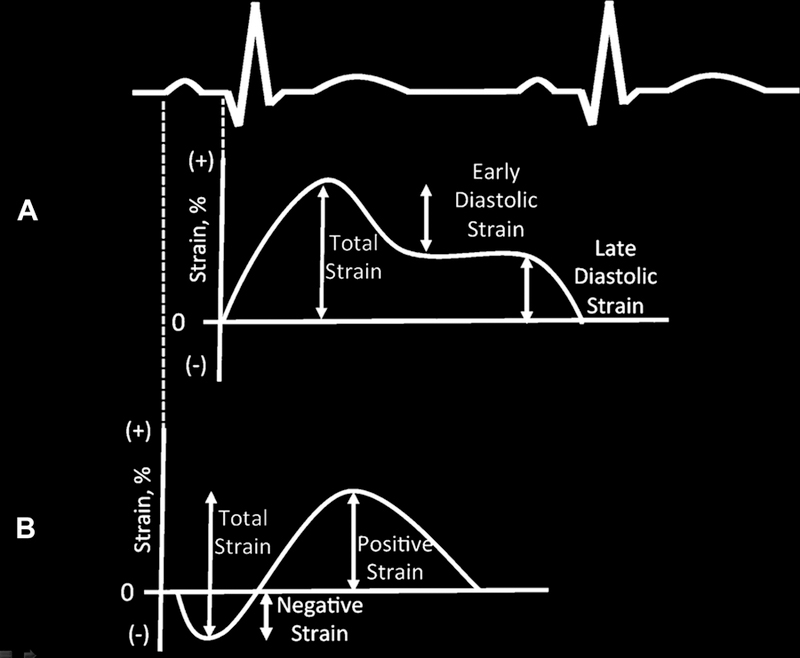
Left atrial size and function parameters are associated with adverse outcomes in multiple disease states, including heart failure with reduced and preserved ejection fraction. Recent data suggest that phasic left atrial function and left atrial stain measurements also hold prognostic information. Three-dimensional echocardiography provides more accurate and reproducible quantification of left atrial volumes than 2-dimensional echocardiography when compared with cardiac magnetic resonance reference standards. Greater accessibility to these advanced imaging techniques allows for the integration of these parameters into routine clinical practice.
Keywords: Diastolic dysfunction; Left atrial appendage; Left atrium; Strain; Three-dimensional echocardiography.
Copyright © 2018 Elsevier Inc. All rights reserved.
Figures
Similar articles
-
[The Role of the Left Atrium in the Pathogenesis of Heart Failure With Preserved Ejection Fraction].Kardiologiia. 2024 Nov 30;64(11):132-147. doi: 10.18087/cardio.2024.11.n2799. Kardiologiia. 2024. PMID: 39637398 Review. Russian.
-
Left atrial function in diabetes: does it help?Acta Diabetol. 2021 Feb;58(2):131-137. doi: 10.1007/s00592-020-01557-x. Epub 2020 Jun 9. Acta Diabetol. 2021. PMID: 32519220 Review.
-
Left Atrial Function in Preclinical Diastolic Dysfunction: Two-Dimensional Speckle-Tracking Echocardiography-Derived Results from the BEFRI Trial.J Am Soc Echocardiogr. 2016 Aug;29(8):750-758. doi: 10.1016/j.echo.2016.03.013. Epub 2016 May 4. J Am Soc Echocardiogr. 2016. PMID: 27156904
-
New echocardiographic techniques for evaluation of left atrial mechanics.Eur Heart J Cardiovasc Imaging. 2012 Dec;13(12):973-84. doi: 10.1093/ehjci/jes174. Epub 2012 Aug 21. Eur Heart J Cardiovasc Imaging. 2012. PMID: 22909795 Free PMC article. Review.
-
Left atrial dilation in patients with heart failure and preserved ejection fraction: Insights from cardiovascular magnetic resonance.Int J Cardiol. 2016 May 1;210:158-60. doi: 10.1016/j.ijcard.2016.02.101. Epub 2016 Feb 21. Int J Cardiol. 2016. PMID: 26946043 No abstract available.
Cited by
-
New echocardiographic indices of shift to biventricular failure to optimize risk stratification of chronic heart failure.ESC Heart Fail. 2022 Feb;9(1):476-485. doi: 10.1002/ehf2.13722. Epub 2021 Dec 7. ESC Heart Fail. 2022. PMID: 34874122 Free PMC article.
-
Evaluation of the left atrial function by two-dimensional speckle-tracking echocardiography in diabetic patients with obesity.Int J Cardiovasc Imaging. 2020 Apr;36(4):643-652. doi: 10.1007/s10554-020-01768-x. Epub 2020 Jan 11. Int J Cardiovasc Imaging. 2020. PMID: 31927663
-
Early cardiac involvement in patients with hyperthyroidism evaluated by cardiac magnetic resonance feature tracking.Front Endocrinol (Lausanne). 2025 Jun 2;16:1566029. doi: 10.3389/fendo.2025.1566029. eCollection 2025. Front Endocrinol (Lausanne). 2025. PMID: 40529831 Free PMC article.
-
Effect of late gadolinium enhancement on left atrial impairment in myocarditis patients.Eur Radiol. 2024 Mar;34(3):1846-1853. doi: 10.1007/s00330-023-10176-3. Epub 2023 Sep 2. Eur Radiol. 2024. PMID: 37658889 Free PMC article.
-
Standardization of normal values for cardiac chamber size in echocardiography.J Med Ultrason (2001). 2022 Jan;49(1):21-33. doi: 10.1007/s10396-021-01147-6. Epub 2021 Nov 17. J Med Ultrason (2001). 2022. PMID: 34787741 Review.
References
-
- Tsang TS, Barnes ME, Bailey KR, et al. Left atrial volume: important risk marker of incident atrial fibrillation in 1655 older men and women. Mayo Clin Proc 2001;76(5):467–75. - PubMed
-
- Yoshida C, Nakao S, Goda A, et al. Value of assessment of left atrial volume and diameter in patients with heart failure but with normal left ventricular ejection fraction and mitral flow velocity pattern. Eur J Echocardiogr 2009;10(2):278–81. - PubMed
-
- Moller JE, Hillis GS, Oh JK, et al. Left atrial volume: a powerful predictor of survival after acute myocardial infarction. Circulation 2003;107(17):2207–12. - PubMed
-
- Barnes ME, Miyasaka Y, Seward JB, et al. Left atrial volume in the prediction of first ischemic stroke in an elderly cohort without atrial fibrillation. Mayo Clin Proc 2004;79(8):1008–14. - PubMed
-
- Rossi A, Temporelli PL, Quintana M, et al. Independent relationship of left atrial size and mortality in patients with heart failure: an individual patient meta-analysis of longitudinal data (MeRGE Heart Failure). Eur J Heart Fail 2009;11(10):929–36. - PubMed
Publication types
MeSH terms
Grants and funding
LinkOut - more resources
Full Text Sources
Medical
