. 2019 Mar:41:571-583.
doi: 10.1016/j.ebiom.2019.01.060. Epub 2019 Mar 2.

Development of a multivariable gene-expression signature targeting T-cell-mediated rejection in peripheral blood of kidney transplant recipients validated in cross-sectional and longitudinal samples

Affiliations

Development of a multivariable gene-expression signature targeting T-cell-mediated rejection in peripheral blood of kidney transplant recipients validated in cross-sectional and longitudinal samples

Sofia Christakoudi et al. EBioMedicine. 2019 Mar.

Abstract

Background: Acute T-cell mediated rejection (TCMR) is usually indicated by alteration in serum-creatinine measurements when considerable transplant damage has already occurred. There is, therefore, a need for non-invasive early detection of immune signals that would precede the onset of rejection, prior to transplant damage.

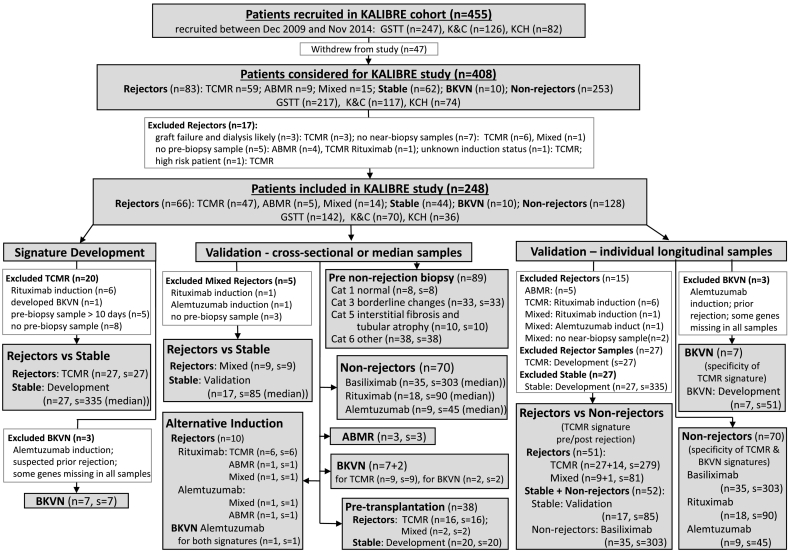
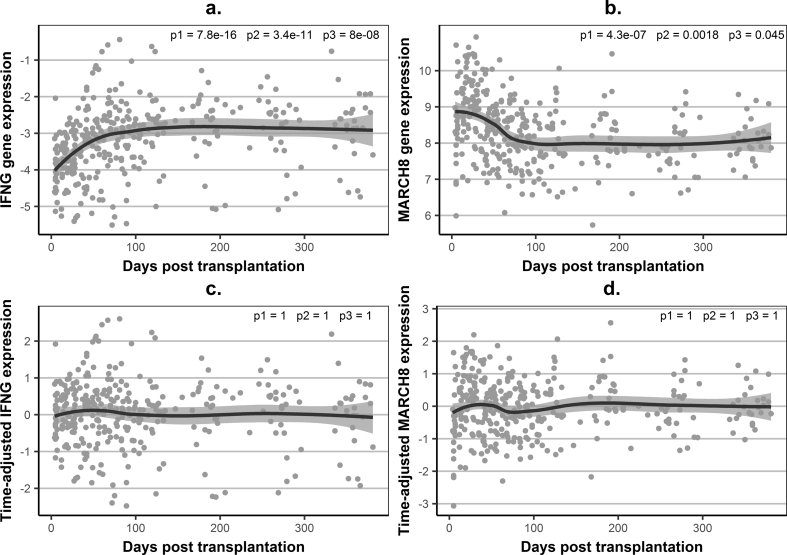
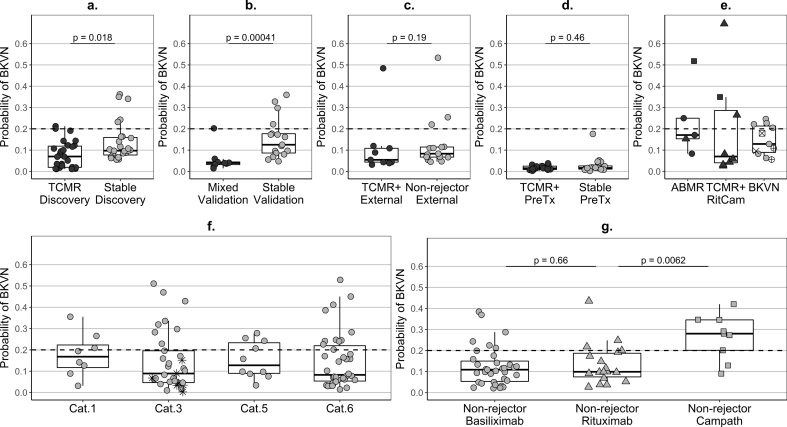
Methods: We examined the RT-qPCR expression of 22 literature-based genes in peripheral blood samples from 248 patients in the Kidney Allograft Immune Biomarkers of Rejection Episodes (KALIBRE) study. To account for post-transplantation changes unrelated to rejection, we generated time-adjusted gene-expression residuals from linear mixed-effects models in stable patients. To select genes, we used penalised logistic regression based on 27 stable patients and 27 rejectors with biopsy-proven T-cell-mediated rejection, fulfilling strict inclusion/exclusion criteria. We validated this signature in i) an independent group of stable patients and patients with concomitant T-cell and antibody-mediated-rejection, ii) patients from an independent study, iii) cross-sectional pre-biopsy samples from non-rejectors and iv) longitudinal follow-up samples covering the first post-transplant year from rejectors, non-rejectors and stable patients.

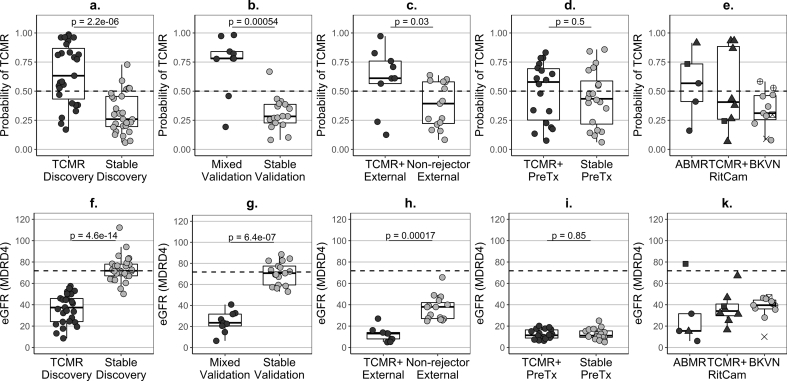
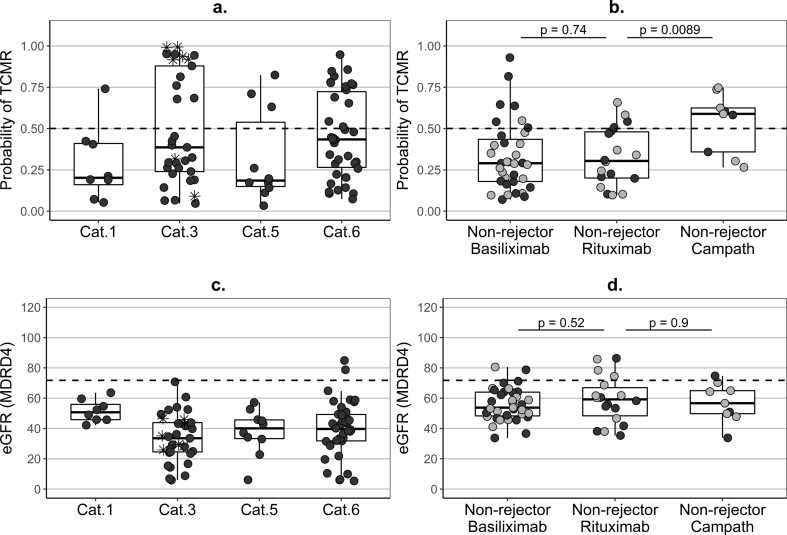
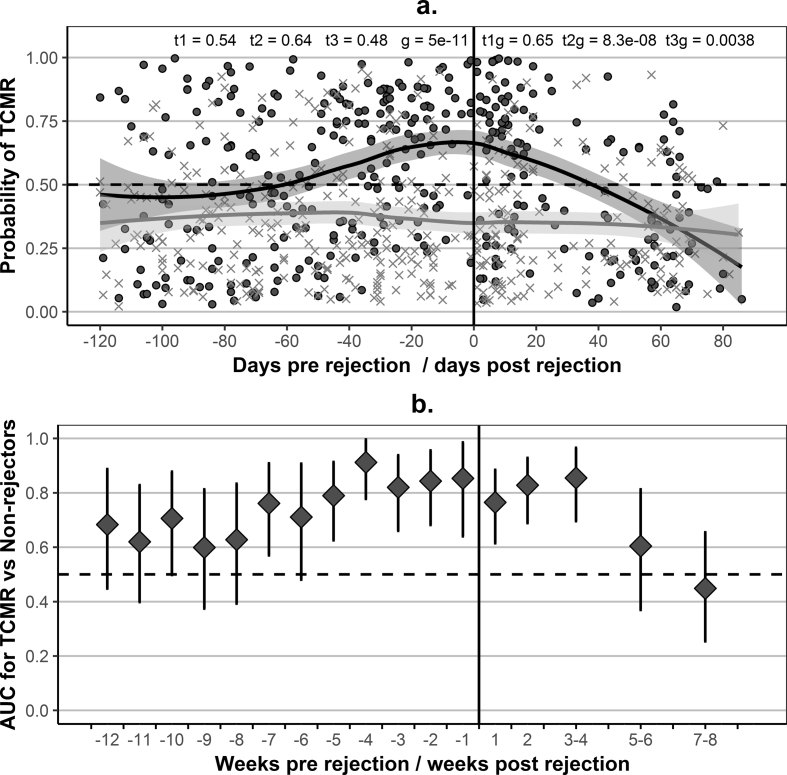
Findings: A parsimonious TCMR-signature (IFNG, IP-10, ITGA4, MARCH8, RORc, SEMA7A, WDR40A) showed cross-validated area-under-ROC curve 0.84 (0.77-0.88) (median, 2.5th-97.5th centile of fifty cross-validation cycles), sensitivity 0.67 (0.59-0.74) and specificity 0.85 (0.75-0.89). The estimated probability of TCMR increased seven weeks prior to the diagnostic biopsy and decreased after treatment. Gene expression in all patients showed pronounced variability, with up to 24% of the longitudinal samples in stable patients being TCMR-signature positive. In patients with borderline changes, up to 40% of pre-biopsy samples were TCMR-signature positive.

Interpretation: Molecular marker alterations in blood emerge well ahead of the time of clinically overt TCMR. Monitoring a TCMR-signature in peripheral blood could unravel T-cell-related pro-inflammatory activity and hidden immunological processes. This additional information could support clinical management decisions in cases of patients with stable but poor kidney function or with inconclusive biopsy results.


Figures

Fig. 1
Fig. 1
Flow diagram of patients from the KALIBRE study. Biopsy categories were defined according to Banff ‘09 classification: GSTT – Guy's and St Thomas' NHS Foundation Trust (London, UK); KCH – King's College Hospital NHS Foundation Trust (London, UK); K&C – East Kent Hospitals University NHS Foundation Trust (Canterbury, UK); Cat – Banff category; ABMR – antibody-mediated rejection (category 2); TCMR – T-cell-mediated rejection (category 4); Mixed – histological features of both, ABMR and TCMR; BKVN – BK virus nephropathy (confirmed with a specialised histological staining); unless specifically indicated, patients received Basiliximab induction; Inclusion and exclusion criteria for patients in categories Rejector, Stable and BKVN for the discovery dataset are listed in Table 1; n – number of patients; s – number of samples; median – the median predicted probability from all samples of the same stable patient was used as representative for each stable patient in the signature development and cross-sectional validation.
Fig. 2
Fig. 2
Examples of association between gene-expression levels and time in stable patients. (a) – observed (unadjusted) –ΔCt values for IFNG, as an example of a gene with increasing expression levels; (b) – observed (unadjusted) –ΔCt values for MARCH8, as an example of a gene with decreasing expression levels; (c) – time-adjusted gene-expression levels for IFNG, illustrating abolition of time-dependence for gene expression; (d) – time-adjusted gene-expression levels for MARCH8; Gene expression – observed ΔCt values, relative to hypoxanthine phosphoribosyltransferase (HPRT), in individual samples (grey dots) and a loess average curve with 95% confidence interval; Time-adjusted gene expression – fold difference on log2 scale (same scale as gene expression), derived as the difference between the observed –ΔCt values and the predicted values using generalised linear mixed-effects models (GLMM) linear regression, based on all serial samples (total n = 335) from the training stable kidney transplant recipients (n = 27) (a cubic relationship between gene expression and time post transplantation was modelled for the fixed and random effects); p1, p2, p3 - p-values for the linear, quadratic and cubic fixed-effects terms for time in GLMM (in (a) and (b) GLMM was based on the observed –ΔCt values and the p-values confirm a statistically significant association between gene-expression and time, in (c) and (d) GLMM was based on time-adjusted gene expression values and p-values demonstrate the time-independence of the time-adjusted gene-expression levels).
Fig. 3
Fig. 3
Predicted probability of TCMR and kidney function in rejectors and stable or non-rejector controls and in patients with BK virus nephropathy. a – median of the set of probabilities of T-cell-mediated rejection (TCMR) estimated for each patient of the development dataset in the 50 repeats of the cross-validation cycles (Step 12 of Note 1 in Supplementary Discussion); (b–e) – predicted probability of TCMR, based on the newly-developed seven-gene signature (Supplementary Fig. S5); (f–k) – estimated glomerular filtration rate (eGFR), based on the MDRD4 equation; ABMR – antibody-mediated rejection (category 2 according to Banff’09 classification); TCMR – T-cell-mediated rejection (category 4); Mixed – histological features of both, ABMR and TCMR; TCMR+ – patients with TCMR alone and with mixed-type histology; BKVN – BK virus nephropathy (confirmed with a specialised histological staining); Stable – patients fulfilling the inclusion and exclusion criteria listed in Table 1; Non-rejector – patient not fulfilling the selection criteria in Table 1 but without evidence of TCMR, ABMR or BKVN up to day 400 post-transplantation; dot colour: black – rejectors, grey – stable or non-rejector patients; dot shape – induction agent in KALIBRE patients: circle – Basiliximab, triangle – Rituximab, square – Alemtuzumab; dotted lines – cut-off 0·5 for dichotomous classification of the probability of TCMR (a-e) and median eGFR (71.8 mL/min/1.73m2) of the summary of stable patients in the discovery signature-development dataset (F—K); samples: rejectors – single pre-biopsy sample, BKVN – single near-biopsy sample, stable/non-rejector patients – summary (median per patient) of longitudinal samples covering between days four and 400 post transplantation; Discovery (a,f) – training patients used in TCMR signature development (TCMR (n = 27) fulfilling the inclusion and exclusion criteria listed in Table 1 and stable patients (n = 27)); Validation (b,g) – test patients from the KALIBRE study used for TCMR signature validation (Mixed-type rejectors (n = 9) and new stable patients (n = 17)); External (c,h) – patients from the independent trial EMPIRIKAL used for TSMR signature validation (rejectors (n = 9) with TCMR or Mixed-type histology, non-rejectors (n = 15)); PreTx (d,i) – cross-sectional pre-transplantation samples – one per patient from rejectors with TCMR (n = 16) and Mixed-type (n = 2) histology and training stable patients from the signature development dataset (n = 20)); e,hABMR rejectors (n = 5), RitCam rejectors with alternative induction and TCMR (n = 6) or Mixed-type histology (n = 2); BKVN patients: grey dots BKVN (n = 7) included in the BKVN signature development dataset, crossed dots BKVN: +dot (n = 2) excluded from the training dataset due to prior suspected TCMR or some genes missing, x-dot (n = 1) Alemtuzumab induction, x (n = 1) patient from the EMPIRICAL trial; p-values derived from a Wilcoxon-Mann-Whitney tests.
Fig. 4
Fig. 4
Predicted probability of TCMR and kidney function in non-rejectors. (a–b) – predicted probability of T-cell-mediated rejection (TCMR), based on the newly-developed seven-gene signature (Supplementary Fig. S5); (c–d) – estimated glomerular filtration rate (eGFR), based on the MDRD4 equation; (a,c) – cross-sectional pre-biopsy samples (up to 15 days prior to the first post-transplantation biopsy (median two days) and a single one at 25 days) from patients which did not show features of rejection at least up to three months post biopsy; Cat – histological category according to Banff’09 classification (Cat.1 – normal (n = 8, one (13%) TCMR-positive), Cat.3 – borderline changes (n = 33, 13 (39%) TCMR-positive), Cat.5 – interstitial fibrosis and tubular atrophy (n = 10, three (30%) TCMR-positive), Cat.6 – other non-rejection histology (n = 38, 14 (37%) TCMR-positive)); star dots (*) – patients with histological features of borderline changes treated for rejection due to clinical considerations; (b,d)– summary of longitudinal validation follow-up samples covering one year post transplantation (median per patient) in non-rejectors with different induction agents (not fulfilling the strict inclusion/exclusion criteria set for stable patients in Table 1, but without clinical or histological evidence of rejection up to day 400 post tansplantation): Basiliximab induction (n = 35, 18 with biopsy, seven (20%) TCMR-positive median), Rituximab (n = 18, nine with biopsy, four (22%) TCMR-positive median), Alemtuzumab (n = 9, three with biopsy, six (67%) TCMR-positive median); black dots – non-rejection biopsy during the first post-transplant year; grey dots – no biopsy; dotted lines – cut-off 0·5 for dichotomous classification of the probability of TCMR (a,b) and median eGFR (71.8 mL/min/1.73m2) (c,d) from the summary samples of the stable patients in the discovery signature-development data; p-values derived from a Wilcoxon-Mann-Whitney tests.
Fig. 5
Fig. 5
Longitudinal evaluation of the gene-expression signature of TCMR with respect to the diagnostic biopsy. (a) – Evolution of the predicted probability of T-cell-mediated rejection (TCMR), based on the seven-gene signature of TCMR (Supplementary Fig. S5), with time pre and post rejection: individual samples and average loess trajectories for patient groups; Black dots – longitudinal samples from patients with TCMR: 279 samples from 41 patients (the 27 samples contributing to the signature-development dataset were excluded) and 81 samples from 10 patients with mixed-type rejection (antibody-mediated rejection (ABMR) and TCMR); Grey * – longitudinal samples from the 17 (test) stable patients included in the validation dataset (85 samples) (fulfilling the inclusion/exclusion criteria in Table 1) and the 35 non-rejectors with Basiliximab induction (303 samples) included in the validation dataset; Vertical line (zero days) – reference point; Reference point (time 0) – for rejectors, the day of the diagnostic biopsy (222 samples pre-biopsy (164 from TCMR and 58 from patients with mixed-type rejection) and 138 post rejection (115 TCMR, 23 mixed-type)); for stable patients and non-rejectors time was assigned at random, such that the samples were distributed along the timeline proportional to the number of samples from rejectors in the given week-wide time window, as well as proportional to the contribution of training and validation stable patients, and ensuring that a single sample per patient was included in each week-wide window (240 samples before (189 non-rejectors, 51 stable) and 148 after the reference point (114 non-rejectors, 34 stable)); samples from stable patients covered the period between days 4 and 400 post transplantation; t1, t2 and t3 – p-values for the linear, quadratic and cubic terms for time in a generalised linear mixed-effects model (GLMM) (linear regression) based on log-odds of TCMR as an outcome and including fixed and random effects for time, a group term (stable patients as baseline), and interaction terms between time and group; g – p-value for the group term in GLMM; t1g, t2g, and t3g – p-values for the interaction terms in GLMM; (b) – classification performance of the gene-expression signature of TCMR for weekly intervals (from 12 weeks pre to two weeks post rejection) or fortnightly intervals (from three to eight weeks post rejection), time limited to 120 days pre and 90 days post rejection; Diamonds – area under the receiver operating characteristics curve (AUC) for a comparison between unique samples per patient in each window (8 to 29 samples per window for rejectors (median 14, using 170 pre and 101 post-rejection samples) and 9 to 31 samples per window for stable patients and non-rejectors (median 13, using 184 samples assigned at random to pre and 109 samples assigned to post reference point, as described in A); Error bars – 95% DeLong confidence intervals for AUC.
Fig. 6
Fig. 6
Predicted probability of BK-virus nephropathy in kidney transplant recipients. Predicted probability(a,e) calculated as the median of the set of probabilities estimated for each patient of the development dataset in the 50 repeats of the cross-validation cycles (Step 12 of Note 1 in Supplementary Discussion) or (b,c,d,f,g) based on the newly-developed six-gene signature (Supplementary Fig. S11); ABMR – antibody-mediated rejection (category 2 according to Banff’09 classification); BKVN – BK virus nephropathy (confirmed with a specialised histological staining); TCMR – T-cell-mediated rejection (category 4); Mixed – histological features of both, ABMR and TCMR; TCMR+ − patients with TCMR only or with mixed-type histology; Stable – patients fulfilling the inclusion and exclusion criteria listed in Table 1; Non-rejector – patients not fulfilling the selection criteria in Table 1 but without clinical or histological evidence of TCMR, ABMR or BKVN up to day 400 post-transplantation; dot colour: black – rejectors, grey – stable or non-rejector patients; dot shape - induction agent in KALIBRE patients: circle – Basiliximab, triangle – Rituximab, square – Alemtuzumab; dotted lines - cut-off 0.2 for dichotomous classification of the probability of BKVN; samples: rejectors - single pre-biopsy sample, BKVN –single near-biopsy sample, stable/non-rejector patients – summary (median per patients) of longitudinal samples covering between days four and 400 post transplantation; (a) Discovery – training patients used in TCMR signature development (TCMR (n = 27) fulfilling the inclusion and exclusion criteria listed in Table 1 and stable patients (n = 27)); (b) Validation – test patients from the KALIBRE study used for TCMR signature validation (Mixed-type rejectors (n = 9) and new stable patients (n = 17)); (c) External – patients from the independent trial EMPIRIKAL used for TSMR signature validation (rejectors (n = 9) with TCMR or Mixed-type histology and non-rejectors (n = 15)); (d) PreTx – cross-sectional pre-transplantation samples - one per patient from rejectors with TCMR (n = 16) and Mixed-type (n = 2) histology and training stable patients from the signature development dataset (n = 20); (e) ABMR rejectors (n = 5), RitCam rejectors with alternative induction and TCMR (n = 6) or Mixed-type (n = 2) histology; BKVN patients: grey dots BKVN (n = 7) included in the BKVN signature development dataset, crossed dots BKVN: +dot (n = 2) excluded from the training dataset due to prior suspected TCMR or some genes missing, x-dot (n = 1) Alemtuzumab induction, x (n = 1) a patient from the EMPIRICAL trial; (f) – cross-sectional pre-biopsy samples (up to 15 days prior to the first post-transplantation biopsy (median two days) and a single one at 25 days) from patients which did not show features of rejection at least up to three months post biopsy; Cat – histological category according to Banff’09 classification (Cat.1 – normal (n = 8, three (38%) BKVN-positive), Cat.3 – borderline changes (n = 33, eight (24%) BKVN-positive), Cat.5 - interstitial fibrosis and tubular atrophy (n = 10, four (40%) BKVN-positive), Cat.6 – other non-rejection histology (n = 38, 11 (29%) BKVN-positive)); star dots (*) – patients with histological features of borderline changes treated for rejection due to clinical considerations; (g) – summary (median per patient) of longitudinal validation follow-up samples from non-rejectors with different induction agents: Basiliximab induction (n = 35, six (17%) BKVN-positive median), Rituximab (n = 18, four (22%) BKVN-positive), Alemtuzumab (n = 9, seven (78%) BKVN-positive median); p-values derived from a Wilcoxon-Mann-Whitney tests.

Similar articles

Cited by

References

    1. Hoffmann S.C., Hale D.A., Kleiner D.E. Functionally significant renal allograft rejection is defined by transcriptional criteria. Am J Transplant. 2005;5(3):573–581. - PubMed
    1. Suthanthiran M., Schwartz J.E., Ding R. Urinary-cell mRNA profile and acute cellular rejection in kidney allografts. N Engl J Med. 2013;369(1):20–31. - PMC - PubMed
    1. Deng M.C. The AlloMap genomic biomarker story: 10 years after. Clin Transplant. 2017;31(3) - PubMed
    1. Pan L., Lyu Z., Adam B. Polyomavirus BK nephropathy-associated transcriptomic signatures: a critical reevaluation. Transplant Direct. 2018;4(2):e339. - PMC - PubMed
    1. Bohl D.L., Brennan D.C. BK Virus Nephropathy and Kidney Transplantation. Clin J Am Soc Nephrol. 2007;2(Supplement 1):S36–S46. - PubMed

MeSH terms