. 2019 Jun:24:120-138.
doi: 10.1016/j.molmet.2019.02.005. Epub 2019 Feb 21.

Dopamine neuronal protection in the mouse Substantia nigra by GHSR is independent of electric activity

Affiliations

Dopamine neuronal protection in the mouse Substantia nigra by GHSR is independent of electric activity

Bernardo Stutz et al. Mol Metab. 2019 Jun.

Abstract

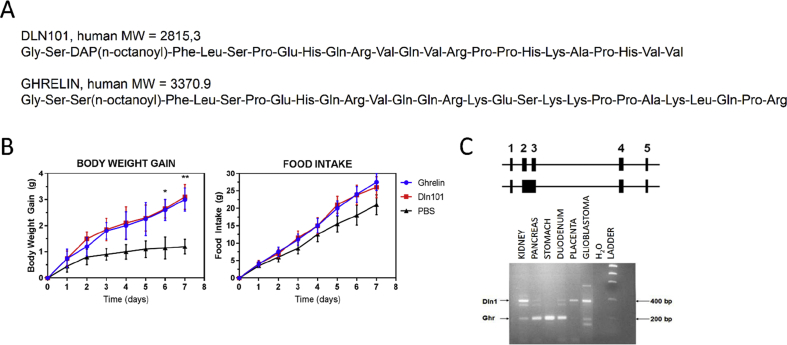
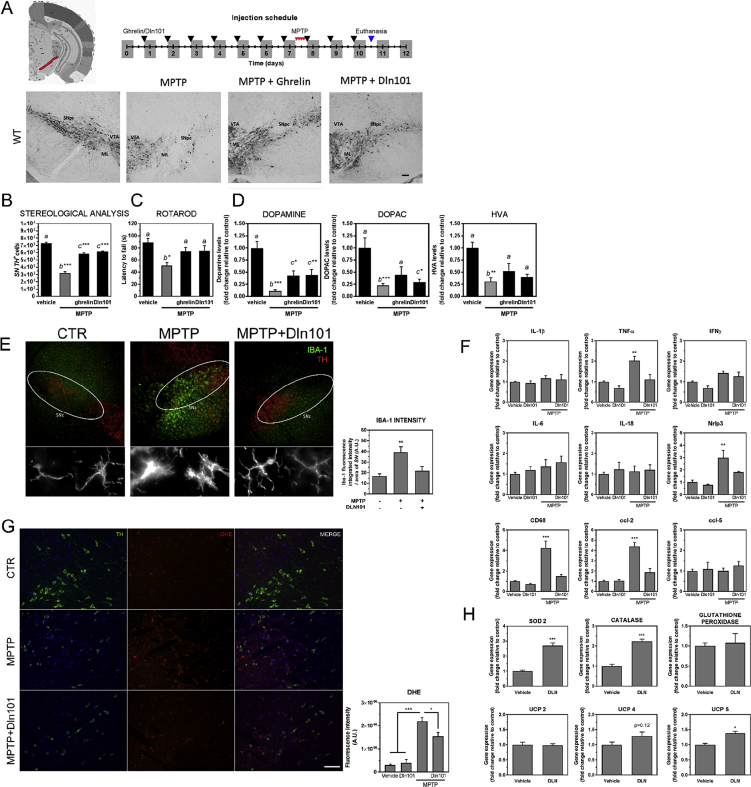
Objective: Dopamine neurons in the Substantia nigra (SN) play crucial roles in control of voluntary movement. Extensive degeneration of this neuronal population is the cause of Parkinson's disease (PD). Many factors have been linked to SN DA neuronal survival, including neuronal pacemaker activity (responsible for maintaining basal firing and DA tone) and mitochondrial function. Dln-101, a naturally occurring splice variant of the human ghrelin gene, targets the ghrelin receptor (GHSR) present in the SN DA cells. Ghrelin activation of GHSR has been shown to protect SN DA neurons against 1-methyl-4-phenyl-1,2,5,6 tetrahydropyridine (MPTP) treatment. We decided to compare the actions of Dln-101 with ghrelin and identify the mechanisms associated with neuronal survival.

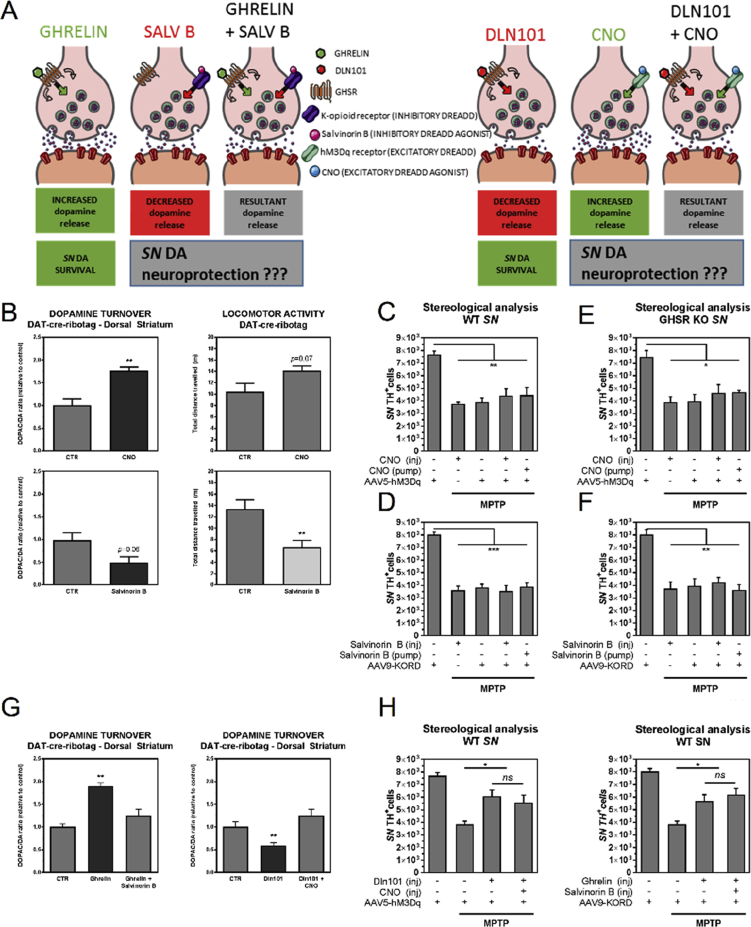
Methods: Histologial, biochemical, and behavioral parameters were used to evaluate neuroprotection. Inflammation and redox balance of SN DA cells were evaluated using histologial and real-time PCR analysis. Designer Receptors Exclusively Activated by Designer Drugs (DREADD) technology was used to modulate SN DA neuron electrical activity and associated survival. Mitochondrial dynamics in SN DA cells was evaluated using electron microscopy data.

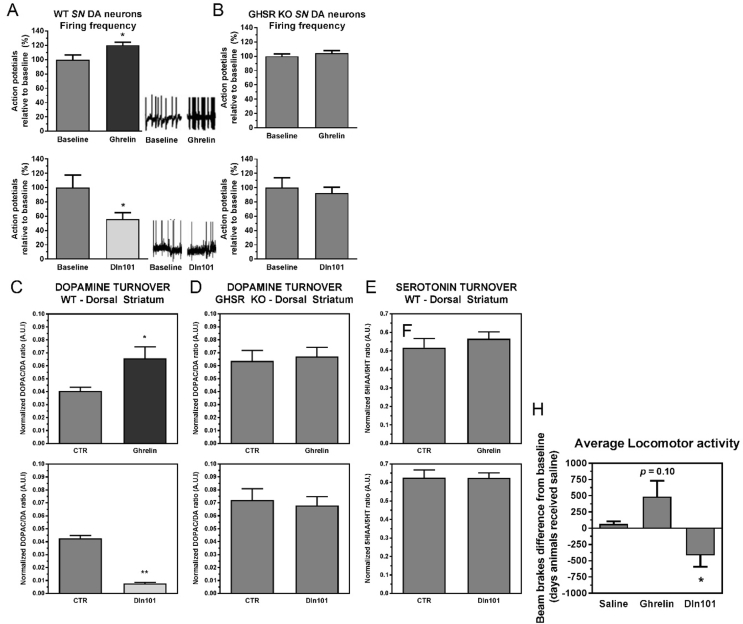
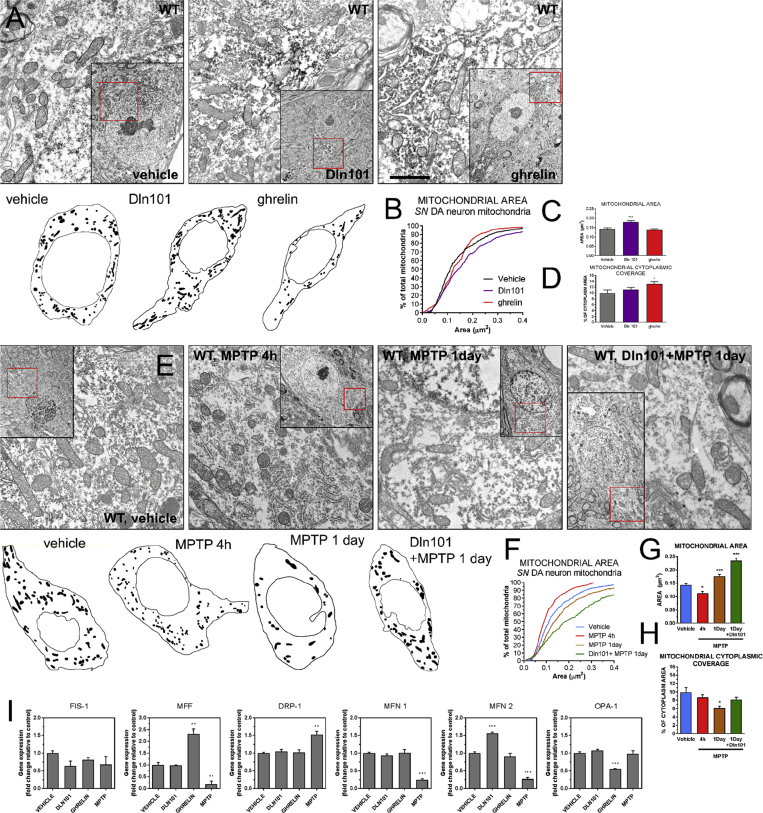
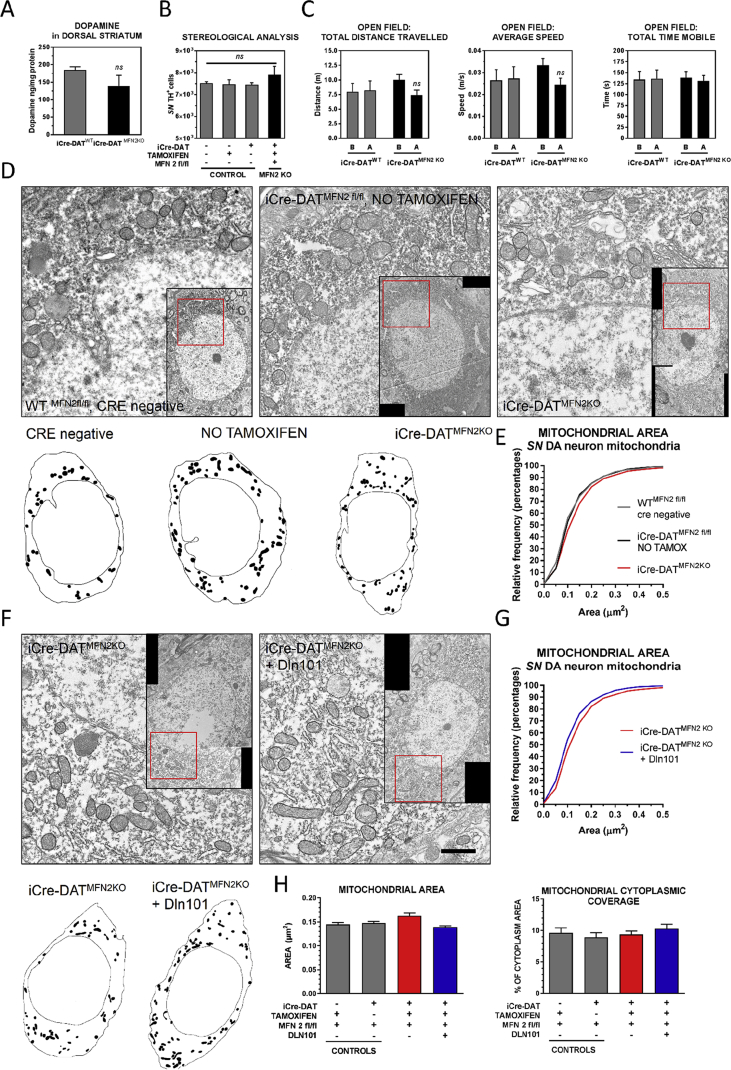
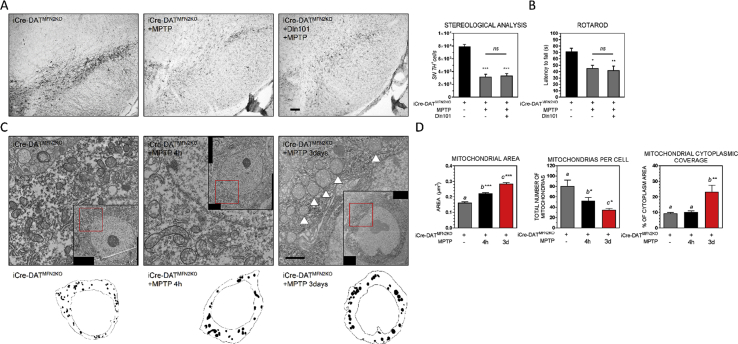
Results: Here, we report that the human isoform displays an equivalent neuroprotective factor. However, while exogenous administration of mouse ghrelin electrically activates SN DA neurons increasing dopamine output, as well as locomotion, the human isoform significantly suppressed dopamine output, with an associated decrease in animal motor behavior. Investigating the mechanisms by which GHSR mediates neuroprotection, we found that dopamine cell-selective control of electrical activity is neither sufficient nor necessary to promote SN DA neuron survival, including that associated with GHSR activation. We found that Dln101 pre-treatment diminished MPTP-induced mitochondrial aberrations in SN DA neurons and that the effect of Dln101 to protect dopamine cells was dependent on mitofusin 2, a protein involved in the process of mitochondrial fusion and tethering of the mitochondria to the endoplasmic reticulum.

Conclusions: Taken together, these observations unmasked a complex role of GHSR in dopamine neuronal protection independent on electric activity of these cells and revealed a crucial role for mitochondrial dynamics in some aspects of this process.

Keywords: Dopamine neuron; GHSR; Mitochondrial dynamics; Mitofusin 2; Parkinson's.


Figures

Figure 1
Figure 1
Dln101 is a human splice-variant of the ghrelin gene with different expression pattern but similar effects over food intake and body weight gain. (A) Dln101 and ghrelin peptide sequences. Mature peptides display homology of 57% and same acylation site in the third residue. (B) Chronic peripheral (s.c.) injection of Dln101 or ghrelin (7.2 mg/kg) had similar effects on Body Weight Gain and Food Intake in mice. Two-way ANOVA followed by multiple comparisons test; n = 8 per group. (C) Human ghrelin gene mRNA splicing and their respective expression pattern. Two splicing patterns of ghrelin mRNA. The boxes represent exons, short boxes represent untranslated sequences, and long boxes represent coding sequences. Top pattern yields mature ghrelin 117 amino acids preproghrelin, while bottom pattern yields Dln. Qualitative RT-PCR was conducted on 6 selected human samples (Stratagene: Kidney, Pancreas, Stomach, Duodenum, Placenta, and non-commercial A172 glioblastoma cell line – neural tissue). Water was used as negative control. Dln and ghrelin bands are indicated with arrows.
Figure 2
Figure 2
Neuroprotective effect of ghrelin and Dln101 in WT mice. Mice had daily s.c. administration of saline, ghrelin 15 nM, or Dln101 15 nM 15 min before the onset of dark phase for 10 consecutive days. (A) Visualization of TH+ cells in DAB immunohistological preparation. Scale bar 100 μm. Parameters from DA cells of the SN but not from VTA were analyzed. The distinction was made visually, as indicated. SNc (Substantia nigra pars compacta), VTA (Ventral Tegmental Area), ML (Medial Lemniscus). (B) Total number of TH+ cells in SN was evaluated. MPTP-treated animals, pre-treated with saline (gray bars), displayed a reduction in the number of SN DA cells when compared to controls (vehicle = 7305 ± 128; MPTP = 3222 ± 200). Animals pre-treated with either ghrelin or Dln101 displayed comparable levels of SN DA cell protection (ghrelin = 5857 ± 129, Dln101 = 6139 ± 84, TH+ cells); n = 5–10 per group. (C) Motor performance was evaluated using the rotarod test. Latency to fall from the apparatus was measured in all groups. MPTP-treated animals, pre-treated with saline (gray bars), displayed a reduction in latency to fall time when compared to controls (vehicle = 88.9 ± 6.4; MPTP = 51.0 ± 5.0, in seconds). Animals pre-treated with either ghrelin or Dln101 displayed comparable levels of motor performance, with a lower reduction in latency to fall time (ghrelin = 74.4 ± 6.4, Dln101 = 74.7 ± 9.2, in seconds); n = 5–11 per group. (D) Dopamine, DOPAC and HVA levels were evaluated in dorsal striatum by HPLC-ED; n = 5–11 per group. (E) Microglia immunostaining using IBA-1 antibody (green) and SN DA cells (TH, red) scale bar 100 μm. Inset showed in higher magnification. Scale bar 10 μm. (F) Real-time PCR analysis of proinflammatory markers in midbrain tissue; n = 4 per group. (G) DHE staining of ROS in midbrain sections. Cells co-labelled with TH (green) and the ROS probe DHE (red) were analyzed for fluorescence intensity (quantification in the graph). Scale bar 50 μm. N = 4–6 per group (H) Real-time PCR analysis of antioxidative enzymes using DAT-Ribotag immunoprecipitated midbrain mRNA. Unpaired t test n = 4 per group. All other data were analyzed using One-way ANOVA test followed by multiple comparisons test.
Figure 3
Figure 3
Effects of ghrelin and Dln101 over SN DA neuron function of GHSR KO mice and their WT littermates. (A) Using patch-clamp slice electrophysiology analysis, the firing frequency (generation of action potentials) was recorded in SN DA neurons for 15 min followed by acute ghrelin (1 μM) or Dln101 (1 μM) administration. In WT neurons, ghrelin increased (120.3% relative to baseline) neuronal activity whereas Dln101 decreased it (55.5%). (B) No effect was observed in GHSR KO animals. Paired t test; n = 4–13 per group. (C) Dopamine turnover (DOPAC/DA ratio) was evaluated by HPLC-ED 30 min after s.c. administration of saline (CTR), ghrelin 15 nM, or Dln101 15 nM. In WT mice, ghrelin promoted increased dorsal striatum dopamine release (CTR = 0.040 ± 0.002, Ghrelin = 0.066 ± 0.009, top graph). After Dln101 administration, dopamine release was reduced in dorsal striatum (CTR = 0.038 ± 0.002, Dln101 = 0.005 ± 0.001, bottom graph). Unpaired t tests, n = 4–5. (D) Dopamine release in dorsal striatum of GHSR KO animals was unaffected by ghrelin or Dln101. Unpaired t tests, n = 3–4. (E) For control purposes, serotonin turnover (5HIAA/5HT) was quantified in dorsal striatum following ghrelin or Dln101 injection and no change was observed. Unpaired t tests, n = 5–7. (F) Average locomotor activity was evaluated by infrared monitoring up to 3 h after subcutaneous administration of saline, ghrelin 15 nM, or Dln101 15 nM. Total number of beam breaks on the day of ghrelin/Dln101 administration was subtracted from total number of beam breaks from the day before, when animals received saline (baseline). Ghrelin promoted a tendency to increase average locomotor activity (p = 0.10) whereas Dln101-injected animals had the opposite effect, promoting a substantial decrease in locomotor activity. Paired t test; n = 4 per group. All other data were analyzed using unpaired t tests.
Figure 4
Figure 4
Modulation of electrical activity of SN DA neurons and its effects on survival, dopamine release in dorsal striatum, and locomotor activity in DAT-cre-ribotag mice. (A) GHSR-mediated protection of substantia nigra dopamine neurons by ghrelin or Dln101 occurs despite their opposite effects on neuronal electrical activity. To address whether modulation of electrical activity is sufficient or necessary for neuroprotection, we used DREADDs to evaluate neuroprotection in scenarios of controlled neuronal firing. (B) Dopamine turnover (DOPAC/DA ratio) and locomotor activity in DAT-cre-ribotag mice was evaluated 30–45 min after subcutaneous administration of vehicle (CTR), CNO (0.3 mg/kg) or Salvinorin B (5 mg/kg). Excitatory DREADD activation with CNO promoted elevated dopamine release in dorsal striatum in comparison to saline (CTR = 1.00 ± 0.13, CNO = 1.77 ± 0.08), n = 3. Inhibitory DREADD activation with Salvinorin B produced a tendency towards decreased dopamine release (CTR = 1.00 ± 0.47, Salvinorin B = 0.55 ± 0.16), n = 5. Animals had their locomotor activity recorded for 10 min. CNO promoted a tendency towards increased locomotor activity, while Salvinorin B decreased it (CTR = 10.87 ± 2.01, CNO = 13.62 ± 0.90) and (CTR = 13.37 ± 1.61, Salvinorin B = 6.67 ± 1.17). Unpaired t test; n = 3–10 per group. (C) Total number of TH+ cells in SN was evaluated in WT animals with expression of excitatory DREADD. CNO (0.3 mg/kg) was injected daily using the same routine used for ghrelin and Dln101 administration, or chronically released using osmotic minipump placed in the interscapular space. MPTP administration promoted vast nigral degeneration that was not prevented by the excitatory DREADD agonist, in any of the delivery formats. (D) Total number of TH+ cells in SN was evaluated in WT animals with expression of inhibitory DREADD. Salvinorin B (5 mg/kg) was injected or chronic released using osmotic minipump. (E) Total number of TH+ cells in SN was evaluated in GHSR KO animals with expression of excitatory DREADD. (F) Total number of TH+ cells in SN was evaluated in GHSR KO animals with expression of inhibitory DREADD. (G) Ghrelin-induced increase in dopamine release in dorsal striatum was prevented with injection of Salvinorin B in animals with expression of inhibitory DREADD. Likewise, Dln101-induced decrease in dopamine release in dorsal striatum was prevented with injection of CNO in animals with expression of excitatory DREADD. (H) Dln101 and ghrelin displayed their neuroprotective effect even with neutralization of their effects on neuronal firing. Data from C to H were analyzed using One-way ANOVA test followed by multiple comparisons test, n = 6–8 per group.
Figure 5
Figure 5
Effect of ghrelin and Dln101 on mitochondrial dynamics of WT SN DA neurons. (A) Representative EM pictures of WT SN DA cells under various treatments, with drawing of overall mitochondrial distribution in the representative cell. Scale bar = 1 μm (B) Cumulative probability distribution for mitochondrial area (vehicle = black, Dln101 = purple, ghrelin = red). Kolmogorov–Smirnov test, n = 315–555 per group. (C) Mitochondrial average area (vehicle = 0.143 ± 0.004, Dln101 = 0.181 ± .006, ghrelin = 0.138 ± .004, in μm2). (D) Mitochondrial cytoplasmic coverage (vehicle = 9.94% ± 1.1, Dln101 = 11.2% ± 0.75, ghrelin = 13.05% ± 0.79, as percentage of total cytoplasm area). Area and coverage were analyzed using One-way ANOVA followed by multiple comparisons test; n = 315–555 per group. (E) MPTP-induced mitochondrial fragmentation and degeneration in SN DA neurons. Representative EM pictures of SN DA cells. (F) Cumulative probability distribution for mitochondrial area (vehicle = blue, MPTP 4h = red, MPTP 1day = orange, Dln101 + MPTP 1day = green). (G) Mitochondrial average area (vehicle = 0.143 ± 0.004, MPTP 4h = 0.112 ± 0.006, MPTP 1day = 0.176 ± 0.006, Dln101 + MPTP 1day = 0.234 ± 0.009). (H) Mitochondrial cytoplasmic coverage (vehicle = 9.94% ± 1.1, MPTP 4h = 8.66% ± 0.68, MPTP 1day = 6.144% ± 0.51, Dln101 + MPTP 1day = 8.14% ± 0.55). Kolmogorov–Smirnov test on cumulative distribution, One-way ANOVA on G and H; n = 102–473 per group. (I) Real-time PCR data of genes coding mitochondrial fission (FIS-1, MFF, DRP-1) and fusion proteins (MFN 1, MFN 2, OPA-1) at 4h time point. One-way ANOVA test followed by multiple comparisons test; n = 4–7 per group.
Figure 6
Figure 6
Mitofusin 2 deletion in DA neurons. (A) HPLC measurement of dorsal striatum dopamine levels (iCre-DATWT = 184.9 ± 9.1, iCre-DATMFN2KO = 139.4 ± 30.5, in ng/mg of tissue protein) Unpaired t-test, n = 4–5. (B)SN DA neuron number did not differ between control groups and iCre-DATMFN2KO animals (Controls = 7532 ± 62, 7482 ± 198, 7464 ± 86; iCre-DATMFN2KO = 7912 ± 383), One-way ANOVA, n = 3–7. (C) Open field locomotor behavior analysis (B = before, A = after tamoxifen injections; iCre-DATWT grey bars and iCre-DATMFN2KO black bars; Total distance travelled (iCre-DATWT, B = 8.0 ± 1.7, A = 8.2 ± 1.9; iCre-DATMFN2KO, B = 10.0 ± 1.0, A = 7.4 ± 0.91; in meters). Average speed (iCre-DATWT, B = 0.026 ± 0.005, A = 0.027 ± 0.005; iCre-DATMFN2KO, B = 0.033 ± .003, A = 0.025 ± 0.003; in meters/second). Total time mobile (iCre-DATWT, B = 134 ± 19, A = 136 ± 20; iCre-DATMFN2KO, B = 138 ± 14, A = 132 ± 13, in seconds), total behavior test time was 300 s. Two-way ANOVA analysis retrieved no statistically significant differences, n = 11–14. (D) Representative EM pictures of SN DA cells of control (WT, either cre negative or iCre-DATMFN2 fl/fl animals that did not receive tamoxifen) and iCre-DATMFN2KO animals, with drawing of overall mitochondrial distribution in the representative cell. (E) Cumulative probability distribution for mitochondrial area (cre negative = grey, no tamoxifen = black, iCre-DATMFN2KO = red). No change was observed between groups. Kolmogorov–Smirnov test, n = 421–723 per group. (F) Dln101 does not induce mitochondrial fusion in iCre-DATMFN2KO animals. Representative EM pictures of SN DA cells. (G) Differently of what was observed in WT animals, Dln101 treatment did not induce a shift to the right in the cumulative distribution curve, suggesting no increased rate of mitochondrial fusion observed in iCre-DATMFN2KO animals. (H) No change in mitochondrial average area, or mitochondrial cytoplasmic coverage was observed with Dln101 treatment in iCre-DATMFN2KO animals. One-way ANOVA test followed by multiple comparisons test, n = 421–723 per group.
Figure 7
Figure 7
Mitofusin 2 deletion in DA neurons prevents Dln101 neuroprotective effect. (A) Visualization of TH+ cells in DAB immunohistological preparation. Scale bar 100 μm. Stereological analysis indicates Dln101 administration did not mitigate MPTP-induced degeneration of SN DA cells in iCre-DATMFN2KO animals (iCre-DATMFN2KO = 7912 ± 383, iCre-DATMFN2KO + MPTP = 3205 ± 390, iCre-DATMFN2KO + Dln101 + MPTP = 3375 ± 329). One-way ANOVA test followed by multiple comparisons test, n = 4–6. (B) Dln101 treatment in iCre-DATMFN2KO animals did not prevent MPTP-induced decreased motor performance, assessed in the rotarod test (latency to fall, iCre-DATMFN2KO = 71.5 ± 5.1, iCre-DATMFN2KO + MPTP = 45.3 ± 4.7, iCre-DATMFN2KO + Dln101 + MPTP = 42.0 ± 6.9; in seconds). One-way ANOVA test followed by multiple comparisons test, n = 5–10. (C) Representative EM pictures of SN DA cells of iCre-DATMFN2KO animals after MPTP exposure. MPTP administration induced aberrant mitochondria phenotype, with surviving neurons displaying bigger and rounder mitochondria, indicated with arrowheads. Remaining mitochondria showed circular cristae, and abnormal inner membrane structures. (D) Aberrant mitochondria phenotype reflected in much higher average mitochondrial area (iCre-DATMFN2KO = 0.163 ± 0.005, iCre-DATMFN2KO + MPTP 4h = 0.179 ± 0.004, iCre-DATMFN2KO + MPTP 3days = 0.287 ± 0.006), but fewer mitochondrial units per cell (iCre-DATMFN2KO = 80 ± 12, iCre-DATMFN2KO + MPTP 4h = 52 ± 6, iCre-DATMFN2KO + MPTP 3days = 29 ± 3). Finally, mitochondrial coverage was drastically increased after 3 days of MPTP exposure, indicating the fewer but enormous remaining mitochondria doubled the covered cytoplasmic area when compared to the other groups (iCre-DATMFN2KO = 9.35% ± 0.56, iCre-DATMFN2KO + MPTP 4h = 10.22 ± 0.69, iCre-DATMFN2KO + MPTP 3days = 23.32 ± 4.21). One-way ANOVA test followed by multiple comparisons test, n = 421–1456.

Similar articles

Cited by

References

    1. Shaikh S.I., Verma H. Parkinson's disease and anaesthesia. Indian Journal of Anaesthesia. 2011;55(3):228–234. - PMC - PubMed
    1. Dorsey E.R., Constantinescu R., Thompson J.P., Biglan K.M., Holloway R.G., Kieburtz K. Projected number of people with Parkinson disease in the most populous nations, 2005 through 2030. Neurology. 2007;68(5):384–386. - PubMed
    1. Bernheimer H., Birkmayer W., Hornykiewicz O., Jellinger K., Seitelberger F. Brain dopamine and the syndromes of Parkinson and Huntington. Clinical, morphological and neurochemical correlations. Journal of the Neurological Sciences. 1973;20(4):415–455. - PubMed
    1. Carlsson A. Thirty years of dopamine research. Advances in Neurology. 1993;60:1–10. - PubMed
    1. Hornykiewicz O. Parkinson's disease and the adaptive capacity of the nigrostriatal dopamine system: possible neurochemical mechanisms. Advances in Neurology. 1993;60:140–147. - PubMed

Publication types

MeSH terms