. 2019 Apr 23;87(5):e00163-19.
doi: 10.1128/IAI.00163-19. Print 2019 Mar.

Dual Gene Expression Analysis Identifies Factors Associated with Staphylococcus aureus Virulence in Diabetic Mice

Affiliations

Dual Gene Expression Analysis Identifies Factors Associated with Staphylococcus aureus Virulence in Diabetic Mice

Rudy Jacquet et al. Infect Immun. .

Abstract

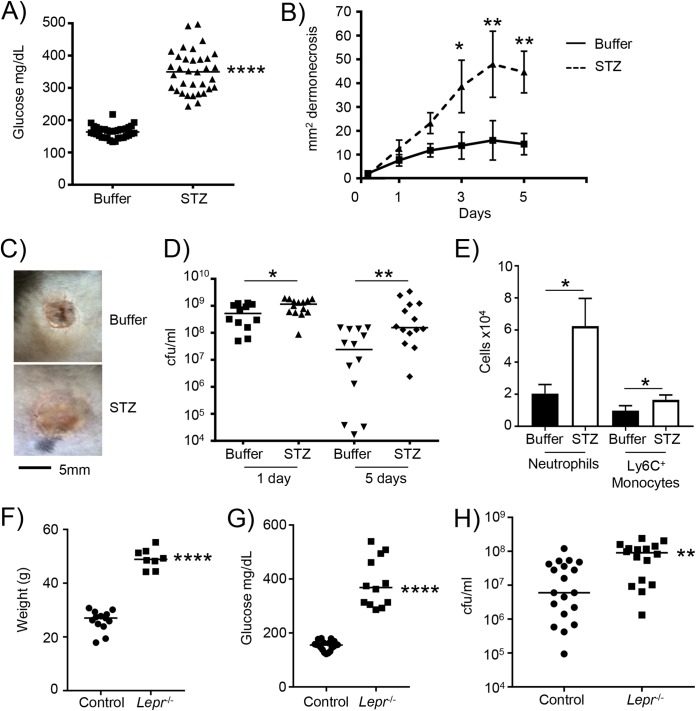
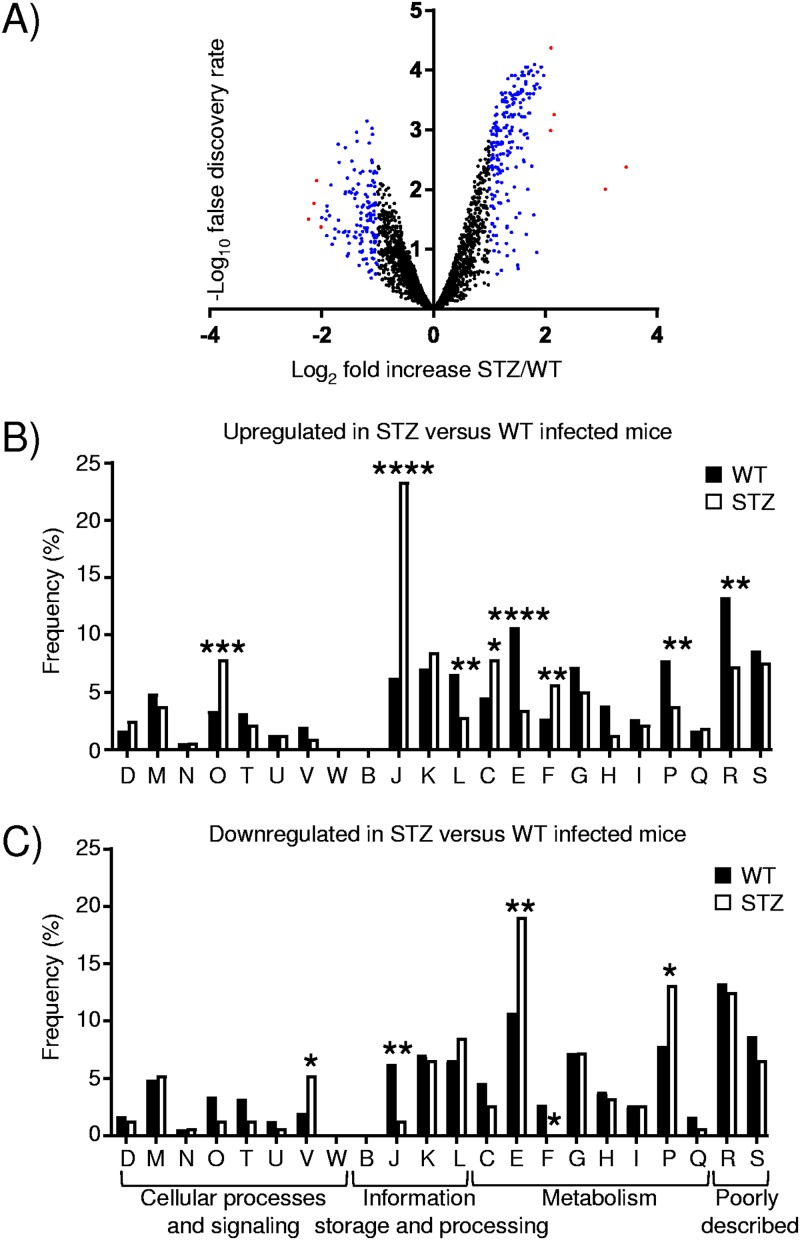
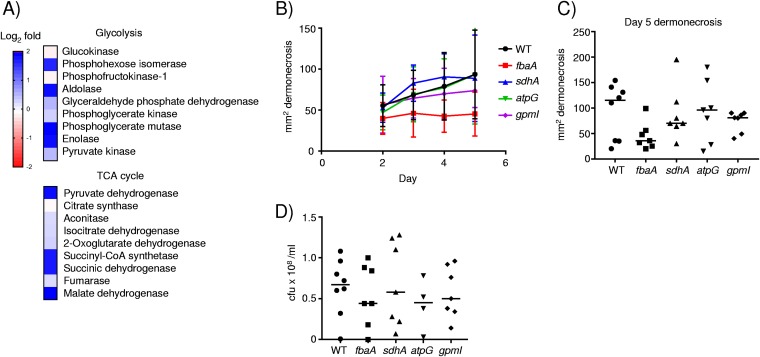
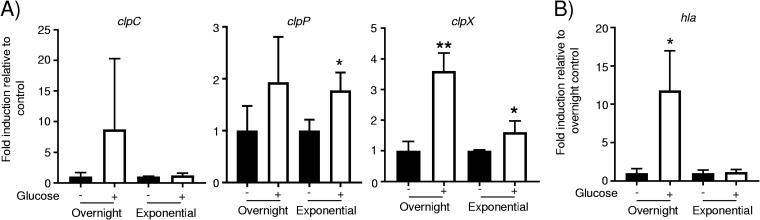
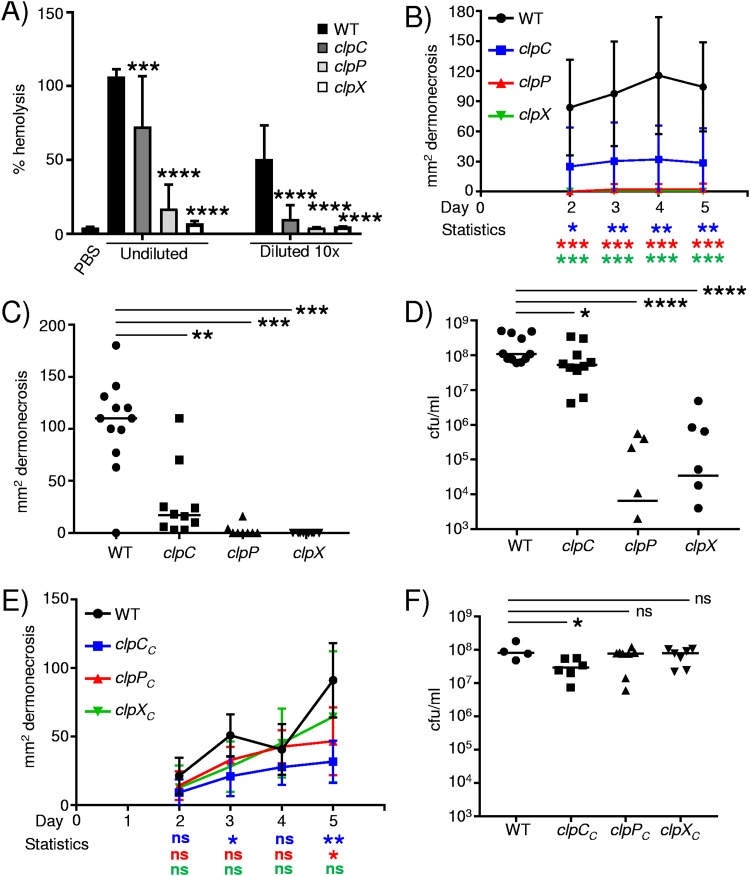
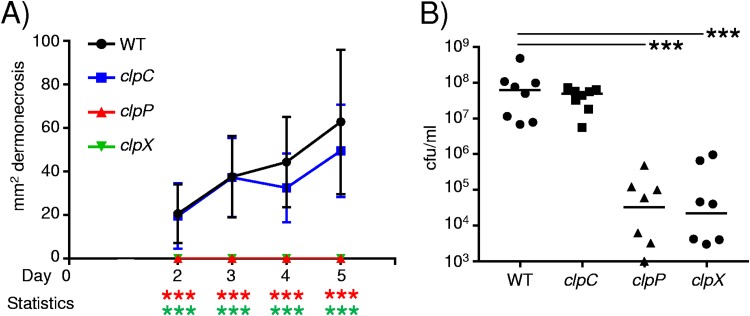
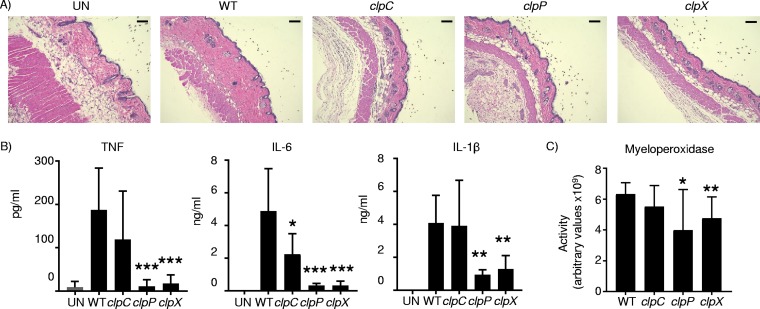
Staphylococcus aureus is a major human pathogen of the skin. The global burden of diabetes is high, with S. aureus being a major complication of diabetic wound infections. We investigated how the diabetic environment influences S. aureus skin infection and observed an increased susceptibility to infection in mouse models of both type I and type II diabetes. A dual gene expression approach was taken to investigate transcriptional alterations in both the host and bacterium after infection. While analysis of the host response revealed only minor changes between infected control and diabetic mice, we observed that S. aureus isolated from diabetic mice had significant increases in the levels of genes associated with translation and posttranslational modification and chaperones and reductions in the levels of genes associated with amino acid transport and metabolism. One family of genes upregulated in S. aureus isolated from diabetic lesions encoded the Clp proteases, associated with the misfolded protein response. The Clp proteases were found to be partially glucose regulated as well as influencing the hemolytic activity of S. aureus Strains lacking the Clp proteases ClpX, ClpC, and ClpP were significantly attenuated in our animal model of skin infection, with significant reductions observed in dermonecrosis and bacterial burden. In particular, mutations in clpP and clpX were significantly attenuated and remained attenuated in both normal and diabetic mice. Our data suggest that the diabetic environment also causes changes to occur in invading pathogens, and one of these virulence determinants is the Clp protease system.

Keywords: Clp protease; Staphylococcus aureus; diabetes; host-pathogen interactions.


Figures

FIG 1
FIG 1
Type I and II diabetic mice are more susceptible to S. aureus skin infection. Diabetes was induced in mice using streptozotocin (STZ). (A) Glucose levels in control and STZ-treated mice prior to infection. (B) Control and STZ mice were subcutaneously infected with 2 × 106 CFU of S. aureus USA300, and the area of dermonecrosis was monitored over time (n = 14 for both genotypes). (C) Representative gross pathology of regions of dermonecrosis. (D) Bacterial quantification from punch biopsy specimens. (E) Flow cytometry analysis of cells from 5-day-infected punch biopsy homogenates (n = 3 for uninfected and 17 for infected groups). Data are from 4 independent experiments. (F and G) Weights (F) and glucose levels (G) of control (Lepr+/−) and obese (Lepr−/−) mice prior to infection. (H) Control and obese mice were infected with 2 × 106 CFU of S. aureus USA300 subcutaneously for 5 days. Data are from 3 independent experiments. Each point represents data for an individual mouse. ****, P < 0.0001; **, P < 0.01; *, P < 0.05.
FIG 2
FIG 2
Significant transcriptional changes to S. aureus occur in diabetic mice. RNAseq was conducted on RNA isolated from punch biopsy specimens from control and diabetic mice 1 day after subcutaneous infection with S. aureus USA300. (A) Volcano plot comparing diabetic (STZ-treated) and control mice infected with S. aureus. Red, >4-fold change; blue, >2-fold change (with a false discovery rate of <0.05). (B and C) S. aureus differentially expressed genes (513) were classified according to Clusters of Orthologous Groups (COG) designations, with changes in STZ-treated versus control infected mice analyzed among upregulated (B) and downregulated (C) genes. ****, P < 0.0001; ***, P < 0.001; **, P < 0.01; *, P < 0.05 (relative to the WT). D, cell cycle control, cell division, and chromosome partitioning; M, cell wall/membrane/envelope biogenesis; N, cell motility; O, posttranslational modification, protein turnover, and chaperones; T, signal transduction, intracellular trafficking, secretion, and vesicular transport; V, defense mechanisms; W, extracellular structures; B, chromatin structure and dynamics; J, translation, ribosomal structure, and biogenesis; K, transcription; L, replication, recombination, and repair; C, energy production and conversion; E, amino acid transport and metabolism; F, nucleotide transport and metabolism; G, carbohydrate transport and metabolism; H, coenzyme transport and metabolism; I, lipid transport and metabolism; P, inorganic ion transport and metabolism; Q, secondary metabolite biosynthesis, transport, and catabolism; R, general function prediction; S, unknown function.
FIG 3
FIG 3
Influence of the diabetic environment on glycolysis and the TCA cycle in S. aureus. (A) Heat map analysis of S. aureus genes involved in glycolysis or the TCA cycle. Transcript levels were compared between bacterial RNAs isolated from diabetic and control mouse lesion material (diabetic/control). (B) Wild-type mice were infected subcutaneously with 2 × 106 CFU of WT Je2 or mutant strains of S. aureus for 5 days, and dermonecrosis was monitored (n = 8 for the WT and 7 for each mutant strain). (C) Quantification of dermonecrosis at day 5. (D) Bacterial enumeration in punch biopsy specimens at day 5 of infection. Each point represents data for a mouse. Lines display medians.
FIG 4
FIG 4
Influence of glucose on clp gene expression. RNA was extracted from overnight-grown and exponential-phase cultures of S. aureus, and transcripts for clp genes (A) and hla (B) were quantified (n = 3). **, P < 0.01; *, P < 0.05 relative to the no-glucose or PBS control.
FIG 5
FIG 5
The Clp proteases contribute to S. aureus subcutaneous skin infection. (A) Hemolytic activity of spent culture supernatants from WT S. aureus and clp mutants (n = 12 for PBS, 13 for the WT, 12 for the clpC mutant, 10 for the clpP mutant, and 6 for the clpX mutant). WT C57BL/6J mice were infected subcutaneously with WT S. aureus and clp mutants for 5 days. (B) Areas of dermonecrosis over time. (C) Areas of dermonecrosis quantified at day 5. (D) Bacterial counts from punch biopsy specimens at day 5. (E and F) Chromosomally complemented clp mutants were assessed in the skin infection model quantifying dermonecrosis (E) and bacterial burden (F). Each point represents data for a mouse. Lines display medians. ****, P < 0.0001; ***, P < 0.001; **, P < 0.01; *, P < 0.05; ns, not significant (relative to the WT control).
FIG 6
FIG 6
The ClpXP protease contributes to S. aureus skin infection under diabetic conditions. Diabetes was induced in mice using streptozotocin (STZ). (A) Mice were subcutaneously infected with 2 × 106 CFU of S. aureus USA300, and the area of dermonecrosis was monitored over time. (B) Bacterial quantification from punch biopsy specimens (n = 8). Data are from two independent experiments. ***, P < 0.001.
FIG 7
FIG 7
Reduced immune response to Clp mutants. WT C57BL/6J mice were infected subcutaneously with WT S. aureus and clp mutants for 5 days before punch biopsies were performed and samples were homogenized. (A) H&E-stained sections. Bars = 100 μm. UN, uninfected. (B and C) Clarified homogenized samples were used to quantify cytokine levels (B) and myeloperoxidase activity (C). Graphs show means with standard deviations (n = 12 for the WT and 8 for clp mutants, except for TNF [n = 7 for the clpP mutant]). ***, P < 0.001; **, P < 0.01; *, P < 0.05 (relative to the WT control).

References

    1. Wild S, Roglic G, Green A, Sicree R, King H. 2004. Global prevalence of diabetes: estimates for the year 2000 and projections for 2030. Diabetes Care 27:1047–1053. doi:10.2337/diacare.27.5.1047. - DOI - PubMed
    1. CDC. 2014. National diabetes statistics report. CDC, Atlanta, GA.
    1. Joshi MB, Lad A, Bharath Prasad AS, Balakrishnan A, Ramachandra L, Satyamoorthy K. 2013. High glucose modulates IL-6 mediated immune homeostasis through impeding neutrophil extracellular trap formation. FEBS Lett 587:2241–2246. doi:10.1016/j.febslet.2013.05.053. - DOI - PubMed
    1. Lepper PM, Ott S, Nuesch E, von Eynatten M, Schumann C, Pletz MW, Mealing NM, Welte T, Bauer TT, Suttorp N, Juni P, Bals R, Rohde G, German Community Acquired Pneumonia Competence Network . 2012. Serum glucose levels for predicting death in patients admitted to hospital for community acquired pneumonia: prospective cohort study. BMJ 344:e3397. doi:10.1136/bmj.e3397. - DOI - PMC - PubMed
    1. Rao Kondapally Seshasai S, Kaptoge S, Thompson A, Di Angelantonio E, Gao P, Sarwar N, Whincup PH, Mukamal KJ, Gillum RF, Holme I, Njolstad I, Fletcher A, Nilsson P, Lewington S, Collins R, Gudnason V, Thompson SG, Sattar N, Selvin E, Hu FB, Danesh J, Emerging Risk Factors Collaboration . 2011. Diabetes mellitus, fasting glucose, and risk of cause-specific death. N Engl J Med 364:829–841. doi:10.1056/NEJMoa1008862. - DOI - PMC - PubMed

Publication types

MeSH terms