. 2019 Mar 19;116(12):5819-5827.
doi: 10.1073/pnas.1716314116. Epub 2019 Mar 4.

Genomic and molecular characterization of preterm birth

Affiliations

Genomic and molecular characterization of preterm birth

Theo A Knijnenburg et al. Proc Natl Acad Sci U S A. .

Abstract

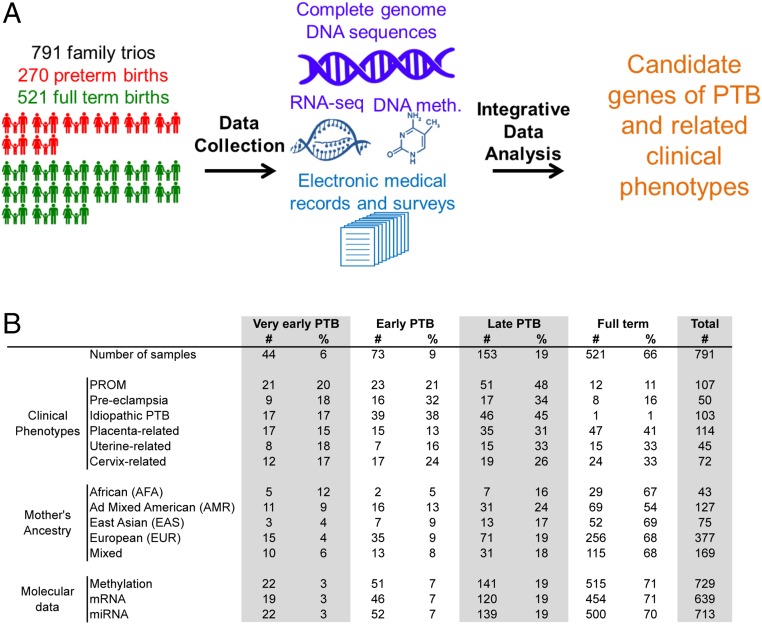
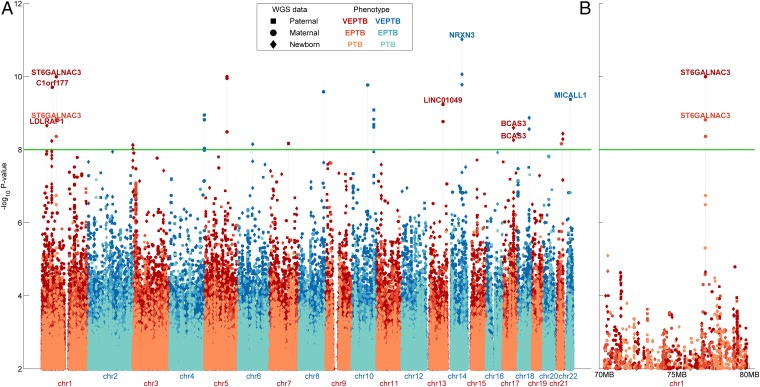
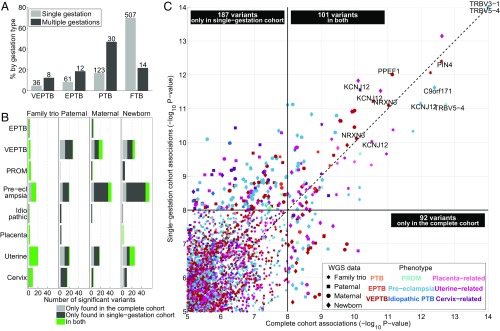
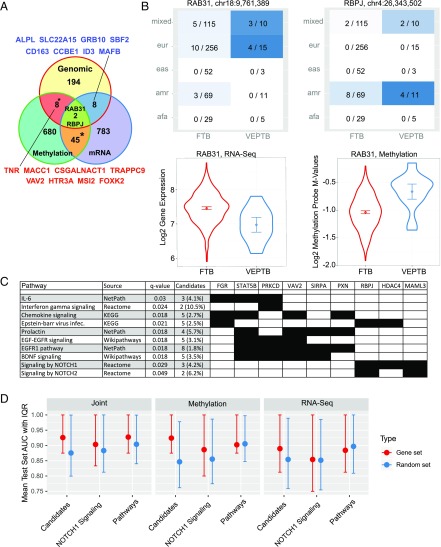
Preterm birth (PTB) complications are the leading cause of long-term morbidity and mortality in children. By using whole blood samples, we integrated whole-genome sequencing (WGS), RNA sequencing (RNA-seq), and DNA methylation data for 270 PTB and 521 control families. We analyzed this combined dataset to identify genomic variants associated with PTB and secondary analyses to identify variants associated with very early PTB (VEPTB) as well as other subcategories of disease that may contribute to PTB. We identified differentially expressed genes (DEGs) and methylated genomic loci and performed expression and methylation quantitative trait loci analyses to link genomic variants to these expression and methylation changes. We performed enrichment tests to identify overlaps between new and known PTB candidate gene systems. We identified 160 significant genomic variants associated with PTB-related phenotypes. The most significant variants, DEGs, and differentially methylated loci were associated with VEPTB. Integration of all data types identified a set of 72 candidate biomarker genes for VEPTB, encompassing genes and those previously associated with PTB. Notably, PTB-associated genes RAB31 and RBPJ were identified by all three data types (WGS, RNA-seq, and methylation). Pathways associated with VEPTB include EGFR and prolactin signaling pathways, inflammation- and immunity-related pathways, chemokine signaling, IFN-γ signaling, and Notch1 signaling. Progress in identifying molecular components of a complex disease is aided by integrated analyses of multiple molecular data types and clinical data. With these data, and by stratifying PTB by subphenotype, we have identified associations between VEPTB and the underlying biology.

Keywords: family trios; genomic variants; integrative computational analysis; preterm birth; whole genome sequencing.


Conflict of interest statement

The authors declare no conflict of interest.

Figures

Fig. 1.
Fig. 1.
Study overview. (A) Graphical overview of the study described in this report. We collected peripheral blood samples from 791 family trios, of which 270 represented PTBs. We carried out WGS of DNA for each member of the family trio, i.e., the father, mother, and newborn. We profiled mRNA and miRNA expression by using RNA-seq as well as DNA methylation in the maternal samples. Extensive clinical information was captured by using EMRs and study-specific patient surveys. All these data were integrated in an analytical framework to characterize the genomic and molecular associations with PTB and related clinical phenotypes. (B) Summary of distribution of family trios across clinical phenotypes and ancestries broken down by PTB categories based on gestational age. Molecular data indicate the number of maternal samples profiled for DNA methylation and mRNA and miRNA expression. Numbers cited indicate samples that passed stringent quality-control criteria for inclusion in this report.
Fig. 2.
Fig. 2.
Manhattan plot of genomic associations in PTB. (A) Genomewide significance values (−log10 P values) for all variants tested for association with PTB, EPTB, and VEPTB. Association tests were performed by using EIGENSTRAT on the paternal, maternal, or neonatal genomes separately. The green horizontal line represents the global P value threshold of 10−8. Stacked points represent variants within close proximity of one another. (B) Zoomed-in view of chr1 from 70,000,000 bps to 80,000,000 bps, which includes the ST6GALNAC3 locus.
Fig. 3.
Fig. 3.
Genomic associations when excluding multiple-gestation families. (A) Bar plot showing the distribution of single- and multiple-gestation families across the four term categories. The light gray bars for single gestations and dark gray bars for multiple gestations each add up to 100%. The numbers above the bars indicate the number of family trios. (B) Bar plots indicating the number of genomic variants associated with PTB-related phenotypes (stratified vertically) across genomic tests (stratified horizontally) at P < 10−8, divided into (i) variants found only in the complete cohort (light gray), (ii) variants found only in the single-gestation families (dark gray), and (iii) variants found in both (green). (C) Scatter plot displaying P values for variants that were statistically associated with the nine PTB-related phenotypes across the four genomic tests (indicated by various markers and colors) in the complete cohort (x axis) and the single-gestation cohort (y axis). Gene names are printed for variants with P < 10−10 in both cohorts that were in a gene. The black boxes indicate the number of variants observed at P < 10−8 in only single-gestation families (top left box), in only the complete cohort (bottom right box), or in both (center top box). Note that these are not numbers of unique variants; a variant may be represented multiple times if significant for multiple tests or phenotypes.
Fig. 4.
Fig. 4.
Integrative analysis of genomic and molecular data for VEPTB families uncovers candidate genes. (A) Venn diagram of the overlap between genes with significant variants associated with VETPB and differentially expressed and methylated genes. * Indicates statistically significant overlap between gene sets (hypergeometric test P < 0.05). (B) Heat maps depicting the distribution of variants in RAB31 (Upper Left) and RBPJ (Upper Right) across different ancestries for FTB and VEPTB mothers. In each heat map panel, the ratio is the number of mothers who have the minor allele (homozygous or heterozygous) over the total number of mothers from that ancestry group. Ancestries are represented by using the 1000 Genomes super populations notation. (Lower) Violin plots of differential gene expression (Left) and differential DNA methylation (Right) of RAB31 between FTB and VEPTB. (C) Overview of pathways that were significantly enriched with genes in the VEPTB candidate list of 72 genes. This overview is a selection of all significant pathways (listed in Dataset S14). The selection was performed manually with the goal of including pathways related to immune and growth factor signaling, which formed the large majority of the enriched pathways, yet avoiding redundancy among the selected pathways, i.e., excluding pathways with similar names and gene membership. (D) Mean area under the curve (AUC) and associated interquartile range of VEPTB class prediction using a random forest classifier with different data types including RNA-seq data, DNA methylation data, and a joint set of RNA-seq and methylation data. Prediction was performed with the 72 VEPTB genes (candidate); the 1,324 VEPTB pathway genes, i.e., the full set of genes in associated pathways excluding the 72 VEPTB genes (pathway genes); and on each candidate pathway individually (one example shown, i.e., the Notch1 pathway). Sets of random genes with identical set sizes are shown for comparison. Each mean AUC was computed by using cross-validation on a test set.

References

    1. World Health Organization 2015. Preterm Birth Fact Sheet (Geneva, WHO)
    1. Hamilton BE, Martin JA, Ventura SJ. Births: Preliminary data for 2012. Natl Vital Stat Rep. 2013;62:1–20. - PubMed
    1. Mwaniki MK, Atieno M, Lawn JE, Newton CR. Long-term neurodevelopmental outcomes after intrauterine and neonatal insults: A systematic review. Lancet. 2012;379:445–452. - PMC - PubMed
    1. Behrman RE, Butler AS. 2007. Preterm Birth: Causes, Consequences, and Prevention, eds Behrman RE, Butler AS. The National Academies Collection: Reports Funded by National Institutes of Health (National Institutes of Health, Washington, DC)
    1. York TP, Eaves LJ, Neale MC, Strauss JF., 3rd The contribution of genetic and environmental factors to the duration of pregnancy. Am J Obstet Gynecol. 2014;210:398–405. - PMC - PubMed