. 2019 Mar 19;116(12):5399-5404.
doi: 10.1073/pnas.1815208116. Epub 2019 Mar 4.

Renal reabsorption in 3D vascularized proximal tubule models

Affiliations

Renal reabsorption in 3D vascularized proximal tubule models

Neil Y C Lin et al. Proc Natl Acad Sci U S A. .

Abstract

Three-dimensional renal tissues that emulate the cellular composition, geometry, and function of native kidney tissue would enable fundamental studies of filtration and reabsorption. Here, we have created 3D vascularized proximal tubule models composed of adjacent conduits that are lined with confluent epithelium and endothelium, embedded in a permeable ECM, and independently addressed using a closed-loop perfusion system to investigate renal reabsorption. Our 3D kidney tissue allows for coculture of proximal tubule epithelium and vascular endothelium that exhibits active reabsorption via tubular-vascular exchange of solutes akin to native kidney tissue. Using this model, both albumin uptake and glucose reabsorption are quantified as a function of time. Epithelium-endothelium cross-talk is further studied by exposing proximal tubule cells to hyperglycemic conditions and monitoring endothelial cell dysfunction. This diseased state can be rescued by administering a glucose transport inhibitor. Our 3D kidney tissue provides a platform for in vitro studies of kidney function, disease modeling, and pharmacology.

Keywords: bioprinting; kidney tissue; proximal tubule; reabsorption; vasculature.


Conflict of interest statement

Conflict of interest statement: The authors have filed a patent on this work. A.M. is an employee of Roche Pharmaceutical company and J.A.L. is a cofounder of Voxel8, Inc.

Figures

Fig. 1.
Fig. 1.
Design and fabrication of 3D VasPT models. (A) Schematic view of 3D VasPT fabrication process. (B) Simple and complex 3D VasPT models can be rapidly designed and fabricated. (Scale bar: 10 mm.) (C) Whole-mount immunofluorescence staining of the 3D tissue, in which Na+/K+ ATPase, CD31, and nuclei (NucBlue staining) are denoted by green, red, and blue, respectively. (Scale bar: 1 mm.) Note: The separation distance between the PT and vascular conduits is ∼70 μm. (Inset) Cross-sectional images of the two open lumens. (Scale bars: 100 μm.) (D) High-magnification images of 3D VasPT tissue after staining. (Scale bars: 100 μm.)
Fig. 2.
Fig. 2.
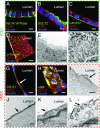
PTECs and GMECs seeded in 3D VasPT tissues exhibit healthy and mature phenotypes. (AD) Fluorescence images of PTECs showing (A) Na+/K+ ATPase expression primarily located on the basolateral side (green) (Scale bar: 10 μm.); (B) apical expression of glucose transporter SGLT2 (green) (Scale bar: 10 μm.); (C) deposition of the basement membrane laminin (green) (Scale bar: 10 μm.); and (D) primary cilia labeled by α-tubulin (green). (Scale bar: 10 μm.) Red, cytoskeleton labeled by F-actin staining; blue, nuclei labeled by DNA staining. (E and F) TEM (E) and SEM (F) micrographs showing densely packed PTEC microvilli that are ∼1.2 μm in height. (Scale bar = 1 μm.) (G and H) Fluorescence images of GMECs showing (G) expression of CD31 (green) predominantly localizes at the GMEC cell–cell junction (arrow) (Scale bar: 10 μm.) and (H) granule-like structure of vWF (green) expression in GMECs. (Scale bar: 10 μm.) Red, cytoskeleton labeled by F-actin staining (in G); blue, nuclei labeled by DNA staining. (IL) TEM images of GMEC (I) cell junction, (J) glycocalyx, and (K and L) caveolae-mediated transport. (Scale bars: 1 μm.)
Fig. 3.
Fig. 3.
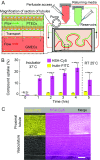
Albumin reabsorption. (A) Integration of 3D VasPT tissue with a closed-loop perfusion system that allows quantitative measurements of renal reabsorption. (B) Time evolution of uptake of Cy5-conjugated human serum albumin (HSA-Cy5, purple) and FITC-conjugated inulin (inulin-FITC,yellow). Error bars represent SD of the mean; n = 3; N.S., not significant; ***P < 0.0001. (C) Confocal image of colocalized PT and vascular channels (denoted by white dashed lines to guide the eye) that shows PT barrier function and selective transport of HSA-Cy5 from the PTEC to the GMEC channel (purple). (Scale bar: 100 μm.) In this experiment, we acquired images using a fluorescence microscope, which averages the signal intensity within ±1 mm along the vertical direction. Hence, unlike the confocal image provided in SI Appendix, Fig. S9, the HSA-Cy5 concentration gradient between PT and vasculature is not readily observed.
Fig. 4.
Fig. 4.
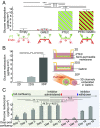
Glucose reabsorption. (A) Quantitative measurements of glucose transport in samples with four different cell seeding configurations showing glucose reabsorption function by PTECs mainly (n = 4). (B) The physiological microenvironment in our 3D vas-PT tissue substantially enhances the glucose reabsorption efficiency (n = 4). (C) The reabsorption rate of glucose increases with increasing PTEC maturity (days 1–8, green-gray shading). Upon administration of the SGLT2 inhibitor dapagliflozin, glucose reabsorption was significantly inhibited (days 14–15, red shading). The reabsorption was then gradually restored after dapagliflozin was withdrawn (day 16–18, blue-gray shading). n = 8. For all panels, error bars represent SD of the mean, N.S., not significant; *P < 0.05; **P < 0.001; ***P < 0.0001.
Fig. 5.
Fig. 5.
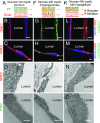
Hyperglycemic effects. Schematics and cell images of three experimental conditions: (AE) normal (control), (FJ) hyperglycemic, and (KO) hyperglycemic with dapagliflozin administered. To generate the hyperglycemic condition, 400 mg/dL glucose is delivered through the PT channel. (B, G, and L) Confocal images of live GMECs incubated with CellROX for reactive oxygen species (ROS) detection (green) under different conditions. (Scale bars: 100 μm.) (C, H, and M) Nitrotyrosine staining of GMECs (green) indicative of ROS/reactive nitrogen species production. (Scale bars: 1 μm.) Red, cytoskeleton; blue, nuclei. (D, I, and N) TEM images of the junctions between GMECs within the confluent endothelium under different conditions. (Scale bar: 1 μm.) (E, J, and O) TEM images of the PTECs within the confluent epithelium under different conditions. (Scale bar: 10 μm.)

References

    1. Eaton D, Pooler J. 2004. Vander’s Renal Physiology, Lange Physiology Series (Lange Medical Books/McGraw-Hill, New York)
    1. Wilmer MJ, et al. Kidney-on-a-chip technology for drug-induced nephrotoxicity screening. Trends Biotechnol. 2016;34:156–170. - PubMed
    1. Jang K-J, et al. Human kidney proximal tubule-on-a-chip for drug transport and nephrotoxicity assessment. Integr Biol. 2013;5:1119–1129. - PubMed
    1. Meyers CM, Seeff LB, Stehman-Breen CO, Hoofnagle JH. Hepatitis C and renal disease: An update. Am J Kidney Dis. 2003;42:631–657. - PubMed
    1. Lazzara MJ, Deen WM. Model of albumin reabsorption in the proximal tubule. Am J Physiol Renal Physiol. 2007;292:F430–F439. - PubMed

Publication types

MeSH terms

LinkOut - more resources