. 2019 Mar 19;116(12):5681-5686.
doi: 10.1073/pnas.1822024116. Epub 2019 Mar 4.

Renal control of disease tolerance to malaria

Affiliations

Renal control of disease tolerance to malaria

Susana Ramos et al. Proc Natl Acad Sci U S A. .

Abstract

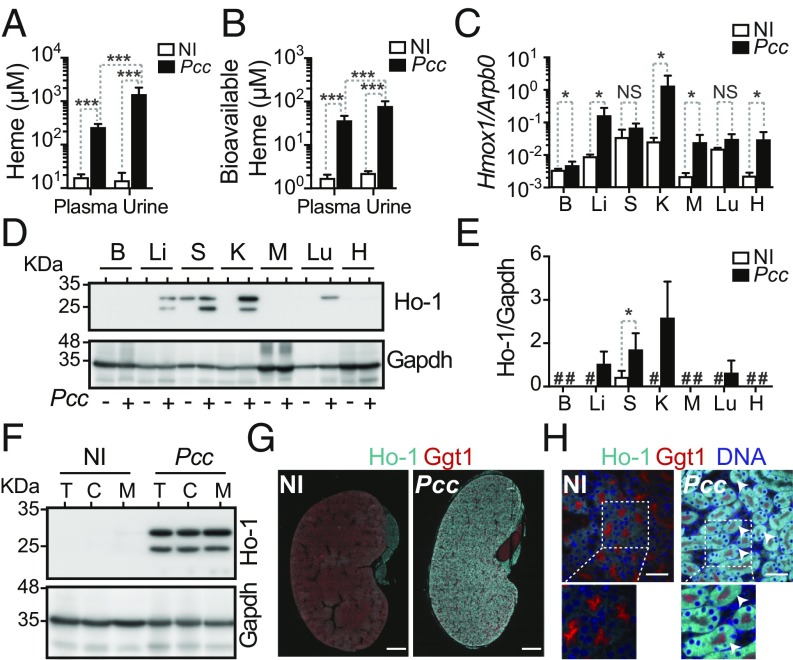
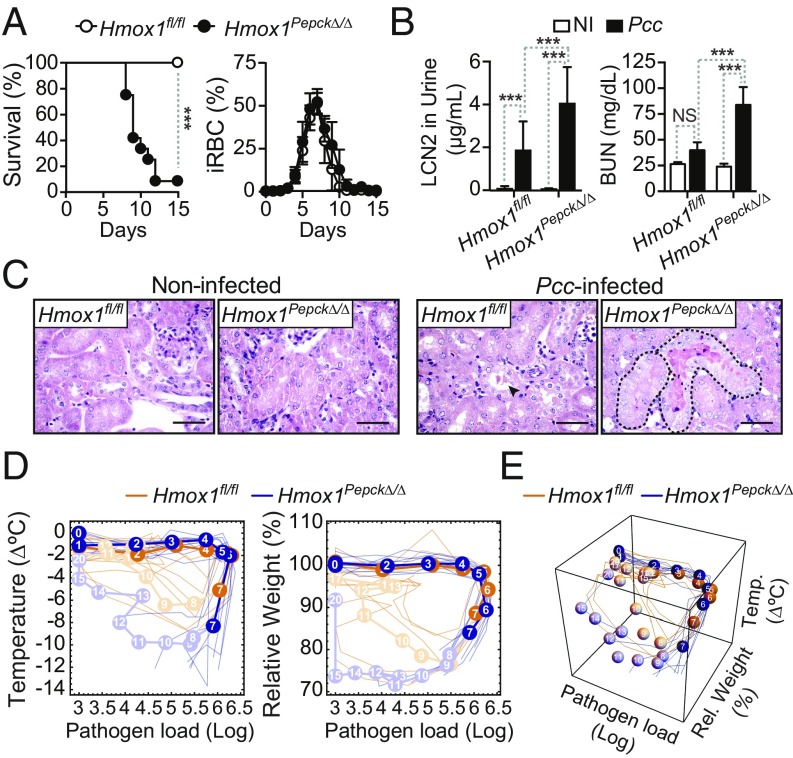
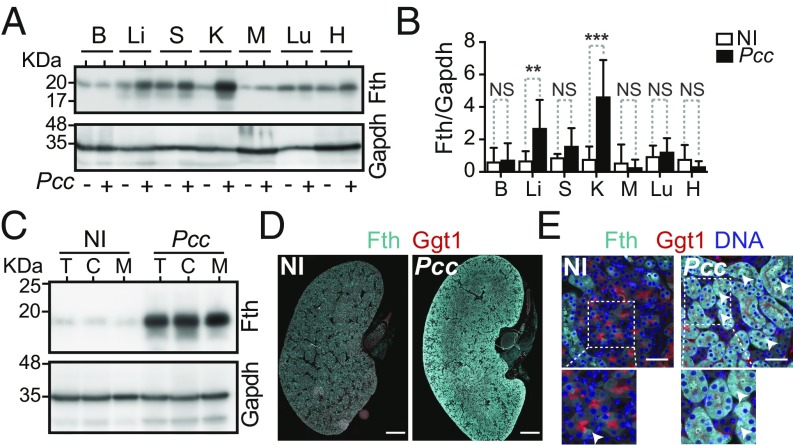
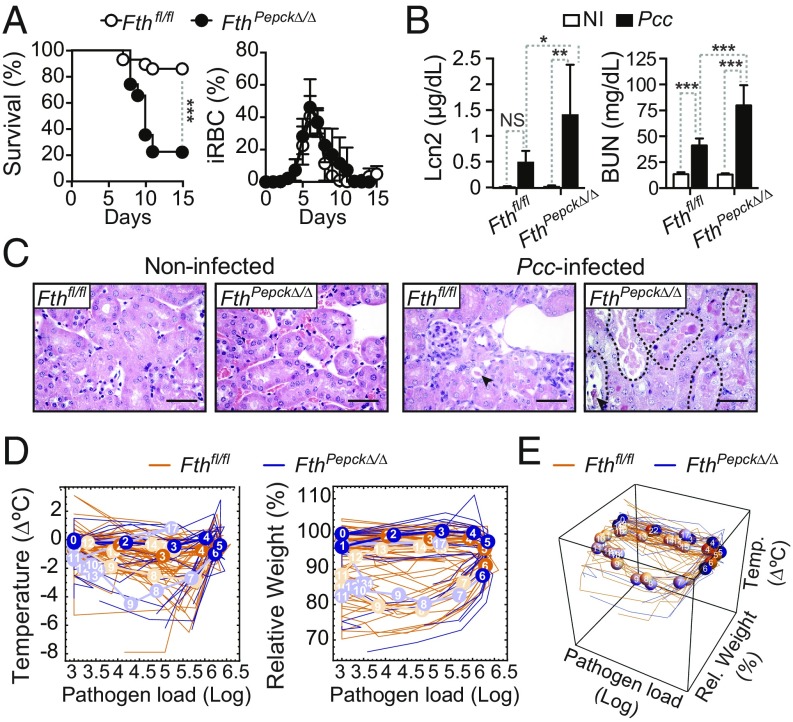
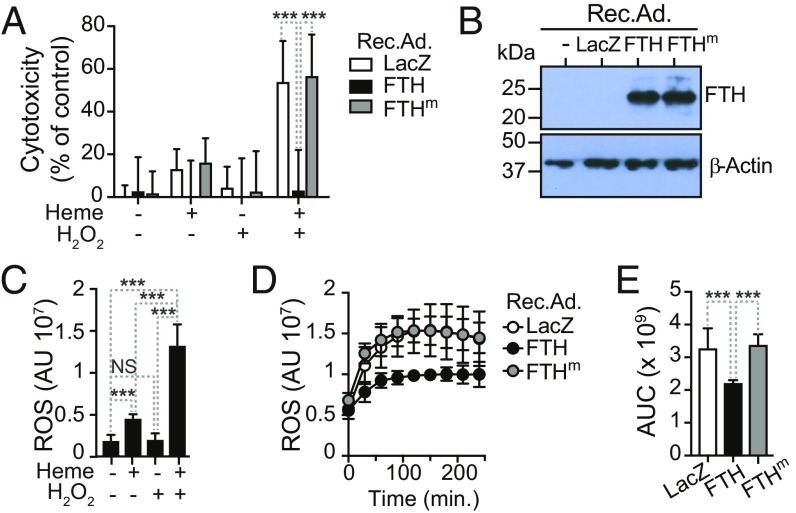
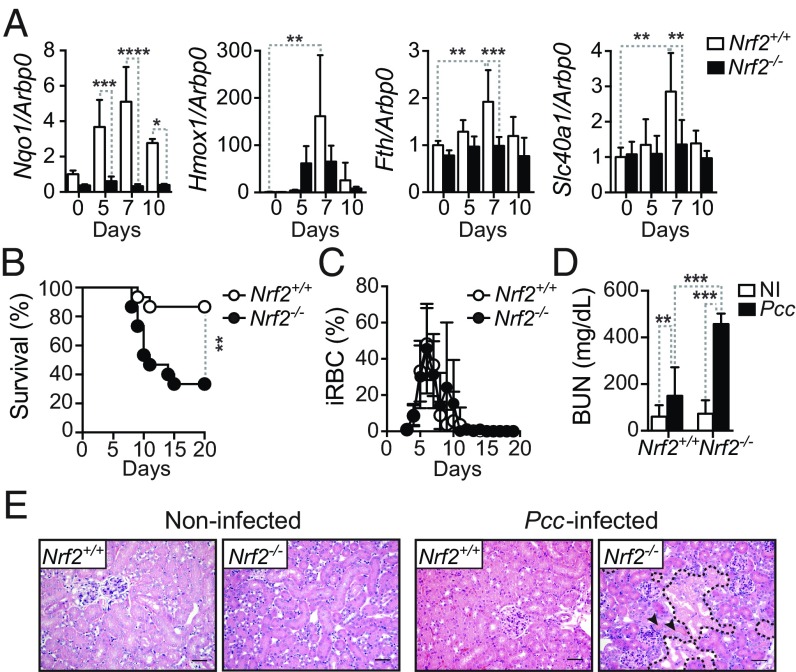
Malaria, the disease caused by Plasmodium spp. infection, remains a major global cause of morbidity and mortality. Host protection from malaria relies on immune-driven resistance mechanisms that kill Plasmodium However, these mechanisms are not sufficient per se to avoid the development of severe forms of disease. This is accomplished instead via the establishment of disease tolerance to malaria, a defense strategy that does not target Plasmodium directly. Here we demonstrate that the establishment of disease tolerance to malaria relies on a tissue damage-control mechanism that operates specifically in renal proximal tubule epithelial cells (RPTEC). This protective response relies on the induction of heme oxygenase-1 (HMOX1; HO-1) and ferritin H chain (FTH) via a mechanism that involves the transcription-factor nuclear-factor E2-related factor-2 (NRF2). As it accumulates in plasma and urine during the blood stage of Plasmodium infection, labile heme is detoxified in RPTEC by HO-1 and FTH, preventing the development of acute kidney injury, a clinical hallmark of severe malaria.

Keywords: disease tolerance; heme; infection; kidney; malaria.


Conflict of interest statement

The authors declare no conflict of interest.

Figures

Fig. 1.
Fig. 1.
HO-1 expression is induced in RPTEC during Plasmodium infection. (A) Heme and (B) bioavailable heme concentration (mean ± SD) in plasma and urine of C57BL/6 mice, not infected (NI; n = 7) or 7 d after Pcc infection (n = 8). Data are from one experiment. (C) Hmox1 normalized to Arbp0 mRNA (mean ± SD) in brain (B), liver (Li), spleen (S), kidney (K), muscle (M), lung (Lu), and heart (H) of C57BL/6 mice, not infected (NI; n = 3) or 7 d after Pcc infection (n = 6). Data are from one experiment. (D) HO-1 and Gapdh protein expression detected by Western blot in the brain (B), liver (Li), spleen (S), kidney (K), muscle (M), lung (Lu), and heart (H) of C57BL/6 mice, not infected (NI) or 7 d after Pcc infection. Data are representative of four mice per group in one experiment. (E) Densitometry analysis (mean ± SD) of proteins in the same experiment as D. #: protein levels below detection limit for the exposure time analyzed. (F) HO-1 and Gapdh protein detected by Western blot in total kidney (T), renal cortex (C), and renal medulla (M) of C57BL/6 mice, not infected (NI) or 7 d after Pcc infection. Data are representative of four mice per group in one experiment. (G) Kidney immunostaining in C57BL/6 mice, not infected (NI) or 7 d after Pcc infection. Gamma glutamyl transferase 1 (Ggt1; red) was used as a RPTEC marker. Image is representative of three mice per group in one experiment. (Scale bar: 1,000 µm.) (H) Kidney immunostaining, as in G. DAPI (blue) was used to counterstain DNA. Arrowheads highlight HO-1 (cyan) in Ggt1+ RPTEC. Images are representative of five random fields from four to six mice per group in one experiment. (Scale bar: 50 µm.) P values in A and B, comparing log-transformed heme concentration values, were determined using two-way ANOVA with Tukey’s multiple comparisons tests, and in C and E using Mann–Whitney U test. NS: not significant (P > 0.05); *P < 0.05; ***P < 0.001.
Fig. 2.
Fig. 2.
HO-1 expression in RPTEC establishes disease tolerance to malaria. (A) Survival and percentage of iRBC (mean ± SD) in Pcc-infected Hmox1fl/fl (n = 7) and Hmox1PepcKΔ/Δ (n = 12) mice. Data from four independent experiments with similar trend. (B) Lcn2 concentration in urine and BUN (mean ± SD) in noninfected (NI) and Pcc-infected Hmox1PepcKΔ/Δ (NI: 5–11; Pcc: n = 7–12) and Hmox1fl/fl (NI: n = 6–11; Pcc: n = 9–13) mice, 7 d after infection. Data from two experiments with a similar trend. (C) Kidney H&E staining in noninfected and 7 d after Pcc infection. Representative of four to five mice per genotype in two experiments. (Scale bar: 50 µm.) Arrowhead indicates HB casts, and dashed lines outline tubular necrosis. (D) Individual disease trajectories of the same mice as in A. Circles represent median of disease trajectories, and corresponding numbers are days after infection (day 0). Portion of the disease trajectories in darker color indicates days before onset of mortality in Hmox1PepcKΔ/Δ mice. (E) The 3D plot of disease trajectories from the same mice as in D. Statistical differences between genotypes became significant (P = 0.008; Mann–Whitney U test) on day 7 before onset of mortality in Hmox1PepcKΔ/Δ mice. P values in A were determined using the log-rank (Mantel–Cox) test and in B using two-way ANOVA with Tukey’s multiple comparison test. NS, not significant (P > 0.05); ***P < 0.001.
Fig. 3.
Fig. 3.
FTH expression is induced in RPTEC during Plasmodium infection. (A) Fth and Gapdh protein expression in brain (B), liver (Li), spleen (S), kidney (K), muscle (M), lung (Lu), and heart (H) of C57BL/6 mice, noninfected (NI) or 7 d after Pcc infection. Western blot representative of nine mice, from two independent experiments with the same trend. (B) Densitometry analysis (mean ± SD) of proteins shown in A. n = 9 mice per group from two experiments. (C) Fth and Gapdh protein levels in total kidney (T), renal cortex (C), and renal medulla (M) of C57BL/6 mice, not infected (NI) or 7 d after Pcc infection. Data are representative of four mice per group from one experiment. (D) Kidney immunostaining in C57BL/6 mice, noninfected (NI) or 7 d after Pcc infection. Gamma glutamyl transferase 1 (Ggt1; red) was used as a RPTEC marker. Image is representative of three mice per group in one experiment. (Scale bar: 1,000 µm.) (E) Kidney immunostaining, as in D. DAPI (blue) was used to counterstain DNA. Arrowheads highlight Fth (cyan) in Ggt1+ RPTEC. Images are representative of five random fields from four to six mice per group in one experiment. (Scale bar: 50 µm.) P values in B determined using Mann–Whitney U test. NS, not significant (P > 0.05); **P < 0.01; ***P < 0.001.
Fig. 4.
Fig. 4.
FTH expression in RPTEC is essential to establish disease tolerance to malaria. (A) Survival and percentage of iRBC (mean ± SD) of Pcc-infected FthPepcKΔ/Δ (n = 23) and Fthfl/fl (n = 30) mice. Data are from six independent experiments with a similar trend. (B) Lcn2 plasma concentration and BUN (mean ± SD) in noninfected and Pcc-infected FthPepcKΔ/Δ (NI: n = 5–10; Pcc: n = 7) and Fthfl/fl (NI: n = 5; Pcc: n = 7) mice, 7 d after infection. Data are from three experiments. (C) H&E staining of kidney sections from noninfected (NI) and Pcc-infected FthPepcKΔ/Δ and Fthfl/fl mice, 9 d after infection. Arrowheads indicate HB casts, and dashed lines outline tubular necrosis. Images are representative of two to seven mice per genotype in four experiments. (Scale bar: 50 µm.) (D) Individual disease trajectories of Pcc-infected FthPepcKΔ/Δ (n = 17) and Fthfl/fl (n = 10) mice from three independent experiments with a similar trend. Circles represent median of disease trajectories, and corresponding numbers indicate days after infection (day 0). Portion of disease trajectories in darker color indicates days before onset of mortality in FthPepcKΔ/Δ mice. (E) The 3D plot of disease trajectories from the same mice as in D. Statistical differences between genotypes became significant on day 6 after Pcc infection (P = 0.00007; Mann–Whitney U test) before onset of mortality of FthPepcKΔ/Δ mice. P values in A were determined using a log-rank (Mantel–Cox) test and in B using two-way ANOVA with Tukey’s multiple comparison test. NS, not significant; *P < 0.05; **P < 0.01; ***P < 0.001.
Fig. 5.
Fig. 5.
FTH protects RPTEC from heme cytotoxicity. (A) Human RPTEC were transduced in vitro with Rec.Ad. (10 pfu/cell) encoding β-galactosidase (LacZ), human FTH, or mutated human FTH (FTHm) lacking ferroxidase activity and exposed to heme (5 µM) and/or H2O2 (50 µM). Cytotoxicity was measured using a 3-[4,5-dimethylthiazol-2-yl]-2,5-diphenyl-tetrazolium bromide-based cell viability assay, as detailed in SI Appendix. Data (mean ± SD) are from two independent experiments with a similar trend. (B) Relative expression of FTH and β-actin in human RPTEC transduced with LacZ, FTH, or FTHm Rec.Ad, detected by Western blot in one experiment representative of two with a similar trend. (C) ROS accumulation (mean ± SD) in human RPTEC exposed to heme (5 µM) and/or H2O2 (50 µM), detected using the CM-H2DCFDA probe. Data are from two independent experiments with a similar trend. (D) Time course of ROS accumulation (mean ± SD) in human RPTEC transduced and treated as in A. Data are from two independent experiments with a similar trend. (E) Quantification of data from D. AUC: area under the curve. P values in A determined using two-way ANOVA with Tukey’s multiple comparison test; in C and E using one-way ANOVA with Tukey’s multiple comparison test. NS, not significant; ***P < 0.001.
Fig. 6.
Fig. 6.
The transcription factor NRF2 protects from AKI and is essential to establish disease tolerance to Pcc infection. (A) Expression of Nqo1, Hmox1, Fth, and Slc40a1 normalized to Arbp0 mRNA in the kidneys of noninfected (NI) or Pcc-infected Nrf2+/+ and Nrf2−/− mice (n = 3–5 per group). Data are represented as mean expression relative to NI Nrf2+/+ mice ± SD from three independent experiments with a similar trend. (B) Survival of Pcc-infected Nrf2+/+ (n = 15) and Nrf2−/− mice (n = 15). Data are from three independent experiments with a similar trend. (C) Percentage of iRBC (mean ± SD) in Pcc-infected Nrf2+/+ (n = 10) and Nrf2−/− mice (n = 10). Data are from two independent experiments with a similar trend. (D) BUN (mean ± SD) in noninfected (NI) and 10 d after Pcc infection in Nrf2−/− (NI: n = 20; Pcc: n = 13) and control Nrf2+/+ (NI: n = 20; Pcc: n = 14) mice. Data from four independent experiments with similar trend. (E) Representative kidney H&E staining in noninfected and Pcc-infected Nrf2+/+ and Nrf2−/− mice 10 d after infection. Arrowheads indicate HB casts, and dashed lines outline tubular necrosis. Images representative of two independent experiments (n = 8–10 per genotype). (Scale bar: 50 μm.) P values in A and D determined using two-way ANOVA with Tukey’s multiple comparison test and in B using log-rank (Mantel–Cox) test. NS, not significant (P > 0.05); *P < 0.05; **P < 0.01; ***P < 0.001.

References

    1. Medzhitov R, Schneider DS, Soares MP. Disease tolerance as a defense strategy. Science. 2012;335:936–941. - PMC - PubMed
    1. Ferreira A, et al. Sickle hemoglobin confers tolerance to Plasmodium infection. Cell. 2011;145:398–409. - PubMed
    1. Råberg L, Sim D, Read AF. Disentangling genetic variation for resistance and tolerance to infectious diseases in animals. Science. 2007;318:812–814. - PubMed
    1. Francis SE, Sullivan DJ, Jr, Goldberg DE. Hemoglobin metabolism in the malaria parasite Plasmodium falciparum. Annu Rev Microbiol. 1997;51:97–123. - PubMed
    1. Sigala PA, Crowley JR, Hsieh S, Henderson JP, Goldberg DE. Direct tests of enzymatic heme degradation by the malaria parasite Plasmodium falciparum. J Biol Chem. 2012;287:37793–37807. - PMC - PubMed

Publication types

MeSH terms