. 2019 May 1;39(18):3561-3581.
doi: 10.1523/JNEUROSCI.1983-18.2019. Epub 2019 Mar 4.

Systems Analysis of the 22q11.2 Microdeletion Syndrome Converges on a Mitochondrial Interactome Necessary for Synapse Function and Behavior

Affiliations

Systems Analysis of the 22q11.2 Microdeletion Syndrome Converges on a Mitochondrial Interactome Necessary for Synapse Function and Behavior

Avanti Gokhale et al. J Neurosci. .

Abstract

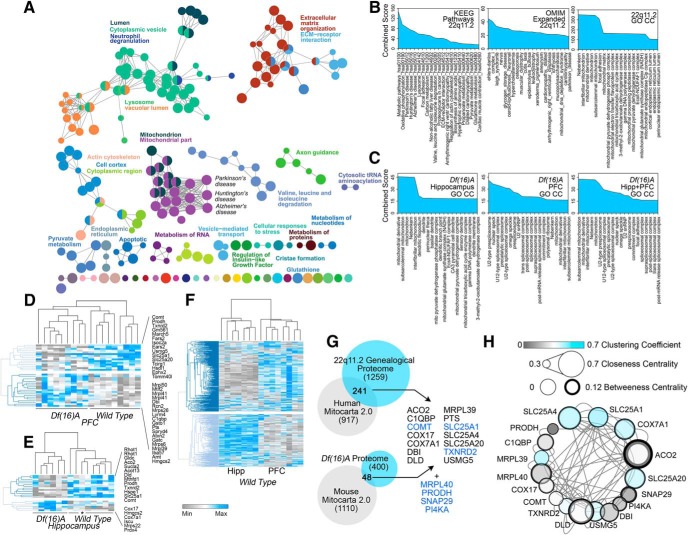
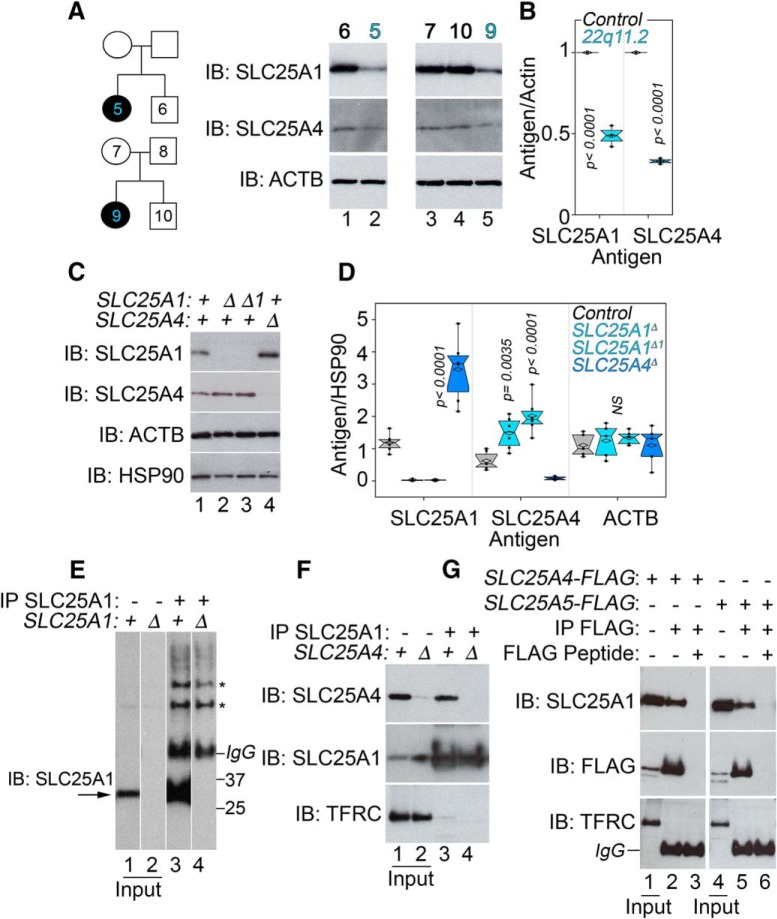
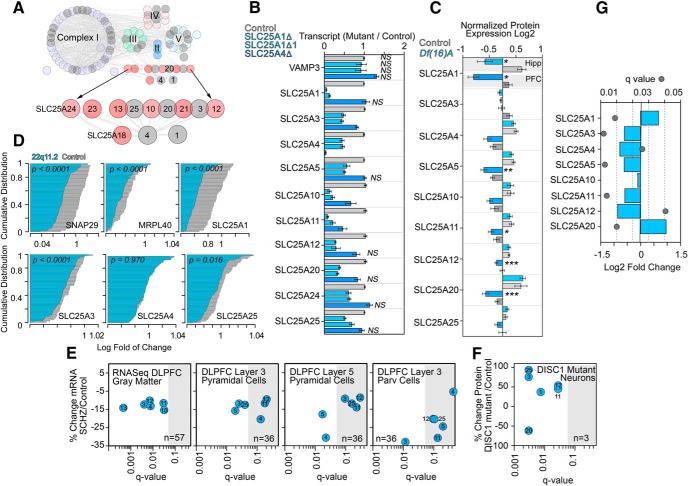
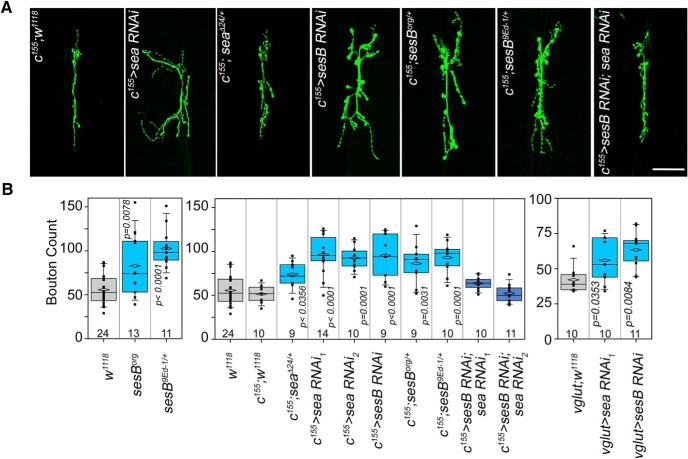
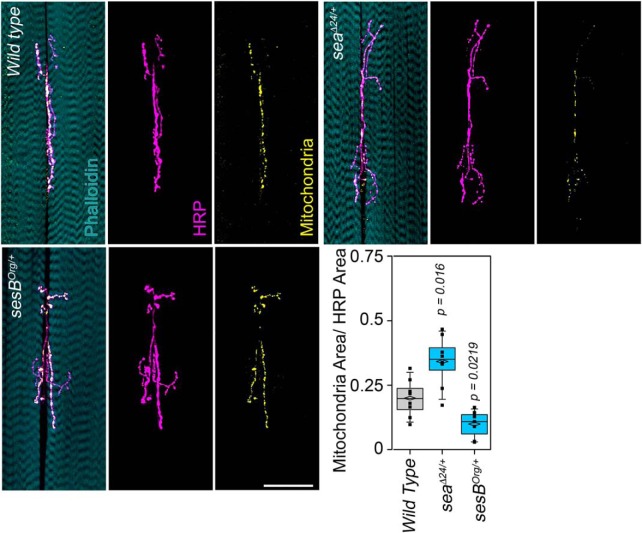
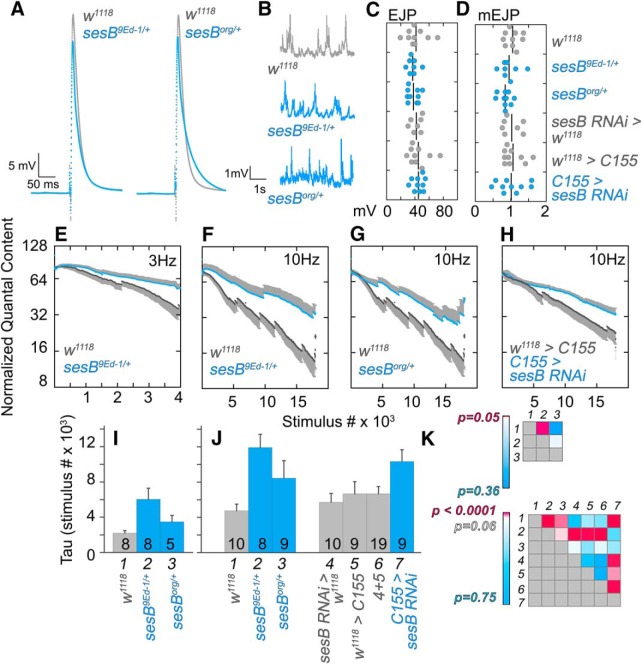
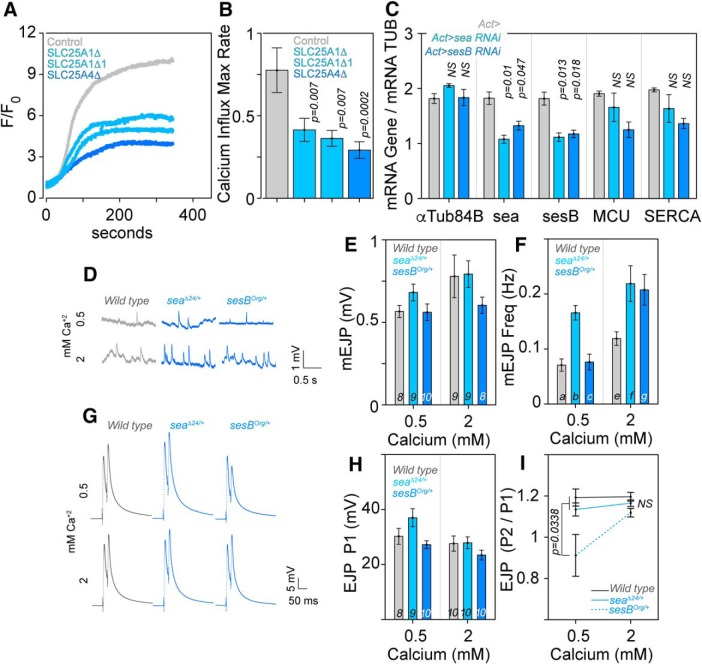
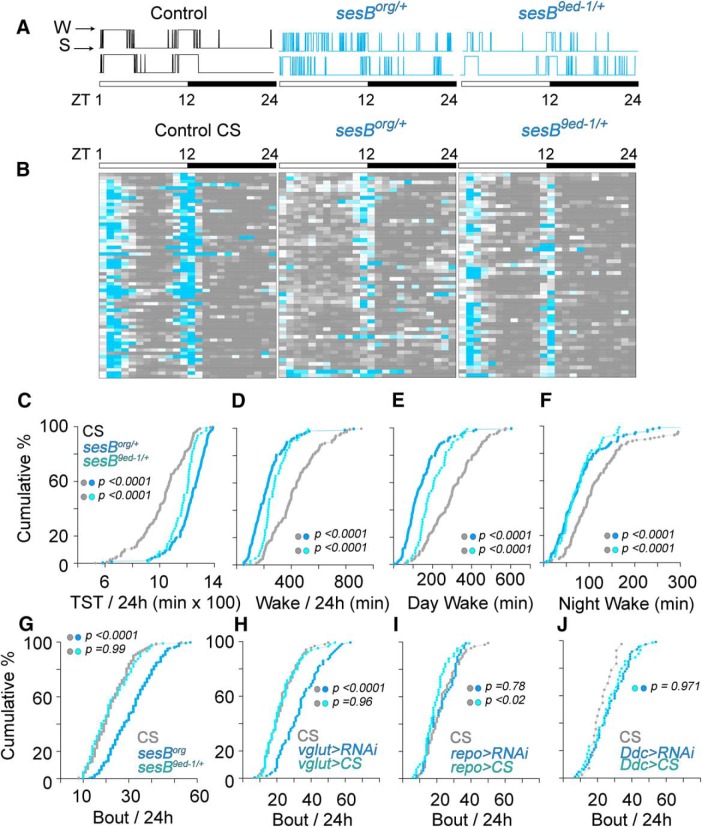
Neurodevelopmental disorders offer insight into synaptic mechanisms. To unbiasedly uncover these mechanisms, we studied the 22q11.2 syndrome, a recurrent copy number variant, which is the highest schizophrenia genetic risk factor. We quantified the proteomes of 22q11.2 mutant human fibroblasts from both sexes and mouse brains carrying a 22q11.2-like defect, Df(16)A+/- Molecular ontologies defined mitochondrial compartments and pathways as some of top ranked categories. In particular, we identified perturbations in the SLC25A1-SLC25A4 mitochondrial transporter interactome as associated with the 22q11.2 genetic defect. Expression of SLC25A1-SLC25A4 interactome components was affected in neuronal cells from schizophrenia patients. Furthermore, hemideficiency of the Drosophila SLC25A1 or SLC25A4 orthologues, dSLC25A1-sea and dSLC25A4-sesB, affected synapse morphology, neurotransmission, plasticity, and sleep patterns. Our findings indicate that synapses are sensitive to partial loss of function of mitochondrial solute transporters. We propose that mitoproteomes regulate synapse development and function in normal and pathological conditions in a cell-specific manner.SIGNIFICANCE STATEMENT We address the central question of how to comprehensively define molecular mechanisms of the most prevalent and penetrant microdeletion associated with neurodevelopmental disorders, the 22q11.2 microdeletion syndrome. This complex mutation reduces gene dosage of ∼63 genes in humans. We describe a disruption of the mitoproteome in 22q11.2 patients and brains of a 22q11.2 mouse model. In particular, we identify a network of inner mitochondrial membrane transporters as a hub required for synapse function. Our findings suggest that mitochondrial composition and function modulate the risk of neurodevelopmental disorders, such as schizophrenia.

Keywords: 22q11.2 microdeletion; SLC25A1; SLC25A4; mitochondria; schizophrenia; synapse.


Figures

Figure 1.
Figure 1.
Genealogical proteomics of 22q11.2 pedigrees fibroblasts using quantitative mass spectrometry. Human pedigrees of a control family (A) and families where one of the subjects is affected by 22q11.2 microdeletion syndrome and early childhood psychosis (A, E, G, blue numbers). Experimental design is designated at the top left corner of dot plots (B, F, H). For example, B shows a TMT experiment where proteomes from probands 1 and 2 were compared against unaffected individuals, Subjects 3, 11–16. C, Hierarchical clustering analysis of the proteome in Subjects 1–3 and 11–16. Euclidian distance clustering of columns and rows (4264 TMT protein quantitations) shows segregation of related family members. D, Dot plot of proteins encoded within the 22q11.2 chromosomal segment quantitated in TMT Experiment B. Asterisks denote significant differences p = 0.04146 to p < 0.0001, t test. B, F, H, Depictions of all mass spectrometry quantifications where the color code denotes individuals being compared (blue symbols are proteins whose expression is changed, gray symbols are unaffected proteins). Significant protein expression changes for: TMT and SILAC were considered to be >2 or <0.5, whereas in LFQ a −log(p) value threshold of 1.3 was used. I, The Venn diagram summarizes proteins with significant expression changes in B, F, and H. Asterisk denotes proteins whose expression changed in all patients. Bold font depicts proteins encoded within the 22q11.2 segment. Blue color fonts are proteins contained in the human Mitocarta 2.0 dataset. Individual MS/MS data can be found in Figure 1-2. Ontological comparisons among pedigrees and proteomic platforms can be found in Figure 1-1, and Figure 1-3.
Figure 2.
Figure 2.
Comparative bioinformatic analysis of the 22q11.2 and the Df(16)A+/− mouse brain proteomes. A, The 22q11.2 Proteome was analyzed with the engine ClueGo integrating the Cellular Component gene ontology GO CC, REACTOME, and KEGG databases. Functionally grouped network was built with terms as nodes and edges based on their term–term similarity statistics. The node size represents the term enrichment significance (p < 0.015 Bonferroni corrected). B, ENRICHR analysis of the 22q11.2 proteome querying GO CC, KEEG, and OMIM databases. C, ENRICHR analysis of the Df(16)A+/− mouse hippocampus and prefrontal cortex (PFC) proteomes as in B. Mouse brain proteomes were quantified using TMT mass spectrometry (Figure 2-4; n = 6 mutant and 5 control mice). DF, Differences in the mitoproteomes of wild-type and Df(16)A+/− mitoproteomes. Hierarchical clustering analysis of the Df(16)A+/− mouse hippocampus and prefrontal cortex mitochondrial proteome hits (D, E) compared with the wild-type mitoproteomes quantified in hippocampus (Hipp) and PFC. Kendall's tau distance clustering of columns and rows. E, The asterisk marks a wild-type animal. Figure 2-1 presents a similar analysis of mitochondrial transcriptomes in different Drosophila neurons. G, Venn diagrams present overlapping protein hits between the 22q11.2 and Df(16)A+/− proteome with the human and mouse Mitocarta 2.0 datasets. Listed proteins correspond to mitochondrial proteins whose expression is sensitive to the microdeletion in human and mouse (top two columns). Lower column and blue font proteins are encoded in the 22q11.2 chromosomal segment. Comparisons with previous Df(16)A+/− proteome are depicted in Figure 2-2. H, SLC25A1 and SLC25A4 are high-connectivity nodes in a discrete 22q11.2 and Df(16)A+/− mitoproteome interactome. In silico interactome of protein hits listed in G. Interactome was analyzed with graph theory to determine high-connectivity nodes predictive of essential genes. Additional bioinformatic data and MS/MS data can be found in Figure 2-3, and Figure 2-4.
Figure 3.
Figure 3.
SLC25A1 and SLC25A4 expression is affected by the 22q11.2 microdeletion and these transporters biochemically and genetically interact. A, Human pedigrees of families affected by 22q11.2 microdeletion syndrome. Immunoblots of total cellular lysates from fibroblasts obtained from individuals in pedigrees. B, Quantitation of results shown in A. P values, one-way ANOVA followed by Dunnett's multiple comparisons; n = 3. C, SLC25A1 and SLC25A4 expression changes in cells carrying null mutations (Δ) in SLC25A1 or SLC25A4 clonal cell lines. Detergent-soluble cell extracts were blotted with indicated antibodies. Actin (ACTB) and HSP90 were used as controls. D, Depicts quantitation of expression levels compared with wild-type cells. P values, one-way ANOVA followed by Dunnett's multiple comparisons; n = 5. E, SLC25A1 antibody precipitates an SLC25A1-immunoreactive band (lane 3) absent from SLC25A1-null cells (lane 4). Asterisks denote nonspecific bands recognized by the antibody. F, SLC25A1 antibody precipitates an SLC25A4-immunoreactive band (lane 3) absent from SLC25A4-null cells (lane 4). G, FLAG-tagged SLC25A4 or SLC25A5 precipitate SLC25A1 (lames 2 and 5). Lanes 1 and 3 correspond to inputs. Lanes 4 and 6 correspond to immunoprecipitation where an excess FLAG peptide was used for out-competition. F, G, Transferrin receptor (TFRC) was used as a control for nonspecific membrane protein precipitation.
Figure 4.
Figure 4.
Expression of components of the SLC25A1-SLC25A4 interactome is affected in neurodevelopmental disorders. A, Comprehensive in silico interactome of the SLC25A1 and SLC25A4 mitochondrial transporters. Complexes I to V of the respiratory chain as well as SLC25A transporter family members are color coded. All nodes colored gray represents hits in the 22q11.2 proteome. Additional details can be found in Figure 4-1. B, Expression of SLC25A transporter family member transcripts is altered in SLC25A1 or SLC25A4-null cells. Transcript quantification by qRT-PCR is expressed as a ratio to vimentin mRNA. VAMP3 was used as control. n = 4; one-way ANOVA followed by Fisher's least significant difference comparison. All nonsignificant comparisons are marked (NS). C, Expression of SLC25A transporter family member polypeptides is altered in Df(16)A+/− mouse hippocampus (Hipp) or prefrontal cortex (PFC). SLC25A transporters were quantitated by TMT mass spectrometry. n = 6 mutant and 5 control mice; one-way ANOVA followed by Fisher's least significant difference comparison. *p ≤ 0.0001, **p = 0.0098, ***p ≤ 0.028. D, Expression of SLC25A family member mRNAs is reduced in whole blood from unaffected and 22q11.2 patients. Probability plots of mRNA quantified by microarray on 50 unaffected (gray) and 77 22q11.2 patients (blue). SNAP29, MRPL40, and SLC25A1 reside in the 22q11.2 microdeletion locus and were used as controls to determine the range of expression change attributable to the microdeletion. SLC25A3 and SLC25A25 expression is modified within this range. P values were calculated using Kolmogorov–Smirnov test. E, mRNA expression of SLC25A transporters in gray matter or single cells isolated from unaffected and schizophrenia cases. Gray matter mRNA quantitations were performed by RNAseq, whereas single-cell mRNA quantitations were performed by microarray in dorsolateral prefrontal cortex (DLPFC) samples. F, Proteomic quantitation of SLC25A transporters in iPSC-derived cortical neurons from DISC-1 mutant patient and isogenic controls. E, F, SLC25A transporter family members SLC25An where n correspond to the number on blue circle. Gray box denotes nonsignificant changes in expression after multiple corrections. G, mRNA expression of SLC25A transporter family members is altered in schizophrenia brains. Meta-analysis data obtained from Gandal et al. (2018).
Figure 5.
Figure 5.
Reduced expression of Drosophila dSLC25A1-dSLC25A4 alters synapse morphology. A, B, Muscle VI–VII third instar neuromuscular junctions were stained with antibodies against the neuronal marker HRP. Expression of SLC25A1 (sea, scheggia) was downregulated with two RNAi transgenes or the null allele seaΔ24/+. dSLC25A4 expression was reduced with a RNAi transgene or two genomic alleles (sesBorg and sesB9Ed-1/+). Neuronal-specific expression of RNAi regents was driven by the elavc155-GAL4 (c155) or Vglut-GAL4 drivers. The w1118, w1118; elavc155-GAL4 or w1118; Vglut-GAL4 animals were used as controls. Scale bar, 50 μm. B, Shows quantitation of bouton counts per synapse. Counts were performed blind to the animal genotype. All comparisons in B were performed with one-way ANOVA followed by Bonferroni's multiple comparison. Number of animals is at the bottom of each box. Analysis of ATP–ADP ratios in tissues from mutant animals can be found in Figure 5-1.
Figure 6.
Figure 6.
Drosophila SLC25A1-sea and SLC25A4-sesB are required for maintaining the synapse mitochondrial pool. Triple-stained muscle VI–VII third instar neuromuscular junctions from elavc155-GAL4;w1118 wild-type larvae (n = 8) or elavc155-GAL4 crossed to either seaΔ24/+ (n = 8) or sesBOrg/+ (n = 7) were imaged by confocal microscopy. Cyan marks muscle with phalloidin, magenta marks neuronal plasma membrane with HRP antibodies, and yellow mitochondria with the UAS-mitochondria-GFP transgene. Boxplot depicts the ratio between the mitochondrial signal and the HRP signal. Comparisons between genotypes were performed with one-way ANOVA followed by Fisher's multiple comparison. Scale bar, 50 μm.
Figure 7.
Figure 7.
Hemideficiency of the Drosophila SLC25A4-sesB alters synapse function. Muscle VI–VII third instar neuromuscular junctions from w1118 control (gray traces) and sesB mutants (blue traces) were analyzed for evoked (A, EJP) and spontaneous neurotransmission (B, mEJP). C, D, Amplitudes as dot plots with each dot corresponding to one animal. Lines depict the mean of the sample. E, Neuromuscular junctions stimulated at low-frequency (3 Hz; E) and high-frequency (10 Hz; FH) in the presence of 1 μm bafilomycin A1 to assess recycling and reserve pools of synaptic vesicles. EH, Control animals shown as black symbols (E-G, w1118; H, w1118>C155), blue symbols show sesB mutants (F, G), and neuronal-specific sesB RNAi (H, C155>sesB RNAi). Average ± SEM. I, J, Quantitation of graphs EH as time (measured as stimulus number) to 50% depletion (Tau) compared with response at time/stimulus 0. I, Corresponds to synapses stimulated at 3 Hz, recycling pool of vesicles, whereas J shows results for synapses stimulated at 10 Hz, reserve pool of vesicles. Number of animal is shown in the bottom bar. Average ± SEM. K, Tau statistical differences among genotypes at 3 Hz (top) and 10 Hz (bottom) represented as heat maps. Italic numbers depict genotypes in I and J. All comparisons in I and J were performed with one-way ANOVA followed by Fisher's multiple comparison.
Figure 8.
Figure 8.
SLC25A1 and SLC25A4 are necessary for calcium homeostasis. A, Representative traces of mitochondrial Ca2+ uptake in permeabilized Hap1 cells challenged with 5 μm free Ca2+. Mitochondrial Rhod2 fluorescence (F/F0) was measured as function of time (seconds). B, Quantification of the maximal rates of mitochondrial calcium influx ΔF/F0/s in control and mutant Hap1 cell lines. Comparisons between genotypes were performed with one-way ANOVA followed by Fisher's multiple comparisons. C, qRT-PCR quantification of transcripts (x-axis) in Drosophila heads of control animals carrying the Actin-Gal4 driver alone or in combination with the UAS-RNAi for SLC25A1-sea or SLC25A4-sesB transgenes (n = 4, one-way ANOVA followed by Fisher's least significant difference comparison). D, mEJPs traces, (E) amplitudes, and (F) frequency at low and high extracellular calcium. The number of animals listed at the base of columns in E applies to F, and genotypes are listed on top of traces. E, P values for columns listed with italics at the base were determined by between-subjects ANOVA followed by Bonferroni–Dunn test: comparison a and b = 0.0014, a to c = 0.8421, e to f = 0.0008, e to g = 0.0026, f to g = 0.6967. G, PPF traces at low and high calcium concentrations. H, Amplitude of the first EJP (P1). The number of animals listed at the base of columns in H applies to I, and genotypes are listed on top of traces. I, Ratios of the two pulses. P values were determined by between-subjects ANOVA followed by Bonferroni–Dunn test.
Figure 9.
Figure 9.
The Drosophila SLC25A4 orthologue, sesB, is required in glutamatergic neurons for sleep. A, Individual hypnograms of two Canton S control and two sesB mutant flies illustrate sleep–wake activity patterns across the 12 h light (zeitgeber times ZT1–ZT12) and 12 h dark (zeitgeber times ZT12–ZT24) periods. B, Heat map of sleep–wake activity (gray and teal, respectively) in Canton S control (n = 229), sesorg (n = 234), and sesB9ed-1/+ (n = 53) depict the activity for each animal averaged across 1 h bins. Each column is 1 zeitgeber hour and each row an animal. CG, Probability plots of sleep parameters per 24 h (C, D, G) or 12 h light/dark periods (E, F) from animals depicted in B. TST, Total sleeping time. H, The number of sleep bouts per 24 h is increased by sesB RNAi targeted to glutamatergic neurons (CS = 78, VGlut>CS = 72, VGlut>RNAi = 82 animals) but neither in (I) glial cells (CS = 78, repo>CS = 53, repo>RNAi = 59 animals), nor (J) catecholaminergic neurons (CS = 21, Ddc>CS = 37, Ddc>RNAi = 56 animals). CJ, P values were estimated with the Kolmogorov–Smirnov test. Similar analysis in sea RNAi animals is presented in Figure 9-1.

Similar articles

Cited by

References

    1. Anders S, Pyl PT, Huber W (2015) HTSeq: a python framework to work with high-throughput sequencing data. Bioinformatics 31:166–169. 10.1093/bioinformatics/btu638 - DOI - PMC - PubMed
    1. Andrews S. (2010) FASTQC: a quality control tool for high throughput sequence data. Available at: http://www.bioinformatics.babraham.ac.uk/projects/fastqc.
    1. Anglin RE, Tarnopolsky MA, Mazurek MF, Rosebush PI (2012a) The psychiatric presentation of mitochondrial disorders in adults. J Neuropsychiatry Clin Neurosci 24:394–409. 10.1176/appi.neuropsych.11110345 - DOI - PubMed
    1. Anglin RE, Garside SL, Tarnopolsky MA, Mazurek MF, Rosebush PI (2012b) The psychiatric manifestations of mitochondrial disorders: a case and review of the literature. J Clin Psychiatry 73:506–512. 10.4088/JCP.11r07237 - DOI - PubMed
    1. Arion D, Corradi JP, Tang S, Datta D, Boothe F, He A, Cacace AM, Zaczek R, Albright CF, Tseng G, Lewis DA (2015) Distinctive transcriptome alterations of prefrontal pyramidal neurons in schizophrenia and schizoaffective disorder. Mol Psychiatry 20:1397–1405. 10.1038/mp.2014.171 - DOI - PMC - PubMed

Publication types

MeSH terms

Supplementary concepts