. 2019 May 15;39(20):3812-3831.
doi: 10.1523/JNEUROSCI.2130-18.2019. Epub 2019 Mar 4.

Intracellular Zn2+ Signaling Facilitates Mossy Fiber Input-Induced Heterosynaptic Potentiation of Direct Cortical Inputs in Hippocampal CA3 Pyramidal Cells

Affiliations

Intracellular Zn2+ Signaling Facilitates Mossy Fiber Input-Induced Heterosynaptic Potentiation of Direct Cortical Inputs in Hippocampal CA3 Pyramidal Cells

Kisang Eom et al. J Neurosci. .

Abstract

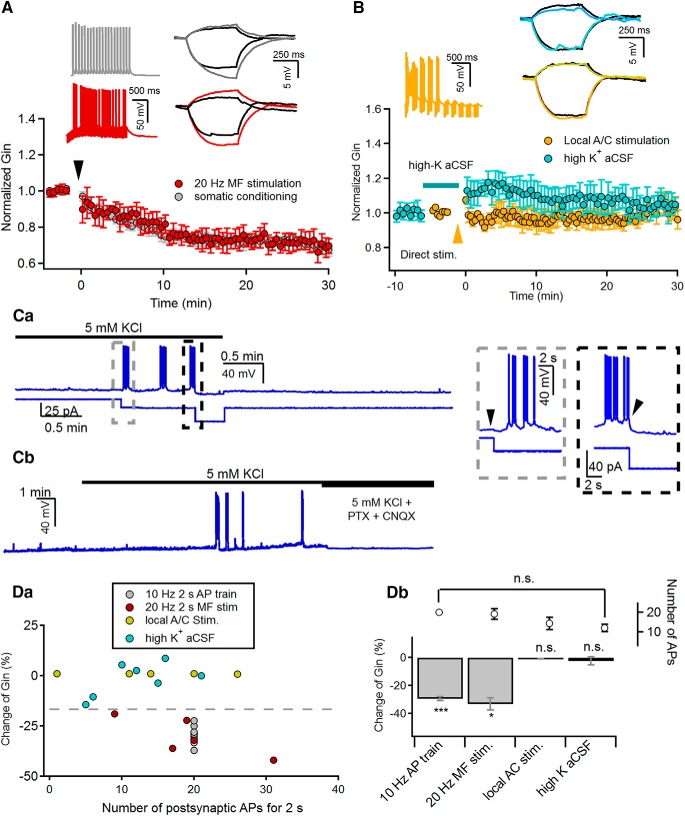
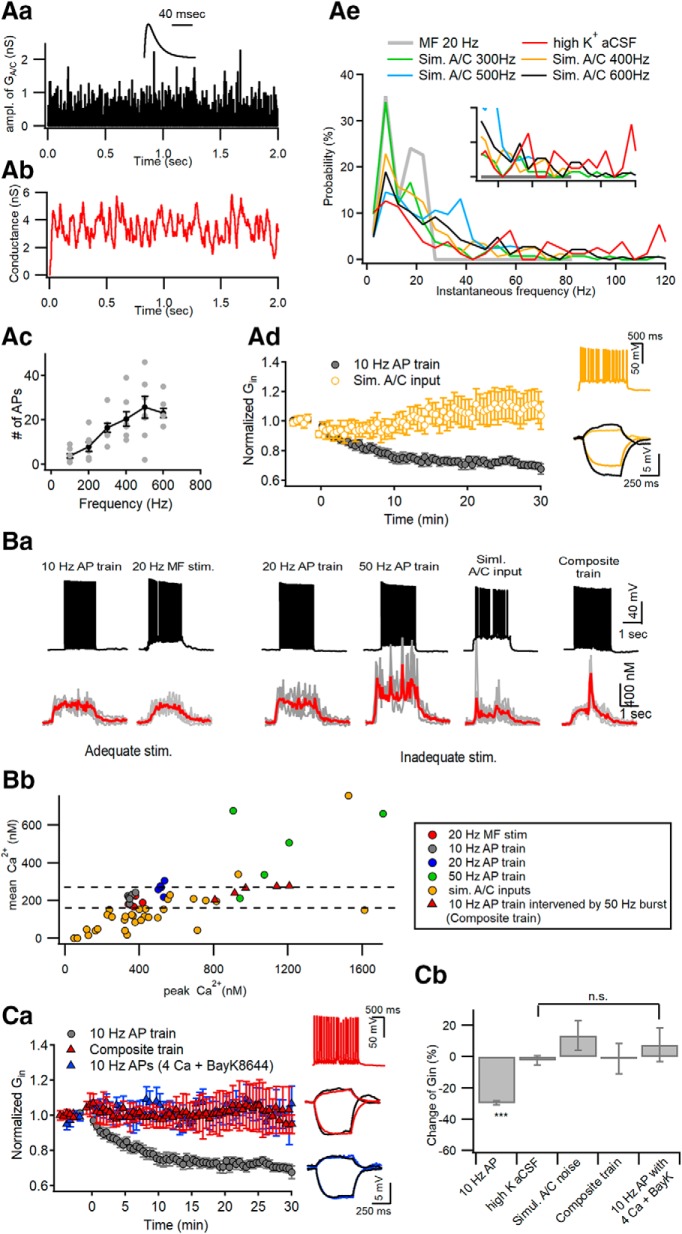
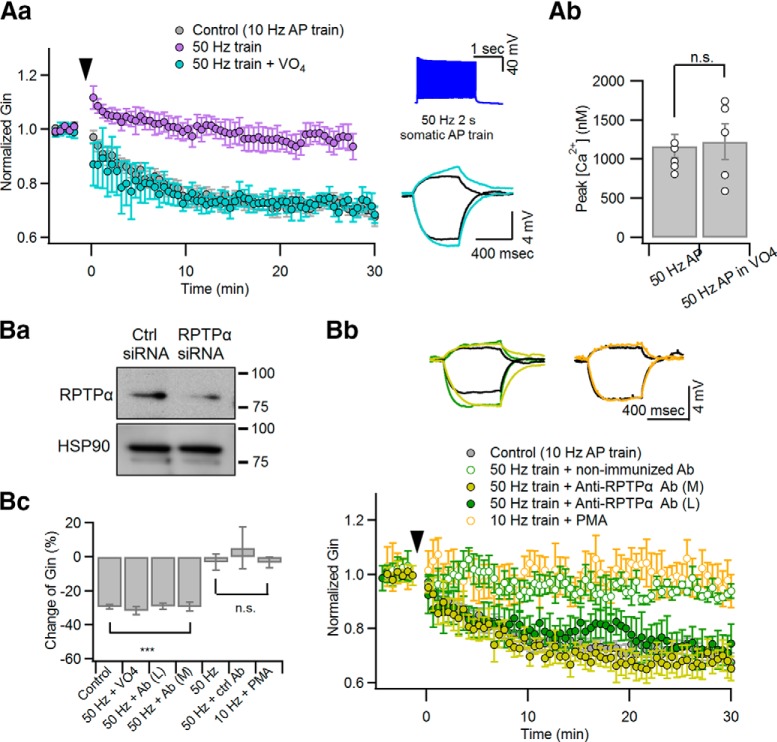
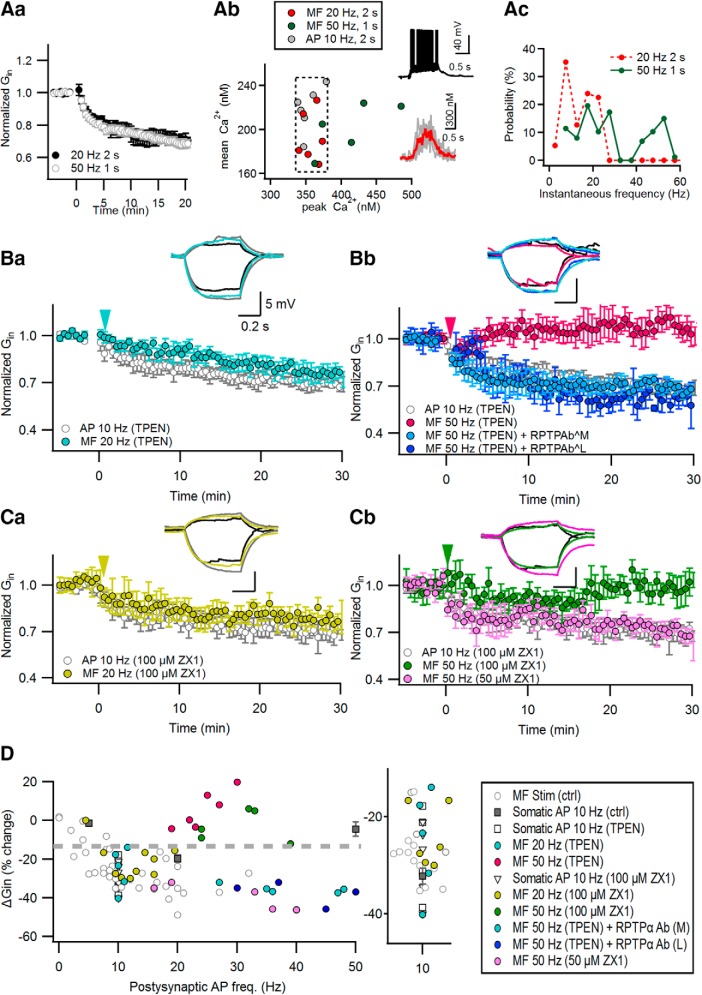
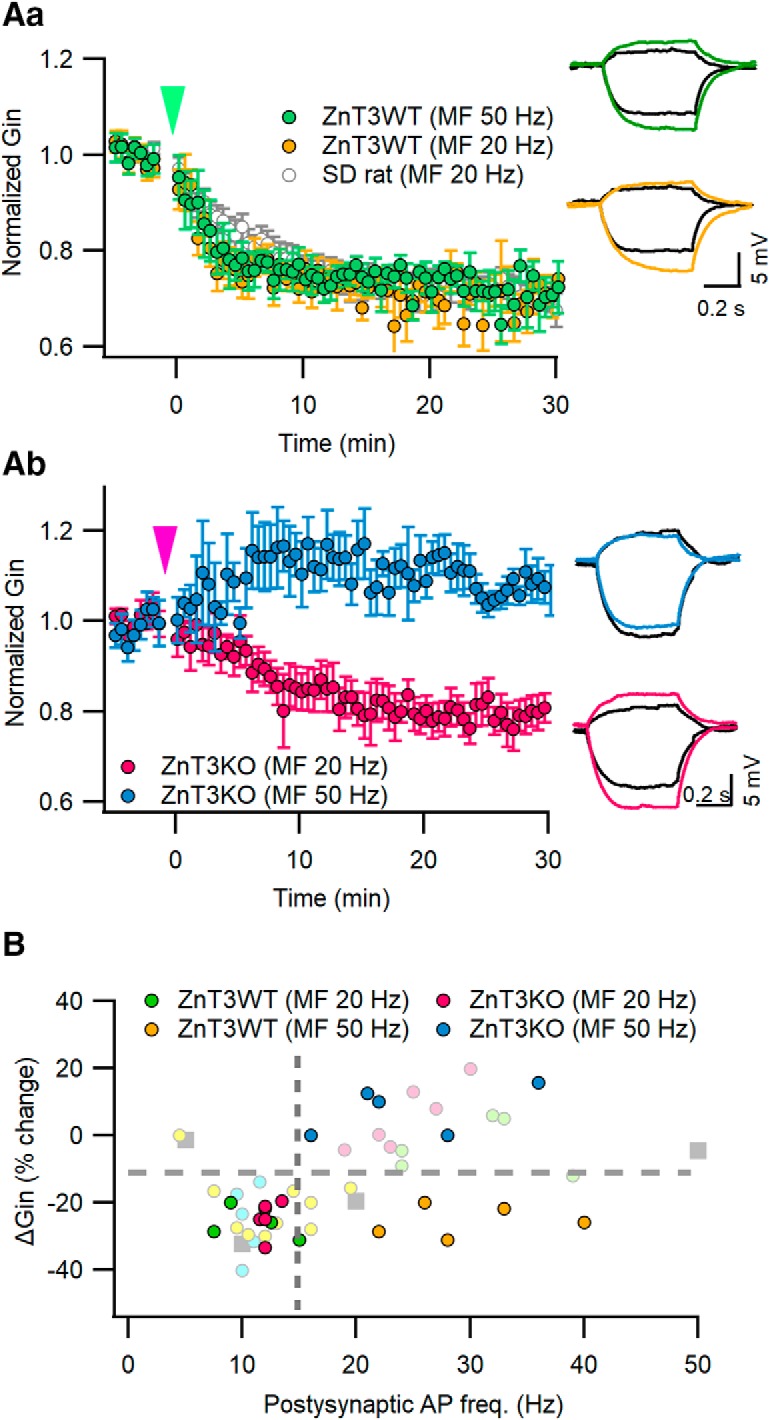
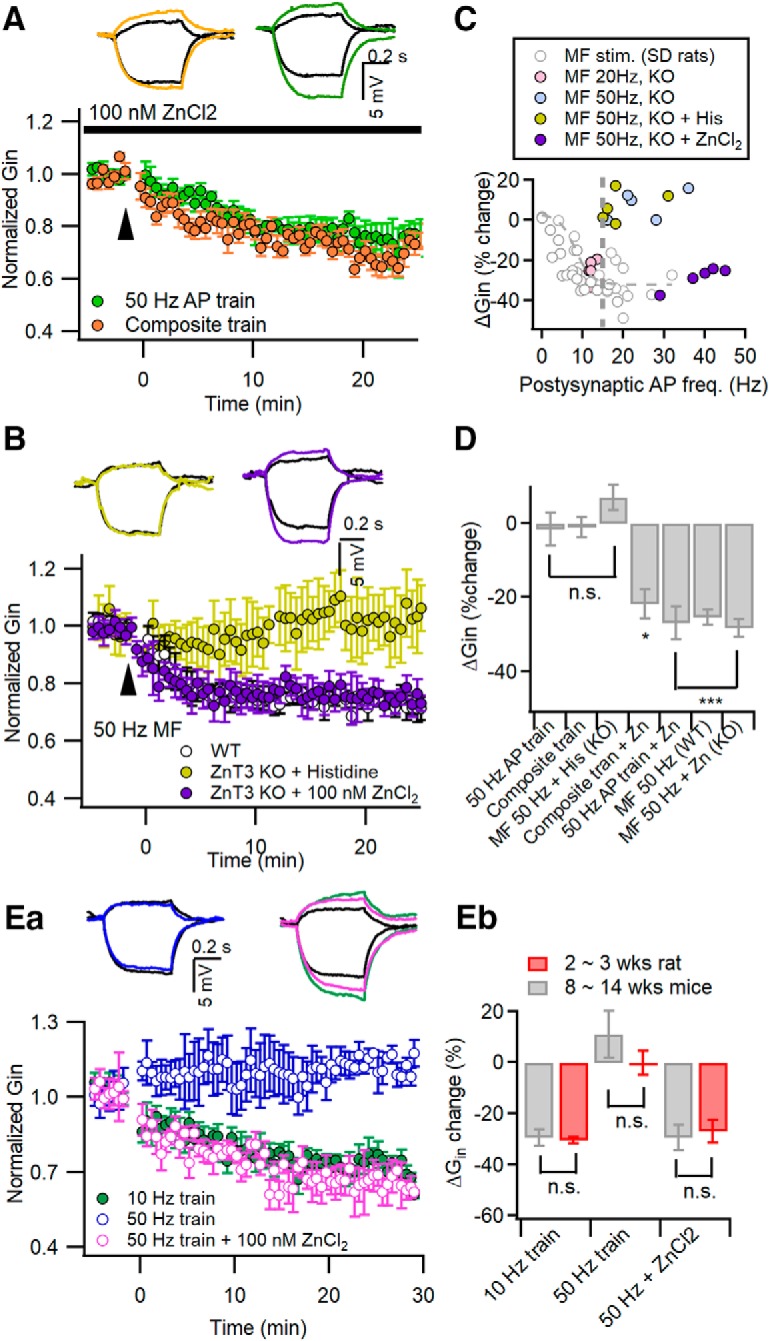
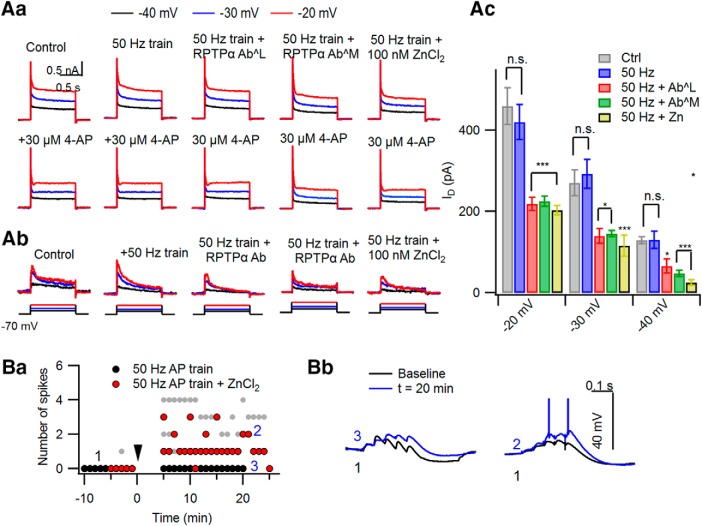
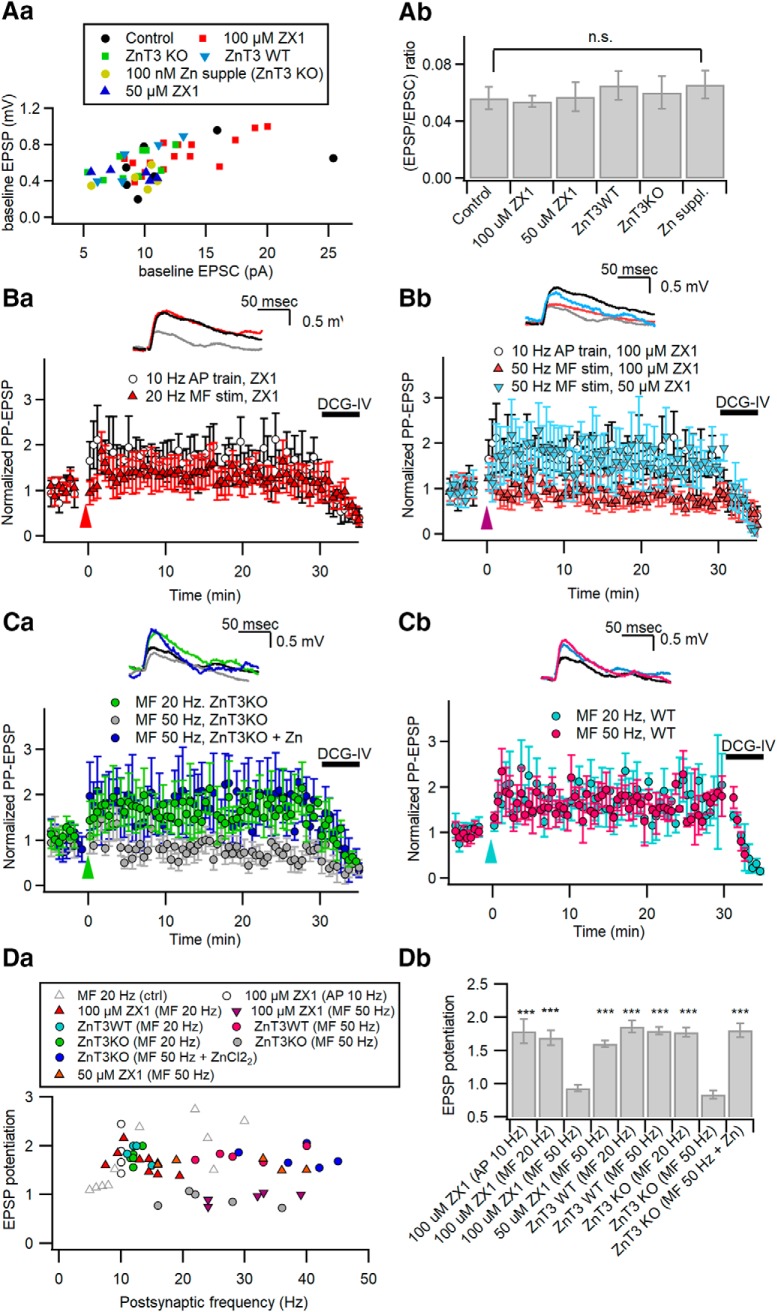
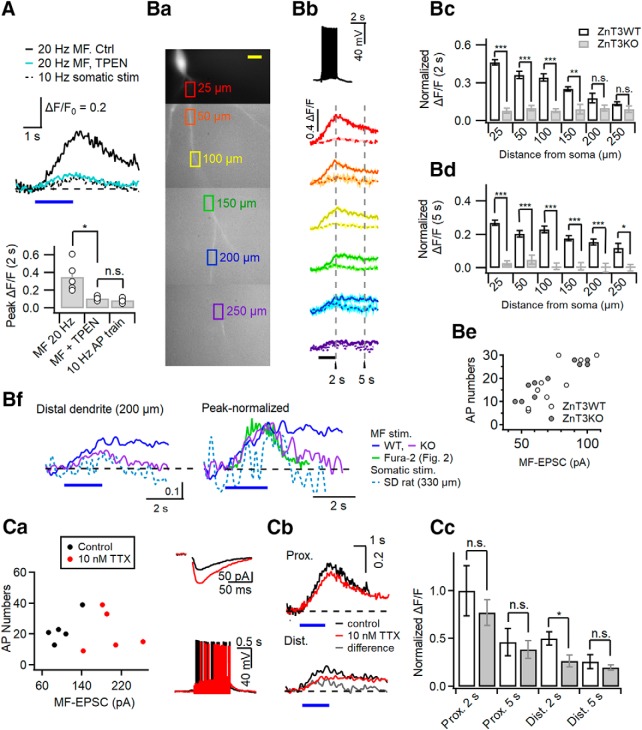
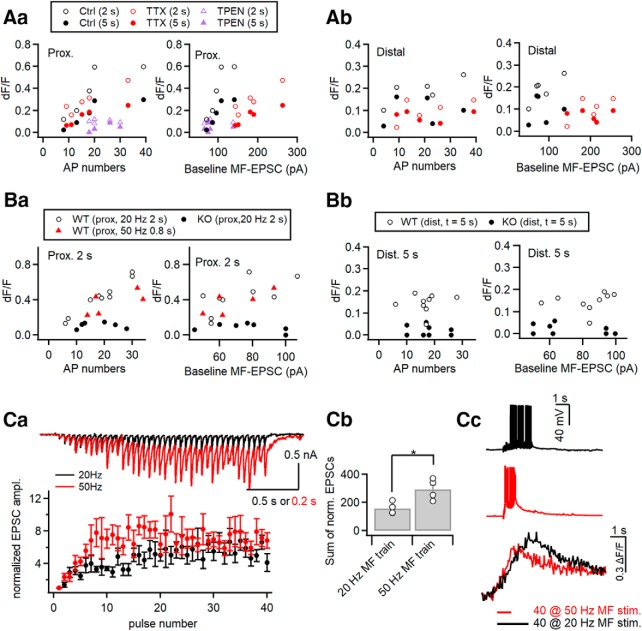
Repetitive action potentials (APs) in hippocampal CA3 pyramidal cells (CA3-PCs) backpropagate to distal apical dendrites, and induce calcium and protein tyrosine kinase (PTK)-dependent downregulation of Kv1.2, resulting in long-term potentiation of direct cortical inputs and intrinsic excitability (LTP-IE). When APs were elicited by direct somatic stimulation of CA3-PCs from rodents of either sex, only a narrow window of distal dendritic [Ca2+] allowed LTP-IE because of Ca2+-dependent coactivation of PTK and protein tyrosine phosphatase (PTP), which renders non-mossy fiber (MF) inputs incompetent in LTP-IE induction. High-frequency MF inputs, however, could induce LTP-IE at high dendritic [Ca2+] of the window. We show that MF input-induced Zn2+ signaling inhibits postsynaptic PTP, and thus enables MF inputs to induce LTP-IE at a wide range of [Ca2+]i values. Extracellular chelation of Zn2+ or genetic deletion of vesicular zinc transporter abrogated the privilege of MF inputs for LTP-IE induction. Moreover, the incompetence of somatic stimulation was rescued by the inhibition of PTP or a supplement of extracellular zinc, indicating that MF input-induced increase in dendritic [Zn2+] facilitates the induction of LTP-IE by inhibiting PTP. Consistently, high-frequency MF stimulation induced immediate and delayed elevations of [Zn2+] at proximal and distal dendrites, respectively. These results indicate that MF inputs are uniquely linked to the regulation of direct cortical inputs owing to synaptic Zn2+ signaling.SIGNIFICANCE STATEMENT Zn2+ has been mostly implicated in pathological processes, and the physiological roles of synaptically released Zn2+ in intracellular signaling are little known. We show here that Zn2+ released from hippocampal mossy fiber (MF) terminals enters postsynaptic CA3 pyramidal cells, and plays a facilitating role in MF input-induced heterosynaptic potentiation of perforant path (PP) synaptic inputs through long-term potentiation of intrinsic excitability (LTP-IE). We show that the window of cytosolic [Ca2+] that induces LTP-IE is normally very narrow because of the Ca2+-dependent coactivation of antagonistic signaling pairs, whereby non-MF inputs become ineffective in inducing excitability change. The MF-induced Zn2+ signaling, however, biases toward facilitating the induction of LTP-IE. The present study elucidates why MF inputs are more privileged for the regulation of PP synapses.

Keywords: CA3; hippocampus; intrinsic plasticity; mossy fiber; protein tyrosine phosphatase; zinc.


Figures

Figure 1.
Figure 1.
A/C synaptic inputs are incapable of inducing LTP-IE of CA3-PCs. A, Induction of LTP-IE by the repetitive somatic firing at 10 Hz (gray) or 20 Hz MF stimulation (red) for 2 s delivered at 0 s. B, Neither local electrical stimulation of A/C fibers (orange) nor high-K+ aCSF (cyan) induced the LTP-IE of CA3-PCs. Electrical stimulation was delivered at 0 min. To enhance A/C fiber inputs, high-K+ aCSF containing 2 μm DCG-IV was applied as indicated by the horizontal bar. A, B, Insets, Representative traces for AP responses (left panels) to conditioning stimulations, and subthreshold voltage responses (right panels) to +30 and −10 pA recorded before (black) and 30 min after conditioning (colored). The conditioning methods are indicated by the same color code in each panel. Ca, Representative traces for membrane potential during and after applying high-K aCSF, which contained 2 μm DCG-IV to suppress MF and PP synaptic inputs (see Materials and Methods). Membrane potential (top) and current injection (bottom) are depicted on the same time axis. The gray and black boxed regions are expanded in time on the inset. To readjust the membrane potential depolarized by high-K+ aCSF to the control level, hyperpolarizing current was injected (gray box, left inset). After a sufficient number of APs were elicited, the generation of APs was stopped by the injection of additional hyperpolarizing current (black box, right inset) The current injection time points are indicated by arrowheads. Cb, Application of synaptic blockers (PTX and CNQX) completely abolished not only the firing of CA3-PCs, but also subthreshold synaptic responses caused by high-K+ aCSF. Da, Relative changes of Gin (ΔGin) as a function of somatic AP frequency elicited by conditioning stimuli (gray, 10 Hz 2 s AP train; red, 20 Hz 2 s MF stimulation; yellow, local stimulation of A/C fibers; cyan, high-K+ aCSF). Db, Summary for ΔGin measured at 30 min after indicated conditioning. The number of APs elicited by each conditioning are also shown. n.s., No statistical significance. *p < 0.05; ***p < 0.005.
Figure 2.
Figure 2.
Optimal [Ca2+]i window at distal apical dendrites for induction of LTP-IE. Aa, Simulation of Poisson random arrivals of A/C synaptic inputs at the mean frequency of 400 Hz. The amplitude of synaptic conductance was assumed to follow a log normal distribution with a mean and SD of 0.49 and 0.5, respectively. Inset, Template waveform of uEPSG at A/C–CA3 synapses. Ab, The conductance waveform for simulated A/C inputs, which was constructed from convolution of the events of A/C inputs with the uEPSG waveform shown in Aa. Ac, The number of APs as a function of mean frequencies of simulated A/C inputs for 2 s. Ad, Simulated A/C inputs for 2 s delivered to the soma at 0 s did not reduce Gin (yellow symbols). For comparison, Gin changes caused by somatic conditioning are plotted again from Figure 1Aa (gray). Inset, Representative AP responses to the simulated A/C inputs (top) and the subthreshold voltage responses to injection of +30 and −10 pA for 0.5 s (bottom). Ae, Probability distributions for instantaneous frequencies of APs elicited by 20 Hz MF stimulation, high-K+ aCSF, and simulated A/C inputs at 300–600 Hz. The distributions for the first two conditionings are based on data from Figure 1. Note that high-frequency AP bursts exceeding 30 Hz are generated by high-K aCSF or simulated A/C inputs, but not by 20 MF stimulation. The inset is the same plot expanded in y-axis. Ba, Somatic AP responses (top) and distal dendritic CaTs (bottom) evoked by different conditioning protocols, which are categorized by capability for the induction of LTP-IE (adequate or inadequate stimulations). In each panel of CaT, an averaged trace (red) is overlapped on raw CaTs evoked by the same stimulation protocol in different cells (gray). Composite AP train, somatic 10 Hz AP train intervened by 5 APs at 50 Hz in the middle. Bb, For all individual CaTs evoked by different stimulations, their time-averaged [Ca2+] levels are plotted as a function of their peak [Ca2+] levels. Note that CaTs evoked by adequate stimulations (gray and red filled symbols) are found within a narrow window of peak [Ca2+] levels between 338 and 378 nm, and do not overlap with CaTs induced by inadequate stimuli. Ca, To elicit excessive [Ca2+]i elevation, CA3-PCs were stimulated at 0 s with a composite AP train under standard aCSF (red triangle) or a 10 Hz AP train in the presence of extracellular 4 mm Ca2+ and 10 μm BayK8644 (blue triangle). Neither reduced the Gin of CA3-PCs, in contrast to somatic conditioning (10 Hz AP train for 2 s, gray; replotted from Fig. 1A). Insets, Representative AP responses to a composite train (top) and subthreshold voltage responses to current injection for measuring Gin (middle and bottom; black, before conditioning; color, 30 min after conditioning). Cb, Summary for mean ΔGin measured at 30 min after different conditionings. The ΔGin values for the first two conditionings (10 Hz AP train and high-K+ aCSF) are repeated from Figure 1D for statistical comparison. n.s., No statistical significance. ***p < 0.005.
Figure 3.
Figure 3.
Inhibition of PTP enables inadequate stimulation to induce LTP-IE. Somatic current pulse injection for 2 s, which elicits a 50 Hz AP train, was used as an inadequate conditioning stimulation. For inhibition of PTP, 100 μm Na3VO4 or anti-RPTPα antibody (1 μg/ml) was added to the whole-cell patch pipette. Aa, Relative changes of Gin caused by a 50 Hz AP train was delivered at 0 s with (cyan) or without (purple) Na3VO4 in the patch pipette. The LTP-IE caused by the 50 Hz AP train in the presence of intracellular Na3VO4 was similar to the somatic conditioning (10 Hz for 2 s, gray), which was reproduced from Figure 1A for comparison. Insets, AP responses to 50 Hz 2 s somatic AP train (top) and subthreshold voltage responses for measuring Gin with the same color code as the main panel (bottom; black, control). Ab, The peak values for distal dendritic [Ca2+]i evoked by a 50 Hz AP train are compared between conditions with or without intracellular Na3VO4. Ba, Test for specificity of the anti-RPTPα antibody. Ctrl siRNA, Nontargeting siRNA; RPTPα siRNA, RPTPα-targeting siRNA. Bb, Relative changes of Gin caused by a 50 Hz AP train with intracellular application of anti-RPTPα antibody (green filled symbols) or isotype antibody (green open symbols). In addition, the effects of PMA on Gin changes after a 10 Hz AP train are superimposed (orange). For comparison, somatic conditioning-induced ΔGin (gray) was reproduced from Figure 1A. Insets, Subthreshold voltage responses for measuring Gin with the same color codes as the main panel. Bc, Summary for ΔGin measured at 30 min after different conditionings: 10 Hz AP train (control), 50 Hz AP train (50 Hz), 50 Hz AP train with intracellular Na3VO4 (50 Hz + VO4), anti-RPTPα AbL (50 Hz + AbL), anti-RPTPα AbM (50 Hz + AbM), non-immunized Ab (50 Hz + ctrl Ab) and 10 Hz AP in the presence of PMA (10 Hz + PMA). n.s., No statistical significance. ***p < 0.005.
Figure 4.
Figure 4.
Zn2+ released from MF terminals is responsible for the robustness of MF inputs in LTP-IE induction. Aa, The 50 Hz MF stimulation (for 1 s) reduced the Gin of postsynaptic CA3-PCs, similar to the 20 Hz MF stimulation (for 2 s; reproduced from Fig. 1A). Ab, The 50 Hz MF stimulation-induced CaTs at distal apical dendrites are plotted on the mean vs peak [Ca2+]i plane. Data for CaTs evoked by somatic conditioning or 20 Hz MF train are reproduced from Figure 2Bb. The broken line box indicates the optimal Ca2+ window into which adequate CaTs fell. Insets, Representative somatic voltage response (top) and distal dendritic CaTs (bottom) to 50 Hz MF stimulation. Raw (gray) and averaged (red) CaTs are overlapped in the bottom. Ac, Probability distribution for instantaneous AP frequency evoked by MF stimulation. B, C, Relative Gin changes caused by MF stimulation at 20 Hz (2 s; Ba, Ca), 50 Hz (1 s; Bb, Cb), and in the presence of 1 μm TPEN (B) or ZX1 (C) in bathing solution. As a control, we observed the Gin time profiles upon somatic conditioning (10 Hz AP; gray) in the presence of 1 μm TPEN (B) or ZX1 (C) in bathing solution. Conditioning stimuli were delivered at 0 min (arrowheads). In the presence of TPEN, anti-RPTPa AbM or anti-RPTPa AbL was intracellularly perfused to block RPTPα (Bb). Insets, Representative subthreshold voltage responses before (black) and 30 min after MF stimulation (colored) or somatic conditioning (gray). Calibration: 5 mV, 0.2 s. D, Relative changes of Gin as a function of postsynaptic AP frequencies. Color codes are the same as in AC. The data for ΔGin caused by MF and somatic stimulations under control conditions (gray symbols) are reproduced from our previous reports (Hyun et al., 2013, 2015). Inset, Magnified view for the area of postsynaptic APs between 5 and 15 Hz of the plot in D, showing that zinc chelators did not suppress the induction of LTP-IE upon the 10 Hz AP train or 20 Hz MF stimulation. Note that Zn2+ chelators render the 50 Hz MF stimulation incompetent in the induction of LTP-IE (colored symbol).
Figure 5.
Figure 5.
Deletion of vesicular zinc transporter (ZnT3) abolishes the privilege of MF inputs in LTP-IE induction. A, MF stimulation induced relative Gin changes in postsynaptic CA3-PCs from ZnT3 KO mice (Ab) or their WT littermates (Aa). MF stimulations at 20 or 50 Hz were given at t = 0 s (arrowheads). For comparison, Gin changes upon 20 MF stimulation in CA3-PCs from Sprague Dawley rats are reproduced from Figure 1A (gray). Inset, Subthreshold voltage responses before (black) and 25 min after MF stimulation (same color codes as the main panel). B, MF stimulation-induced ΔGin as a function of postsynaptic AP frequencies in WT and ZnT3KO CA3-PCs. The same color codes as in A are used for ΔGin data for WT or ZnT3KO mice (filled symbols). ΔGin data for Zn2+ chelators are reproduced from Figure 4 (pale colored symbols) for comparison.
Figure 6.
Figure 6.
Supplement of Zn2+ to extracellular solution disinhibits the induction of LTP-IE upon inadequate stimulation. A, Supplement of 100 nm ZnCl2 in the extracellular solution enabled the composite train (orange) and 50 Hz AP train (green) to induce LTP-IE. Insets, Representative traces for Gin before (black) and 25 min after conditioning (the same color codes as the main panel). B, MF stimulation at 50 Hz for 1 s readily induced LTP-IE in CA3-PCs of ZnT3KO mice in the presence of 100 nm ZnCl2 in bathing solution (purple). Histidine alone did not allow 50 Hz MF stimulation to induce LTP-IE in CA3-PCs of ZnT3KO mice (yellow). The extent of ΔGin in ZnT3KO was not different from that in WT as control (open circles, reproduced from Fig. 4Aa). Insets, Representative subthreshold voltage responses before (black) and 25 min after conditioning. C, Plot of 50 Hz MF stimulation-induced ΔGin (purple) as a function of the number of postsynaptic APs in ZnT3-KO CA3-PCs with 100 nm ZnCl2 added to the bathing solution. For comparison, data for ΔGin induced by 20 or 50 Hz MF stimulation in KO CA3-PCs and in Sprague Dawley rats are reproduced from Figures 5B and 4D (gray symbols), respectively. Note that the nadir on the plot occurred around the postsynaptic AP frequency at 10 Hz for MF-induced ΔGin in KO CA3-PCs, but supplement of ZnCl2 converted their relationship similar manner as those of Sprague Dawley rats. D, Summary for the mean values of ΔGin induced by conditioning, as indicated on the abscissa. The control values (ΔGin values under the conditions without Zn2+ supplement) are reproduced from Hyun et al. (2013) (for 50 Hz AP train), Figure 2C (for composite train), and Figure 5A (for 50 MF stimulation in WT). Ea, Experiments similar to those in Aa were replicated in CA3-PCs from 8- to 14-week-old mice. LTP-IE was readily induced by 10 Hz somatic AP trains (green) but not by the 50 Hz AP train (blue). With 100 nm Zn2+ supplemented to aCSF, LTP-IE was induced by the 50 Hz AP train (purple). Eb, Mean values for the extent of ΔGin were not different between 2- to 3-week-old rats (red) and 8- to 14-week-old mice (gray) for each condition. n.s., No statistical significance. *p < 0.05; ***p < 0.005.
Figure 7.
Figure 7.
Supplement of Zn2+ to aCSF allows 50 Hz somatic stimulation to induce reduction of D-type K current and E-S potentiation of PP inputs. Aa, Ab, Outward K+ IK elicited by a depolarizing step to −20 mV (red), −30 mV (blue), and −40 mV (black) from −70 mV before (Aa, top row) and after bath application of 30 μm 4-AP (Aa, bottom row) in the naive and conditioned CA3-PCs. For each condition, the arithmetical subtraction of IK under the 4-AP (bottom row) from the total IK (top row) at the same depolarizing step was regarded as IKD. Representative traces for IKD are shown in Ab. Ac, Mean values for peak amplitudes of IKD induced by a step depolarization to −20, −30, and −40 mV under different conditions. Ctrl, Without conditioning; 50 Hz, after 50 Hz somatic AP trains; 50 Hz + AbL and 50 Hz + AbM, intracellular perfusion of anti-RPTPα AbL and anti-RPTPα AbM, respectively; 50 Hz + Zn, 100 nm Zn2+ supplemented to aCSF. Ba, Number of APs elicited by five PP-EPSP trains at 20 Hz before and after 50 Hz somatic AP trains (arrowhead at 0 min). The 50 Hz AP train alone did not enhance the number of APs induced by PP synaptic inputs (black symbols). With 100 nm ZnCl2 supplemented to aCSF, however, the 50 Hz AP train enhanced the number of APs (red symbols. For comparison, AP numbers elicited by PP-EPSP bursts at 20 Hz after a 10 Hz somatic AP train are reproduced from Hyun et al. (2015) (gray symbols). Bb, Exemplar traces for temporal summation of 20 Hz PP-EPSPs before (black) and after (blue) the 50 Hz AP train without (left) and with (right) ZnCl2 supplement. n.s., No statistical significance. *p < 0.05; ***p < 0.005.
Figure 8.
Figure 8.
Zn2+ facilitates MF-induced heterosynaptic potentiation of PP synaptic inputs. Aa, Ab, The relationship between PP-EPSP and PP-EPSC amplitudes measured at the same CA3-PCs (Aa), and the mean values for the EPSP/EPSC ratio (Ab) at PP-CA3 synapses under the conditions tested in Ba to Cb (control, control conditions in CA3-PCs of Sprague Dawley rats; ZX1, in the presence of 100 or 50 μm ZX1 in Sprague Dawley rats; ZnT3KO and ZnT3WT, ZnT3 KO mice and their littermates; Zn suppl., ZnT3 KO with supplement of Zn2+). Ba, Bb, Relative amplitudes of PP-EPSPs before and after MF stimulation at 20 Hz (Ba) or at 50 Hz (Bb) in the presence of 100 or 50 μm ZX1. Data for PP-CA3 EPSPs after somatic conditioning (10 Hz AP train for 2 s) are repeated in Ba and Bb as a control (open circles). Amplitudes are normalized to their mean baseline values. Conditioning MF stimuli were delivered at t = 0 (arrowhead). Ca, Cb, Relative amplitudes of PP-EPSPs before and after MF stimulation at 20 or 50 Hz in CA3-PCs from ZnT3-KO mice (Ca) or their WT littermates (Cb). MF stimulation at 20 Hz (green), but not at 50 Hz (gray), induced LTP of PP-EPSPs in KO CA3-PCs (Ca). Supplement of ZnCl2 rescued the incompetence of 50 Hz MF stimulation in KO (blue). In contrast, MF stimulation induced LTP of PP-EPSPs both at 20 and 50 Hz in WT CA3-PCs (Cb). BaCb, Insets, PP-EPSP traces before (gray) and 25 min after a conditioning (same color codes as in main panels). Da, Plot of PP-EPSP potentiation as a function of the number of postsynaptic APs elicited by conditioning stimuli, as indicated in the boxed graph legend. MF-induced potentiation of PP-EPSPs under control conditions (gray triangles) are reproduced from Hyun et al. (2015) for comparison. Db, Summary for potentiation of PP-EPSPs induced by different conditionings. n.s., No statistical significance. ***p < 0.005.
Figure 9.
Figure 9.
High-frequency MF stimulation induces influx of Zn2+ to apical dendrites of CA3-PCs. A, FluoZin3 fluorescence changes (ΔF/F0) at proximal apical dendrites evoked by somatic conditioning (10 Hz APs, 2 s; broken line) and by 20 Hz minimal stimulation of MFs (2 s) under control conditions (black) and in the presence of 1 μm TPEN in aCSF (cyan). Bottom bar graph, peak ΔF/F0 of FluoZin-3 fluorescence. Ba, Representative FluoZin-3 fluorescence image of a CA3-PC. Colored boxes are ROIs where fluorescence was measured. For each ROI, its distance from the soma is indicated. Bb, Averaged FluoZin-3 fluorescence changes (ΔF/F0) were measured at corresponding ROIs (same color code as in Ba), while afferent MFs were minimally stimulated at 20 Hz for 2 s (horizontal bar), which typically induced an AP response, as shown in the topmost panel. In each panel, ΔF/F0 traces measured in ZnT3 WT (solid line) and KO (broken line) CA3-PCs were superimposed. Bc, Bd, Mean values for FluoZin-3 fluorescence changes measured at 2 s (at the end of MF stimulation; Bc) and at 5 s (Bd) from ROIs at different distances from the soma in WT and ZnT3KO CA3-PCs. Be, The number of MF-induced postsynaptic APs as a function of baseline MF-EPSC amplitudes for WT (open circles) and ZnT3KO (filled circles) CA3-PCs. Bf, Left, The FluoZin-3 signals at distal apical dendrites (200 μm from the soma) of WT (blue) and KO (purple; reproduced from Bb) mice. For comparison, distal dendritic FluoZin-3 signal evoked by somatic conditioning in a CA3-PC of Sprague Dawley rats is overlapped. Right, The same FluoZin-3 signals are normalized to their peak values to compare decay kinetics. The distal dendritic Fura-2 trace is superimposed (green trace, reproduced from Fig. 2Ba). Blue horizontal bars, 2 s period when conditioning stimuli were given. Ca, The number of MF-induced postsynaptic APs as a function of baseline MF-EPSC amplitudes in the control conditions (black) and after bath application of 10 nm TTX (red). Insets, Representative traces for MF-EPSCs (top) and MF-induced AP responses (bottom) under control conditions (black) and in the presence of 10 nm TTX (red) in the same CA3-PC. Cb, Averaged traces for ΔF/F0 of FluoZin-3 measured at proximal (left) and distal (right) apical dendrites in control (black) and 10 nm TTX (red) conditions. The difference trace (gray) was obtained by subtraction of the latter trace from the former one. Cc, Summary for normalized ΔF/F0 values measured from proximal and distal dendrites at 2 and 5 s from the start of MF stimulation in control conditions (open bars) and after TTX application (gray bars). n.s., No statistical significance. *p < 0.05; **p < 0.01; ***p < 0.005.
Figure 10.
Figure 10.
MF input-induced proximal dendritic [Zn2+] elevation linearly depends on the number of postsynaptic APs. A, MF stimulation-induced ΔF/F0 values measured at 2 s (open symbols) and 5 s (filled symbols) as a function of the number of postsynaptic APs and baseline MF-EPSC amplitudes. In each panel, ΔF/F0 values are compared for the control (black), 10 nm TTX (red), and TPEN (purple) conditions. All data are obtained from the same cells of Figure 9C. B, MF stimulation-induced ΔF/F0 values at proximal (25 μm from soma; Ba) and distal (>200 μm; Bb) dendrites of CA3-PCs from WT (open symbols) and ZnT3KO (filled symbols) mice as a function of the number of postsynaptic APs and baseline MF-EPSC amplitudes. All data were obtained from the same cells seen in Figure 9B, except for red symbols, which represent peak ΔF/F0 at proximal dendrites evoked by 50 Hz MF stimulation with the same pulse number in WT CA3-PCs. For proximal and distal dendrites, ΔF/F0 values were measured at 2 and 5 s, respectively. Ca, Top, Representative EPSC traces in mouse CA3-PCs evoked by MF stimulations at 20 Hz (black) and 50 Hz (red). Bottom, Mean values for MF-EPSC amplitudes normalized to the baseline as a function of pulse number. Cb, Sum of normalized EPSC amplitudes evoked by 40 pulses at 20 and 50 Hz delivered to MFs. Cc, Voltage responses evoked by MF stimulation with 40 pulses at 20 Hz (black) and 50 Hz (red). Bottom, Averaged traces for FluoZin3 fluorescence changes evoked by 20 and 50 Hz (40 pulses). Horizontal bars indicate the time for MF stimulations. *p < 0.05.

Similar articles

Cited by

References

    1. Amaral DG, Ishizuka N, Claiborne B (1990) Neurons, numbers and the hippocampal network. Prog Brain Res 83:1–11. 10.1016/S0079-6123(08)61237-6 - DOI - PubMed
    1. Berzhanskaya J, Urban NN, Barrionuevo G (1998) Electrophysiological and pharmacological characterization of the direct perforant path input to hippocampal area CA3. J Neurophysiol 79:2111–2118. 10.1152/jn.1998.79.4.2111 - DOI - PubMed
    1. Bindokas VP, Lee CC, Colmers WF, Miller RJ (1998) Changes in mitochondrial function resulting from synaptic activity in the rat hippocampal slice. J Neurosci 18:4570–4587. 10.1523/JNEUROSCI.18-12-04570.1998 - DOI - PMC - PubMed
    1. Bischofberger J, Engel D, Frotscher M, Jonas P (2006) Timing and efficacy of transmitter release at mossy fiber synapses in the hippocampal network. Pflugers Arch 453:361–372. 10.1007/s00424-006-0093-2 - DOI - PubMed
    1. Bodrikov V, Sytnyk V, Leshchyns'ka I, den Hertog J, Schachner M (2008) NCAM induces CaMKIIalpha-mediated RPTPalpha phosphorylation to enhance its catalytic activity and neurite outgrowth. J Cell Biol 182:1185–1200. 10.1083/jcb.200803045 - DOI - PMC - PubMed

Publication types

LinkOut - more resources