. 2019 May 1;39(18):3412-3433.
doi: 10.1523/JNEUROSCI.2945-17.2019. Epub 2019 Mar 4.

Spinal Motor Circuit Synaptic Plasticity after Peripheral Nerve Injury Depends on Microglia Activation and a CCR2 Mechanism

Affiliations

Spinal Motor Circuit Synaptic Plasticity after Peripheral Nerve Injury Depends on Microglia Activation and a CCR2 Mechanism

Travis M Rotterman et al. J Neurosci. .

Abstract

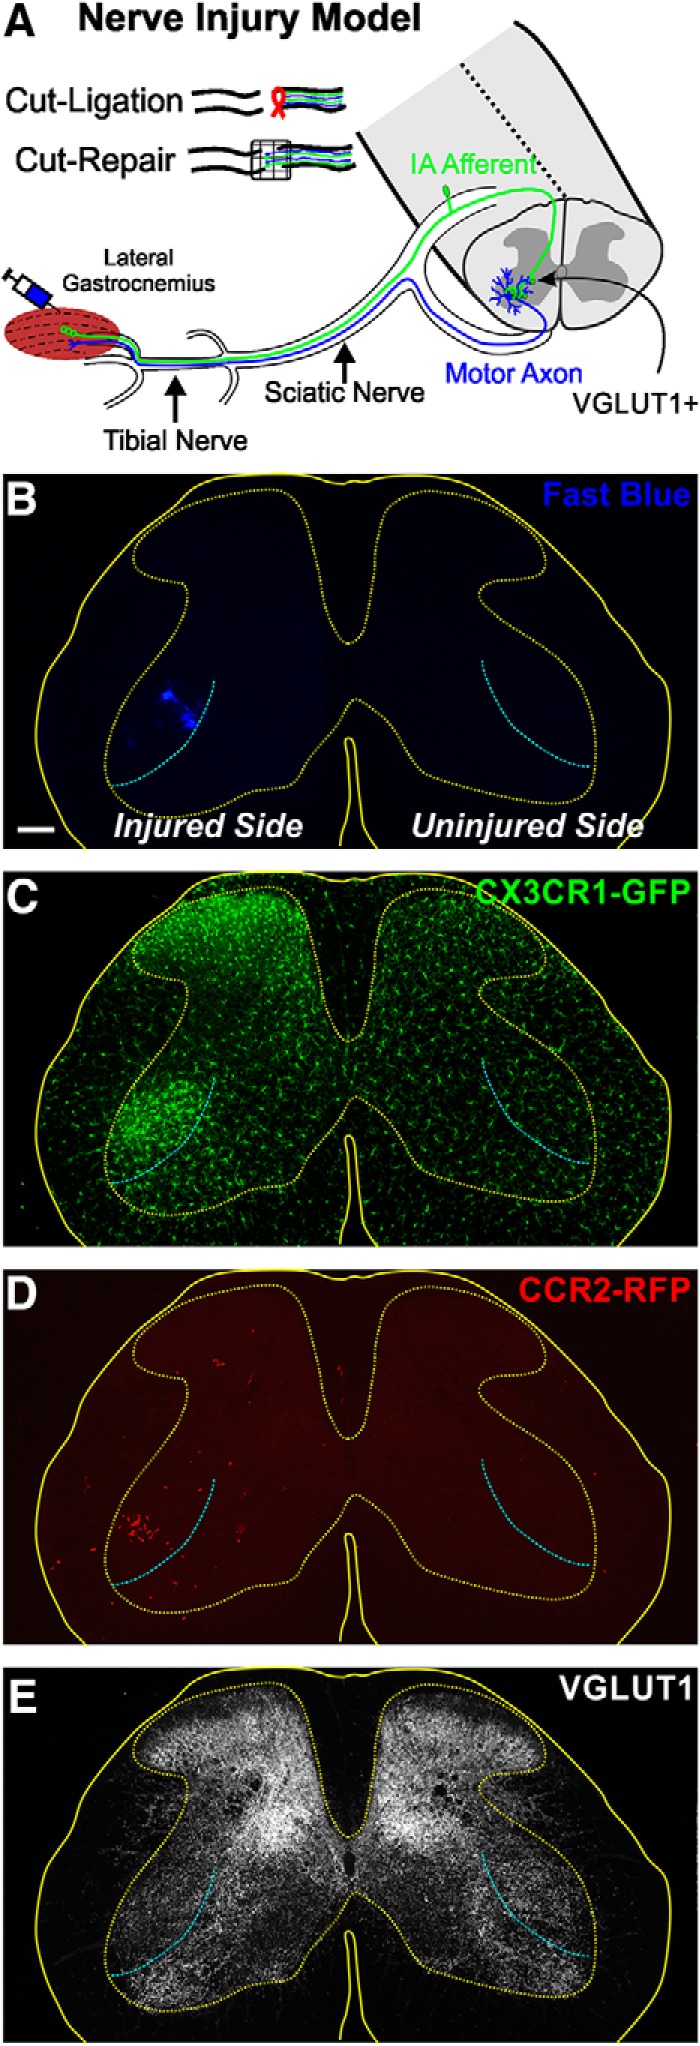
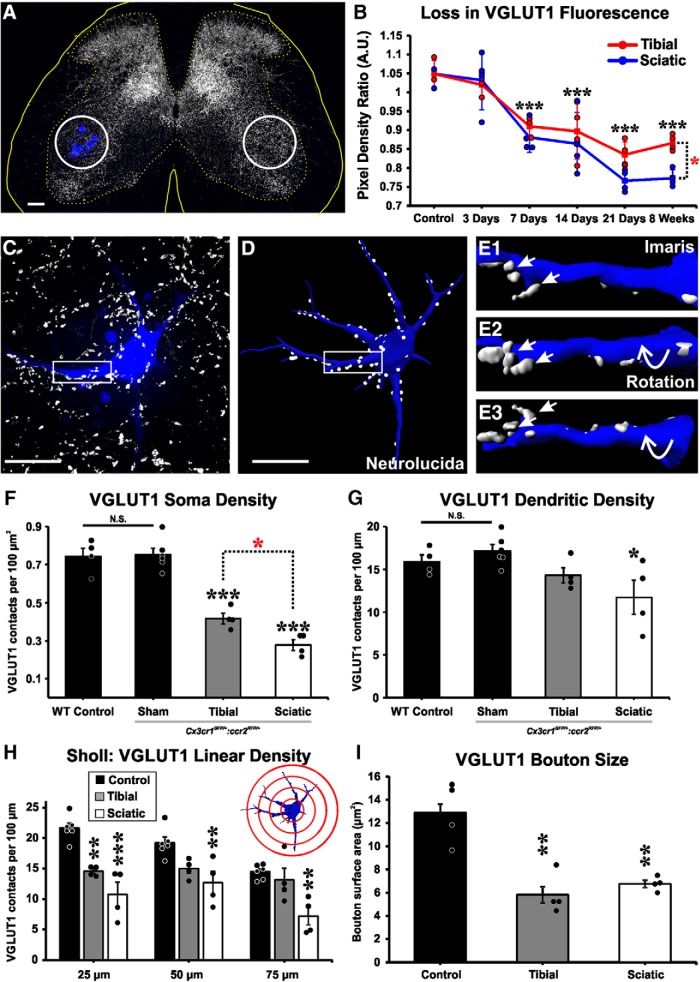
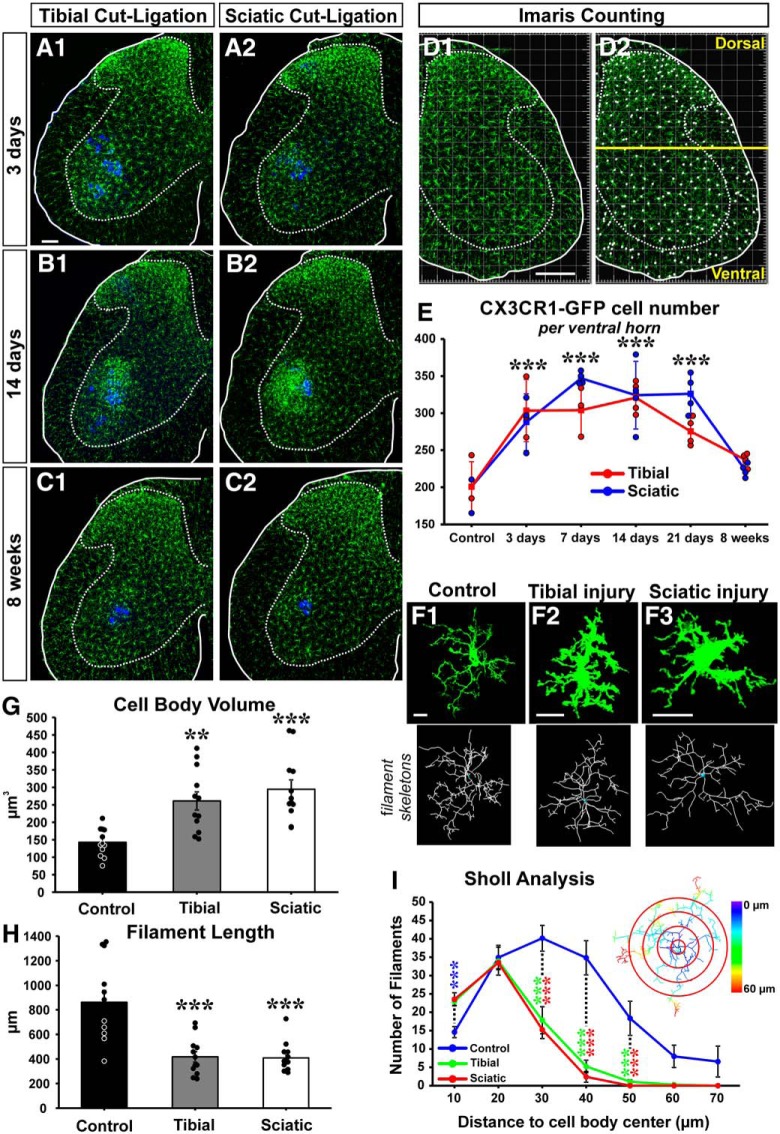
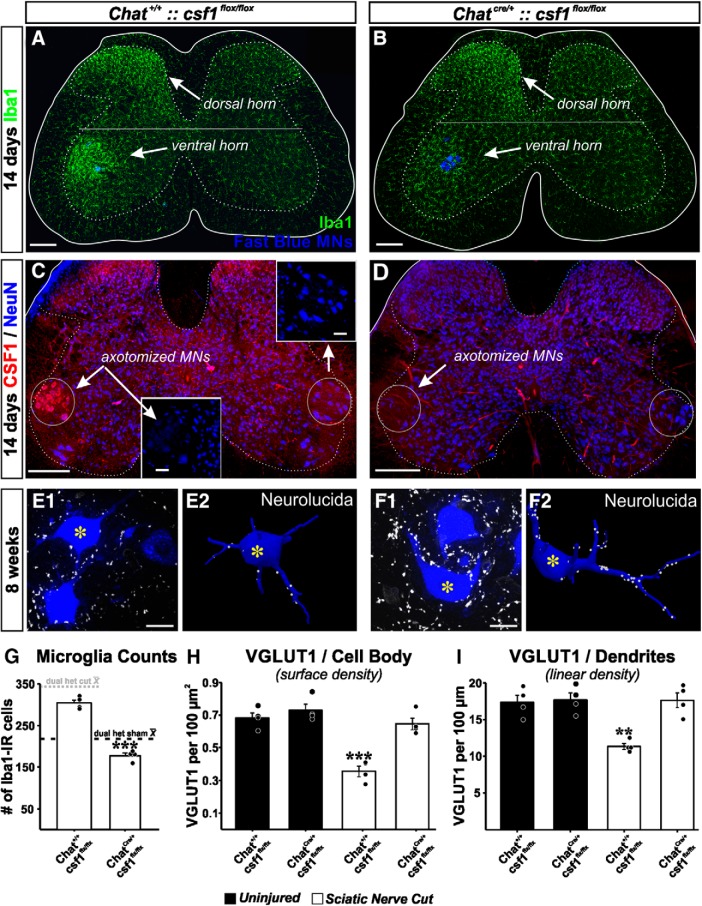
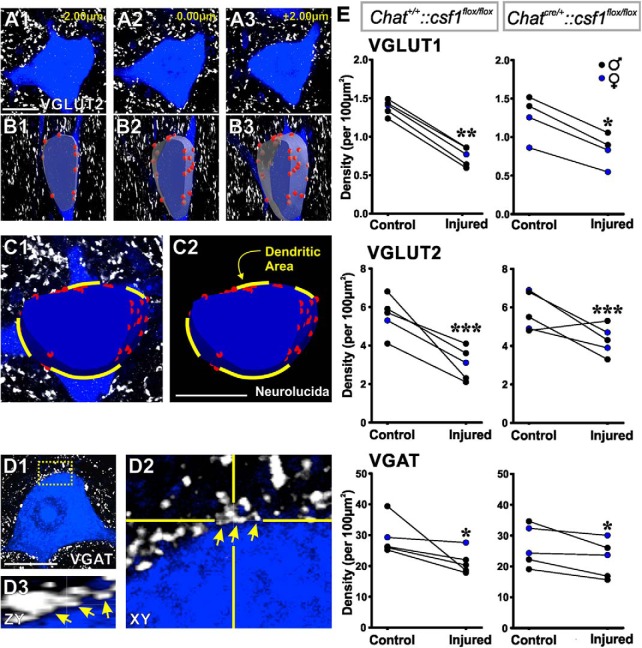
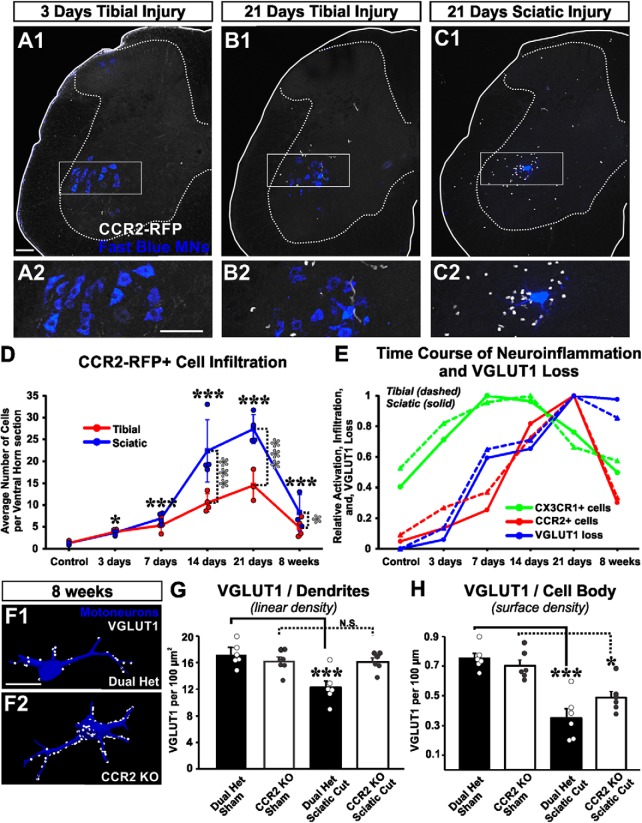
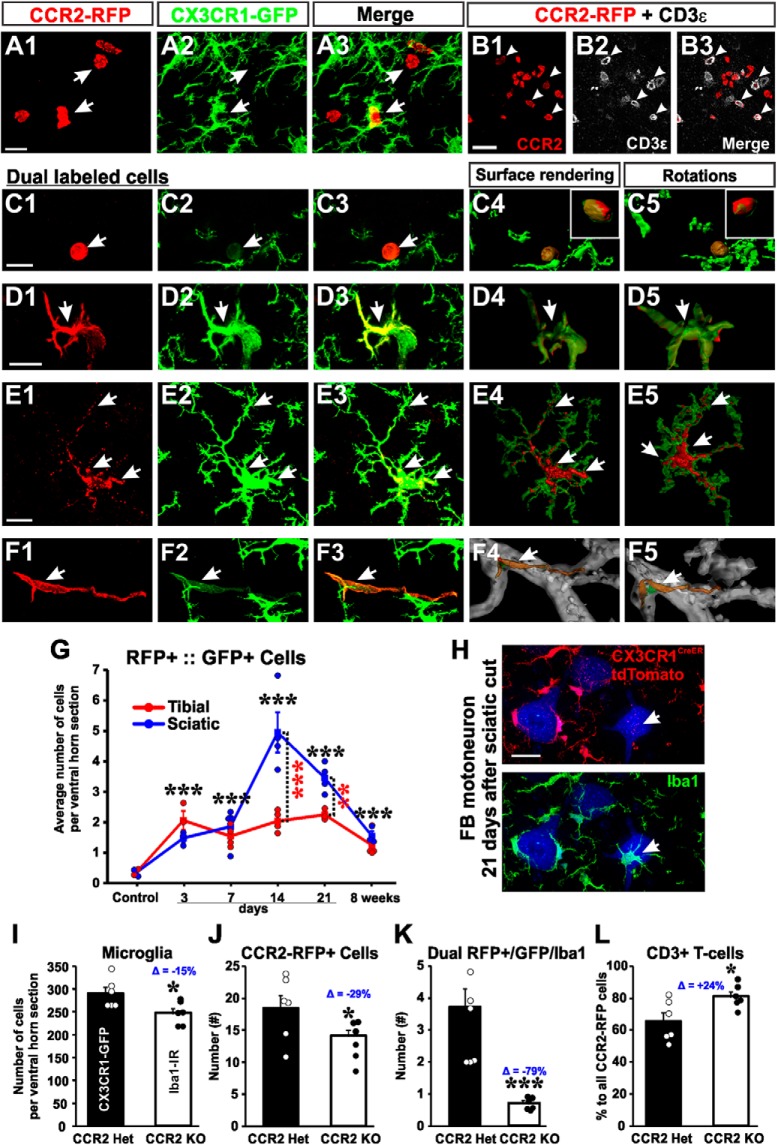
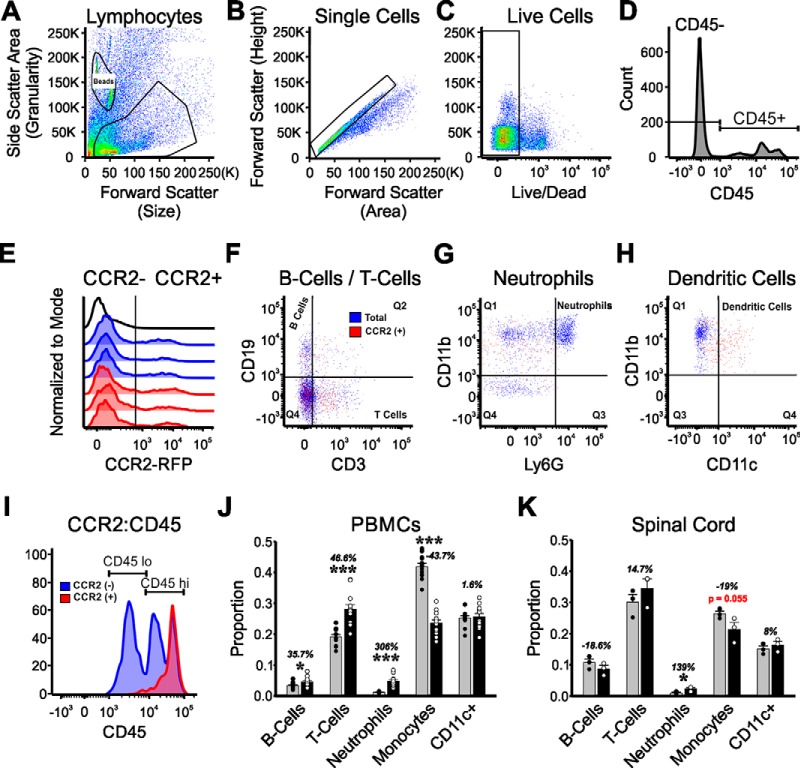
Peripheral nerve injury results in persistent motor deficits, even after the nerve regenerates and muscles are reinnervated. This lack of functional recovery is partly explained by brain and spinal cord circuit alterations triggered by the injury, but the mechanisms are generally unknown. One example of this plasticity is the die-back in the spinal cord ventral horn of the projections of proprioceptive axons mediating the stretch reflex (Ia afferents). Consequently, Ia information about muscle length and dynamics is lost from ventral spinal circuits, degrading motor performance after nerve regeneration. Simultaneously, there is activation of microglia around the central projections of peripherally injured Ia afferents, suggesting a possible causal relationship between neuroinflammation and Ia axon removal. Therefore, we used mice (both sexes) that allow visualization of microglia (CX3CR1-GFP) and infiltrating peripheral myeloid cells (CCR2-RFP) and related changes in these cells to Ia synaptic losses (identified by VGLUT1 content) on retrogradely labeled motoneurons. Microgliosis around axotomized motoneurons starts and peaks within 2 weeks after nerve transection. Thereafter, this region becomes infiltrated by CCR2 cells, and VGLUT1 synapses are lost in parallel. Immunohistochemistry, flow cytometry, and genetic lineage tracing showed that infiltrating CCR2 cells include T cells, dendritic cells, and monocytes, the latter differentiating into tissue macrophages. VGLUT1 synapses were rescued after attenuating the ventral microglial reaction by removal of colony stimulating factor 1 from motoneurons or in CCR2 global KOs. Thus, both activation of ventral microglia and a CCR2-dependent mechanism are necessary for removal of VGLUT1 synapses and alterations in Ia-circuit function following nerve injuries.SIGNIFICANCE STATEMENT Synaptic plasticity and reorganization of essential motor circuits after a peripheral nerve injury can result in permanent motor deficits due to the removal of sensory Ia afferent synapses from the spinal cord ventral horn. Our data link this major circuit change with the neuroinflammatory reaction that occurs inside the spinal cord following injury to peripheral nerves. We describe that both activation of microglia and recruitment into the spinal cord of blood-derived myeloid cells are necessary for motor circuit synaptic plasticity. This study sheds new light into mechanisms that trigger major network plasticity in CNS regions removed from injury sites and that might prevent full recovery of function, even after successful regeneration.

Keywords: CCR2; CX3CR1; VGLUT1; microglia; nerve injury; stretch reflex.


Figures

Figure 1.
Figure 1.
Nerve injury and mouse models. A, The LG muscle of Cx3cr1GFP/+::Ccr2RFP/+ dual-heterozygous mice was injected with Fast Blue to retrogradely label one pool of axotomized MNs. Then, the tibial or sciatic nerve was transected and the proximal stump either ligated to prevent regeneration or aligned to the distal stump with fibrin glue to allow regeneration. Spinal cords were analyzed 3 d to 8 weeks after injury. B–E, 2D projections of confocal image stacks through the 50 μm section thickness showing the four fluorescent signals analyzed: Fast Blue MNs (B), CX3CR1-GFP+ microglia (C), CCR2-RFP+ infiltrating myeloid cells (D), and VGLUT1-immunofluorescence (E). This spinal cord was processed 14 d after sciatic nerve transection. Solid yellow line indicates the spinal cord edge. Dotted line indicates the gray matter. Cyan line indicates the approximate boundary of the sciatic and nonsciatic motor pools. GFP+ microgliosis is visible in the dorsal and ventral horns ipsilateral to the nerve injury. Ventrally microglia accumulate around the axotomized sciatic motor pools. Infiltrating RFP+ myeloid cells accumulate preferentially within the area of ventral microgliosis with little evidence of CCR2-RFP cells in the dorsal horn or the contralateral side. The sciatic motor pool region also shows depleted VGLUT1-immunoreactive punctae ipsilateral to the nerve injury side. Scale bars: B, 100 μm. C–E, Same magnification.
Figure 2.
Figure 2.
VGLUT1 synaptic loss after nerve injury. A, VGLUT1 immunoreactivity (IR) shows a unilateral decrease in the injured side around the region containing Fast Blue-axotomized LG MNs. ROIs (white circles) are placed on LG motor pools on both sides of the spinal cord, and the integrated pixel density of VGLUT1 immunofluorescence was measured. B, VGLUT1 immunofluorescence density changes with time. Data are presented as a ratio of estimates ipsilateral versus contralateral to the injury. VGLUT1 fluorescence decreases ipsilateral to the injury after sciatic (blue line) or tibial (red line) nerve cut-ligation injuries. y axis represents integrated pixel density ipsilateral/contralateral. Each dot represents estimates from 1 animal (n = 4 mice per time point per injury type). Lines indicate mean ± SE at each time point. Black asterisks are comparisons with control: ***p < 0.001. Red asterisk at 8 weeks is a comparison between injuries: *p < 0.05. C, High-magnification confocal image of a retrogradely labeled LG MN (blue, Fast Blue) from a sham control animal receiving VGLUT1 synaptic inputs (white). D, Neurolucida 3D reconstruction of the same MN with VGLUT1 contacts mapped along soma and dendrites. E1–E3, Imaris 3D surface renderings of dendritic segments shown in box highlighted in C, D. Rotations demonstrate VGLUT1 synapses attachment to the dendrite. F, D, VGLUT1 density in cell bodies and dendrites of dual-heterozygous sham control animals is not different from control MNs in WT animals. In dual-heterozygous animals, VGLUT1 densities are decreased in cell bodies both after either tibial or sciatic nerve transection compared with sham controls. Black asterisks are comparisons with sham: ***p < 0.001. Red asterisk compares the two injuries: *p < 0.05. Dendrite linear densities of VGLUT1 contacts are significantly decreased compared with sham controls only after sciatic nerve injury (black asterisk; *p < 0.05), but not after tibial nerve injury. H, Sholl analysis (bin size: 25 μm distance increments from cell body center): VGLUT1 densities compared with sham controls show significant decreases in the first 25 μm bin after both injuries, but at further distances depletions were significant only after sciatic nerve injury: ***p < 0.001; **p < 0.01. I, VGLUT1 bouton surface area is similarly reduced after tibial or sciatic nerve injury: **p < 0.01 to control. F–H, Error bars indicate mean ± SE (n = 4–6 mice); each mouse estimate is from 6 MNs per mouse. Scale bars: A, 100 μm; C, D, 50 μm.
Figure 3.
Figure 3.
Microglia activation around injured MNs. A–C, CX3CR1-GFP microglia (green) 3 d (A), 14 d (B), and 8 weeks (C) after tibial (A1, B1, C1) or sciatic (A2, B2, C2) cut ligation. LG MNs are labeled with Fast Blue (blue). D, Quantification of GFP+ microglia using unbiased automatic Imaris spot function. D1, GFP fluorescence. D2, Cell body identification. A line traced above the dorsal tip of the central canal separates dorsal from ventral regions. E, Number of CX3CR1-GFP microglia per ventral horn in 50-μm-thick sections at different times after injury after a sciatic (blue line) or a tibial (red line) nerve injury. There is a significant increase in the number of GFP+ microglia after both tibial and sciatic ligation from 3 to 21 d after injury: ***p < 0.001, all versus control after either injury. Microglia numbers return to baseline by 8 weeks after injury. No statistical differences were detected between sciatic and tibial nerve injury in GFP+ microglial cell numbers. Each dot represents 1 animal. Lines indicate mean ± SE at each time point (n = 4 mice; 6 ventral horns were counted per mouse). F, High-magnification 2D projections of single CX3CR1-GFP microglia in control and 14 d after a tibial or sciatic nerve injury. Bottom, Imaris filament tracker reconstructions used for quantification. G, Microglia cell body volume significantly increased compared with control after both nerve injuries: **p < 0.01; ***p < 0.001. H, Total microglia process length shows significant decreases compared with controls: ***p < 0.001. G, H, Each data point represents an individual microglia cell (n = 12 in each group). Error bars indicate SE. I, Sholl analysis compares the total number of microglia filaments in increasing 10 μm distance bins from the cell body center. Control microglia have significantly fewer processes in the first 10 μm than microglia in the injured conditions (blue asterisks); but past 20 μm, there are significantly fewer microglia processes in injured animals. Asterisks represent significant differences compared with control (blue) after sciatic (red) or tibial (green) nerve injury: ***p < 0.001. Inset, Sholl analysis bins with color-coded distances. Scale bars: A, D1, 100 μm; F, 10 μm.
Figure 4.
Figure 4.
VGLUT1 synapses are rescued by genetic attenuation of microglia responses in the ventral horn after deleting CSF1 from MNs. A, B, Microglia activation in the dorsal and ventral horn 14 d after sciatic nerve transection and repair in animals in which csf1 is genetically deleted from MNs (B) or not (A). Ventral horn microglia response is significantly attenuated after removing csf1 from MNs. C, D, Confirmation of CSF1 deletion. CSF1 is upregulated in axotomized MNs after nerve injury, but CSF1 is not present following csf1 deletion in Chat-expressing neurons. Section counterstained with NeuN. NeuN is downregulated in axotomized MNs (Alvarez et al., 2011). E, F, VGLUT1 synapses on Fast Blue LG MNs with csf1 preserved (E) or removed (F). Images represent a single confocal plane (left) and the 3D Neurolucida reconstructions (right). Reconstructions correspond to MNs with an asterisk. G, Quantification of microglia numbers 14 days post injury in the ventral horn of animals with csf1 removed from MNs (ChatCre/+::csf1 flox/flox) and genetic controls (Chat+/+::csf1flox/flox). Dashed lines indicate the average number of ventral horn microglia per section in dual-heterozygote Cx3cr1GFP/+::Ccr2RFP/+ animals in sham controls (dark dashed line) or after sciatic nerve transection and ligation (dashed dotted line). Removal of csf1 from MNs prevents the increase in microglia numbers after nerve injury. ***p < 0.001, between animals with csf1 removed or preserved (t tests). H, I, VGLUT1 densities on the cell body (surface densities, H) and on the dendrites (linear density, I) eight weeks after injury in injured animals (white bars) with csf1 removed or not compared with uninjured animals of the same genotypes. MNs with csf1 preserved display the excepted reductions in VGLUT1 densities. After removal of csf1, MNs display densities similar to uninjured, suggesting rescue. Moreover, removal of csf1 from Chat-expressing neurons did not affect VGLUT1 densities (these are similar to uninjured WTs and sham controls in Fig. 2). Error bars in all histograms indicate SE. Each dot represents 1 animal n = 4 animals per bar. For microglia numbers, each animal value is the average of 6 ventral horns. For estimating VGLUT1 densities, each animal's estimate results from averaging 6 reconstructed MNs. H, ***p < 0.001, compared with all other groups (post hoc Bonferroni t tests). I, **p < 0.01, compared with all other groups (post hoc Bonferroni t tests). Scale bars: A–D, 200 μm; C, Inset, 50 μm; E1, F1, 20 μm.
Figure 5.
Figure 5.
“Synaptic stripping” is independent of microglia activation. A–C, Method for assessing synaptic densities on MN cell bodies. A, Three representative confocal optical sections separated by 2 μm z distance through the midplane of a Fast Blue MN. White represents VGLUT2-immunoreactive puncta. B, A slab of mid-cell body region reconstructed from 15 such optical sections (7 μm wide; z step: 0.5 μm) and VGLUT2 contacts marked on its surface (red circles). C, A similar reconstruction on a different MN marking exits of dendrites on the reconstructed surface. These areas were subtracted from the total surface of the neuronal slab to estimate the density only on the membrane surface available for synapses on the cell body. D1, VGAT contacts (white) on the cell surface; single optical plane confocal image. D2, D3, High-magnification and rotation showing a cluster of closely spaced VGAT contacts. Each was counted separately but likely represents independent vesicular accumulations in a single terminal and related to the multiplicity of active zones that inhibitory synapses form over cell bodies of MNs. E, Quantification of vesicular marker contact densities comparing MNs in the side ipsilateral (injured MNs) or contralateral (control MNs) to the injury in animals with normal microglia activation (Chat+/+::csf1flox/flox) or blunted microglia activation (ChatCre/+::csf1 flox/flox) (n = 5 animals per genotype; 3–10 MNs analyzed per genotype and side; all MNs were pooled together in a single average per animal, genotype, and side). VGLUT1 and VGLUT2 synapses were both significantly depleted after injury independent of genotype (p < 0.001). VGAT synapses were also depleted with microglia activation preserved or blunted, but depletions were lower compared with VGLUTs, but still significant (p < 0.05). There was more interanimal variability in VGAT depletions, and this was identified as originating in sex differences (in all graphs, blue represents female data points). All replace for comparisons, plural were paired t tests between control and injured side. Scale bars, 20 μm. *p < 0.05; **p < 0.01; ***p < 0.001.
Figure 6.
Figure 6.
CCR2+ cells infiltrate the ventral horn of the spinal cord after nerve injury, and CCR2 activation is necessary for VGLUT1 losses from dendrites. A–C, 2D projections of confocal image stacks (50-μm-thick section) showing CCR2+ cells (white cells) infiltrated in the spinal cord 3 or 21 d after either tibial or sciatic nerve transections. These cells are located predominantly in the ventral horn, close to retrogradely labeled LG MNs (blue). The area highlighted in the rectangle is shown at higher magnification below. D, Time course of CCR2+ cell infiltration after tibial (red line) or sciatic (blue line) nerve injury. Data are represented as average number of total RFP+ cells in the ventral horn of 50-μm-thick spinal cord sections. Each data point represents the average from all L4-L5 sections containing Fast Blue MNs in each mouse (average of 23.2 sections per animal). Lines indicate the average of 3 or 4 mice per time point. Error bars indicate SE. Significant increases in CCR2+ cells compared with control are found from 3 d to 8 weeks after injury for both injuries (black asterisks), whereas significant differences between STL and TTL are found at 14 d, 21 d, and 8 weeks after injury (gray asterisks): *p < 0.05; ***p < 0.001. E, Time course of CX3CR1-GFP+ cell activation (green lines), infiltration of CCR2-RFP+ cells (red lines), and overall VGLUT1 loss after sciatic or tibial nerve injury (blue lines) normalized to maximum change for each condition and measurement. The time course of VGLUT1 loss overlaps with CCR2+ cell entry; both occur at a delay after the onset of microglia activation. F, VGLUT1 synapses on LG reconstructed MNs after injury in dual-heterozygote Cx3cr1GFP/+::Ccr2RFP/+ animals compared with CCR2 KOs. G, Quantification of VGLUT1 synapses on LG MN dendrites. Dual-heterozygote animals, but not CCR2 KOs, show a significant decrease in dendritic synapses (***p < 0.001), each compared with their respective sham controls (n = 6 animals per group; each animal estimate is the average of 6 MNs per animal; error bars indicate SE). H, VGLUT1 densities on cell bodies. There was only partial preservation in CCR2 KO animals: *p < 0.05; ***p < 0.001. Scale bars: A1, A2, 100 μm; B1, C1, B2, C2, respectively, at the same, F, 50 μm.
Figure 7.
Figure 7.
CCR2-RFP cells infiltrating the spinal cord ventral horn. A1–A3, Round and elongated CCR2-RFP cells lacking CX3CR1-GFP. Some of these cells are isolated (top arrow), but more frequently interact with microglia (bottom arrow). B1–B3, Many CCR2-RFP cells are positive for CD3ε, a T-cell marker. C1, D1, E1, F1, Confocal images (2D projections) of different types of dual-labeled CCR2-RFP/CX3CR1-GFP cells. C2, D2, E2, F2, CX3CR1-GFP expression. C3, D3, E3, F3, CCR2-RFP and CX3CR1-GFP merge images. C4, C5, D4, D5, E4, E5, F4, F5, CCR2-RFP content inside these cells, confirmed by surface rendering CX3CR1-GFP cells in Imaris and rotating the 3D volume. F4, F5, The surface of a blood vessel (stained by background VGLUT1 labeling) is also surface rendered. C, Rounded cell with low CX3CR1 fluorescence. D, Cell with few processes. E, Cell with multiple process and high CX3CR1 fluorescence and microglia-like morphology. F, Perivascular cell. G, Time course of CCR2-RFP/CX3CR1-GFP dual-expressing cells after tibial (red line and dots) or sciatic (blue line and dots) injuries. Data points represent individual animals (average of n = 23.2 sections per animal/data point). Lines indicate averages at each time point. Scale bars indicate SE (n = 4 animals per time point). Black and gray asterisks, respectively, represent significant differences with controls or between injury types at individual time points: **p < 0.01; ***p < 0.001. A significant infiltration of dual-labeled cells occurs after both injuries starting at 3 d and lasting for 8 weeks, but a peak increase in entry at 14 d occurs only after sciatic injuries. H, Genetic lineage labeling demonstrating cells derived from resident microglia (Iba1 and tdTomato colabeled) or sources other than resident microglia (labeled only with Iba1) 21 d after sciatic injuries. These include cells in close apposition to MN cell bodies (arrow). I–L, Change in microglia and CCR2-RFP cell numbers in CCR2 heterozygotes compared with CCR2 KOs 21 d after sciatic nerve injury and repair (STR). CCR2 heterozygotes are CX3CR1-EGFP:CCR2-RFP dual-heterozygotes. In all cases, n = 6 animals (each represented by a different dot). Errors bars indicate SE. *p < 0.05 (t tests). ***p < 0.001 (t tests). Deltas indicate effect sizes. Scale bars: A–F, 10 μm; H, 20 μm.
Figure 8.
Figure 8.
Flow cytometry analysis of CCR2+ cells inside the spinal cord and in the blood in CCR2 hets and CCR2 KOs 21 d after bilateral sciatic nerve injuries. A–C, Gating for cells (A), single cells (B), and live cells (C) from spinal cord Percoll isolates. D, Resulting cells were gated for CD45 and (E) CCR2. F, All CD45 or CD45+ CCR2+ cells were gated on CD19 (B cells) versus CD3 (T cells). G, The CD3 CD19 population was then gated on Ly6G versus CD11b to identify neutrophiles (Ly6G+ CD11b+). H, CD11b+ Ly6G cells were on CD11b versus CD11c to identify dendritic cells. I, CD45 cells were analyzed for low or high expression to identify populations of microglia (CD45lo) and activated microglia and macrophages (CD45hi). Only CD45hi CD11b cells express CCR2, suggesting that they have trafficked from the periphery. The results show all cell types represented in the spinal cord, but some lack CCR2. CCR2+ subtypes include CD3 T cells, CD11b monocytes/macrophages, and CD11c+ CD11b+ dendritic cells. J, Different cell types in the blood of injured CCR2 heterozygous animal (gray bars) and CCR2 KOs (black bars). Each data point represents a different animal (n = 12 animals). ***p < 0.001 (t tests). The data show the expected reduced numbers of monocyte/macrophages and increased numbers of neutrophils in the blood of CCR2 KOs. K, Percentages of CCR2+ cell populations in spinal cord 21 d after sciatic nerve injuries in CCR2 heterozygous (gray bars) and CCR2 KO animals (black bars). Each data point represents pooling together 4 animals to increase CCR2 cell yield inside the spinal cord (n = 12 animals total, n = 3). *p < 0.05 (t tests). Error bars indicate SE. The results show a depletion of monocyte/macrophages with p = 0.055.

Similar articles

Cited by

References

    1. Abelew TA, Miller MD, Cope TC, Nichols TR (2000) Local loss of proprioception results in disruption of interjoint coordination during locomotion in the cat. J Neurophysiol 84:2709–2714. 10.1152/jn.2000.84.5.2709 - DOI - PubMed
    1. Ajami B, Bennett JL, Krieger C, McNagny KM, Rossi FM (2011) Infiltrating monocytes trigger EAE progression, but do not contribute to the resident microglia pool. Nat Neurosci 14:1142–1149. 10.1038/nn.2887 - DOI - PubMed
    1. Aldskogius H. (2011) Mechanisms and consequences of microglial responses to peripheral axotomy. Front Biosci (School Ed) 3:857–868. 10.2741/192 - DOI - PubMed
    1. Aldskogius H, Arvidsson J, Grant G (1985) The reaction of primary sensory neurons to peripheral nerve injury with particular emphasis on transganglionic changes. Brain Res 357:27–46. - PubMed
    1. Aldskogius H, Liu L, Svensson M (1999) Glial responses to synaptic damage and plasticity. J Neurosci Res 58:33–41. 10.1002/(SICI)1097-4547(19991001)58:1<33::AID-JNR5>3.0.CO;2-M - DOI - PubMed

Publication types

LinkOut - more resources