

A Comprehensive Quantitative Genetic Analysis of Cerebral Surface Area in Youth
- PMID: 30833512
- PMCID: PMC6468099
- DOI: 10.1523/JNEUROSCI.2248-18.2019
A Comprehensive Quantitative Genetic Analysis of Cerebral Surface Area in Youth
Abstract
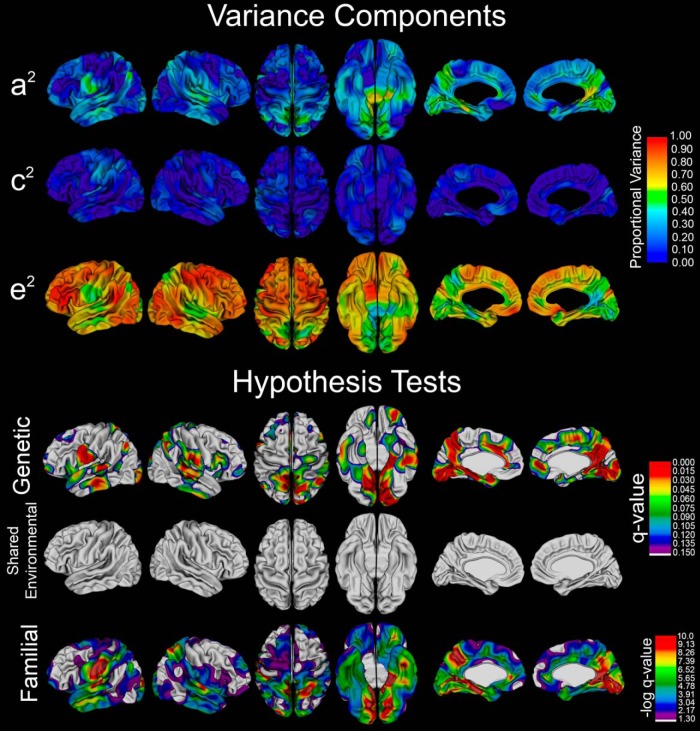
The genetics of cortical arealization in youth is not well understood. In this study, we use a genetically informative sample of 677 typically developing children and adolescents (mean age 12.72 years), high-resolution MRI, and quantitative genetic methodology to address several fundamental questions on the genetics of cerebral surface area. We estimate that >85% of the phenotypic variance in total brain surface area in youth is attributable to additive genetic factors. We also observed pronounced regional variability in the genetic influences on surface area, with the most heritable areas seen in primary visual and visual association cortex. A shared global genetic factor strongly influenced large areas of the frontal and temporal cortex, mirroring regions that are the most evolutionarily novel in humans relative to other primates. In contrast to studies on older populations, we observed statistically significant genetic correlations between measures of surface area and cortical thickness (rG = 0.63), suggestive of overlapping genetic influences between these endophenotypes early in life. Finally, we identified strong and highly asymmetric genetically mediated associations between Full-Scale Intelligence Quotient and left perisylvian surface area, particularly receptive language centers. Our findings suggest that spatially complex and temporally dynamic genetic factors are influencing cerebral surface area in our species.SIGNIFICANCE STATEMENT Over evolution, the human cortex has undergone massive expansion. In humans, patterns of neurodevelopmental expansion mirror evolutionary changes. However, there is a sparsity of information on how genetics impacts surface area maturation. Here, we present a systematic analysis of the genetics of cerebral surface area in youth. We confirm prior research that implicates genetics as the dominant force influencing individual differences in global surface area. We also find evidence that evolutionarily novel brain regions share common genetics, that overlapping genetic factors influence both area and thickness in youth, and the presence of strong genetically mediated associations between intelligence and surface area in language centers. These findings further elucidate the complex role that genetics plays in brain development and function.
Keywords: MRI; cortical thickness; genetics; intelligence; neurodevelopment; surface area.
Copyright © 2019 the authors.
Conflict of interest statement
The authors declare no competing financial interests.
Figures


Similar articles
-
The genetics of cortical myelination in young adults and its relationships to cerebral surface area, cortical thickness, and intelligence: A magnetic resonance imaging study of twins and families.Neuroimage. 2020 Feb 1;206:116319. doi: 10.1016/j.neuroimage.2019.116319. Epub 2019 Oct 31. Neuroimage. 2020. PMID: 31678229 Free PMC article.
-
The Dynamic Associations Between Cortical Thickness and General Intelligence are Genetically Mediated.Cereb Cortex. 2019 Dec 17;29(11):4743-4752. doi: 10.1093/cercor/bhz007. Cereb Cortex. 2019. PMID: 30715232 Free PMC article.
-
A comparison of heritability maps of cortical surface area and thickness and the influence of adjustment for whole brain measures: a magnetic resonance imaging twin study.Twin Res Hum Genet. 2012 Jun;15(3):304-14. doi: 10.1017/thg.2012.3. Twin Res Hum Genet. 2012. PMID: 22856366 Free PMC article.
-
Genetics of brain structure: contributions from the Vietnam Era Twin Study of Aging.Am J Med Genet B Neuropsychiatr Genet. 2013 Oct;162B(7):751-61. doi: 10.1002/ajmg.b.32162. Am J Med Genet B Neuropsychiatr Genet. 2013. PMID: 24132907 Free PMC article.
-
Genetic variation, brain, and intelligence differences.Mol Psychiatry. 2022 Jan;27(1):335-353. doi: 10.1038/s41380-021-01027-y. Epub 2021 Feb 2. Mol Psychiatry. 2022. PMID: 33531661 Free PMC article. Review.
Cited by
-
X-chromosome influences on neuroanatomical variation in humans.Nat Neurosci. 2021 Sep;24(9):1216-1224. doi: 10.1038/s41593-021-00890-w. Epub 2021 Jul 22. Nat Neurosci. 2021. PMID: 34294918
-
Twin studies to GWAS: there and back again.Trends Cogn Sci. 2021 Oct;25(10):855-869. doi: 10.1016/j.tics.2021.06.007. Epub 2021 Jul 24. Trends Cogn Sci. 2021. PMID: 34312064 Free PMC article. Review.
-
The neural basis of intelligence in fine-grained cortical topographies.Elife. 2021 Mar 8;10:e64058. doi: 10.7554/eLife.64058. Elife. 2021. PMID: 33683205 Free PMC article.
-
Sex chromosome aneuploidy alters the relationship between neuroanatomy and cognition.Am J Med Genet C Semin Med Genet. 2020 Jun;184(2):493-505. doi: 10.1002/ajmg.c.31795. Epub 2020 Jun 8. Am J Med Genet C Semin Med Genet. 2020. PMID: 32515138 Free PMC article.
-
Genetic and Environmental Influences on Lobar Brain Structures in Twins With Autism.Cereb Cortex. 2020 Mar 14;30(3):1946-1956. doi: 10.1093/cercor/bhz215. Cereb Cortex. 2020. PMID: 31711118 Free PMC article.
References
-
- Ad-Dab'bagh Y, Lyttelton O, Muehlboeck J, Lepage C, Einarson D, Mok K, Ivanov O, Vincent R, Lerch J, Fombonne E, Evans A (2006) The CIVET image-processing environment: a fully automated comprehensive pipeline for anatomcal neuroimaging research. In: Proceedings of the 12th Annual Meeting of the Organization for Human Brain Mapping (Corbetta M, ed), Florence, Italy.