. 2019 Mar 4;10(1):1014.
doi: 10.1038/s41467-019-08844-4.

Microbial abundance, activity and population genomic profiling with mOTUs2

Affiliations

Microbial abundance, activity and population genomic profiling with mOTUs2

Alessio Milanese et al. Nat Commun. .

Abstract

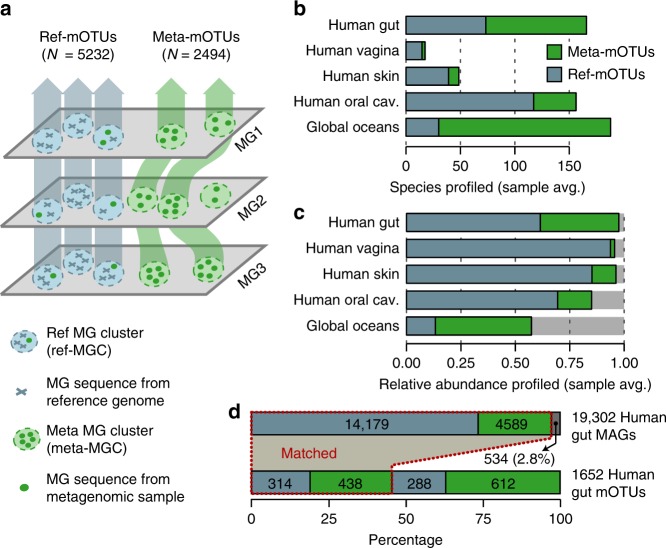
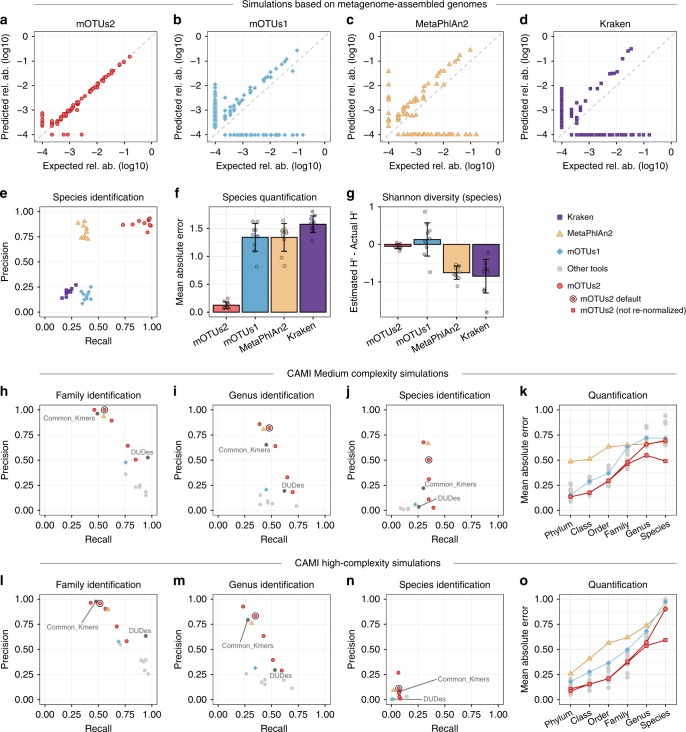
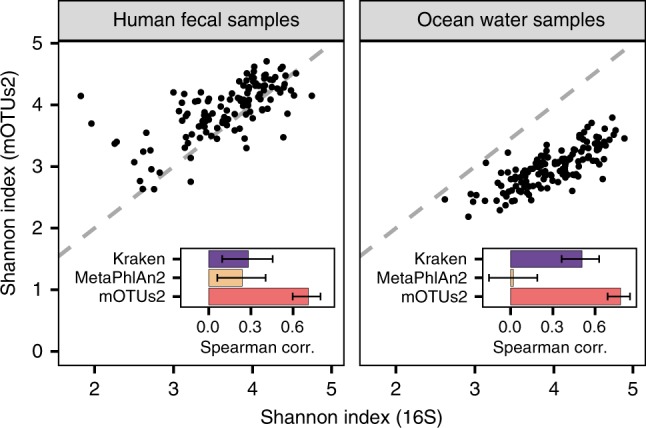
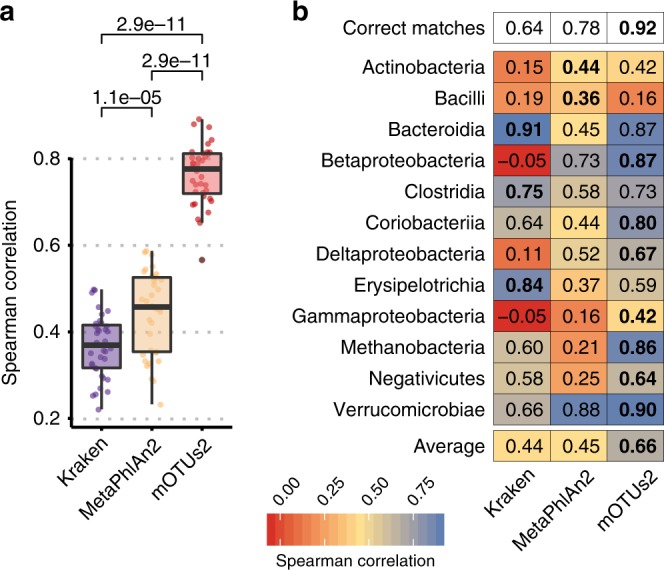
Metagenomic sequencing has greatly improved our ability to profile the composition of environmental and host-associated microbial communities. However, the dependency of most methods on reference genomes, which are currently unavailable for a substantial fraction of microbial species, introduces estimation biases. We present an updated and functionally extended tool based on universal (i.e., reference-independent), phylogenetic marker gene (MG)-based operational taxonomic units (mOTUs) enabling the profiling of >7700 microbial species. As more than 30% of them could not previously be quantified at this taxonomic resolution, relative abundance estimates based on mOTUs are more accurate compared to other methods. As a new feature, we show that mOTUs, which are based on essential housekeeping genes, are demonstrably well-suited for quantification of basal transcriptional activity of community members. Furthermore, single nucleotide variation profiles estimated using mOTUs reflect those from whole genomes, which allows for comparing microbial strain populations (e.g., across different human body sites).


Conflict of interest statement

The authors declare no competing interests.

Figures

Fig. 1
Fig. 1
Construction of marker gene-based OTUs (mOTUs) for metagenomic profiling. a Schematic illustration of the mOTUs concept (Methods). b The observed richness of ref-mOTUs (containing exclusively MG sequences from reference genomes; blue) and meta-mOTUs (containing only MG sequences from metagenomes; green) per biome, and c mean cumulative relative abundance of species profiled across 2481 metagenomic samples. d Correspondence between mOTUs and 19,302 metagenome assembled genomes (MAGs) from the human gut. While less than 3% of MAGs are not represented (dark grey bar), mOTUs allow for profiling of 900 species not captured by MAGs. Source data are provided as a Source Data file.
Fig. 2
Fig. 2
Evaluation of mOTU profiling on simulated samples. Benchmarks of quantification accuracy (ag) on ten simulated metagenomic samples (Methods) containing MAGs with (n = 50) and MAGs without (n = 50) a representative reference genome sequence, (ho) and the CAMI challenge datasets. ad A representative simulated metagenome (out of ten; Supplementary Figures 8, 9) analysed with four profilers. e Precision-recall plot, where each data point corresponds to one of the ten simulated samples. Mean absolute error (MAE, also referred to as L1 norm) (f) and differences of the Shannon diversity index (g) from the expected values (error bars in f and g show standard deviation). hj Average precision-recall values over the two medium complexity samples and (ln) average precision-recall values over the five high complexity samples of the CAMI dataset (see also Supplementary Figure 10). Each precision-recall plot contains five values for mOTUs2, which correspond to different sets of parameters: high precision (-l 140 -g 6), default (-l 100 -g 3), recall (-l 75 -g 3), high recall (-l 50 -g 2) and maximum recall (-l 30 -g 1), indicating the versatility of mOTUs2 in optimising precision or recall. In (k) and (o), mean absolute errors (MAE; referred to as L1-norm in CAMI) at different taxonomic ranks are shown for several tools. For mOTUs2, results for two options of calculating relative abundances are shown: one with relative abundances re-normalized based on detected taxa, which is enforced in the CAMI evaluation (but artificially deteriorates quantification accuracy), and one without this additional re-normalization (see main text and Supplementary Figure 11 for details). Data are provided in Supplementary Data 3, 4. Other taxonomic profilers (MetaPhyler, TIPP, Taxy-Pro, FOCUS, CLARK, Quickr) evaluated in CAMI are denoted by grey dots. Source data are provided as a Source Data file.
Fig. 3
Fig. 3
Reference-extended mOTUs for microbial community diversity profiling. Shannon index was calculated based on 16S rRNA gene (16S) fragments (x-axis) and mOTUs (y-axis), respectively, for 129 human faecal samples (left) and 139 ocean water samples (right). Mean Spearman correlation of diversity estimates based on 16S and three metagenomic profiling tools (Kraken, MetaPhlAn2 and mOTUs2) are shown in the insets. Error bars delineate 95% confidence intervals after bootstrapping. Source data are provided as a Source Data file.
Fig. 4
Fig. 4
Metatranscriptomic abundance profiling with mOTUs2. a Spearman correlation between matched metagenomic and metatranscriptomic profiles obtained from 36 faecal samples with Kraken, MetaPhlAn2 and mOTUs2. mOTUs2 profiles (red) show significantly higher correlation than the other two methods (paired two-sided Wilcoxon test, boxplots show the median correlation as horizontal lines and interquartile ranges as boxes, whiskers extend at most 1.5 times the interquartile range). b The top-row represents the proportion of cases in which the distance (log-Euclidean) between metagenomic and metatranscriptomic profiles was smallest for the same sample. Below is a taxonomic breakdown (12 most abundant classes) of correlations between metagenomic and metatranscriptomic profiles. For each class, the highest correlation value across the tested methods are shown in bold. Source data are provided as a Source Data file.
Fig. 5
Fig. 5
Marker gene-based SNV profiles are comparable to those using whole genomes. a Pearson correlation coefficients for MG- and genome-based SNV profiles across species and biomes in the HMP (N = 2807) and ocean dataset (N = 139). Median correlations (Pearson’s r) are shown as horizontal lines and interquartile ranges as boxes. Whiskers extend at most 1.5 times the interquartile range. b Intra- and inter-individual distances of SNV profiles were compared using the area under the receiver operating characteristic curve (AU-ROC) to determine the degree of individuality of microbial strain populations for different human body sites (see also Supplementary Figure 17). Error bars delineate 95% confidence intervals after bootstrapping. Source data are provided as a Source Data file.

References

    1. Apprill A, McNally S, Parsons R, Weber L. Minor revision to V4 region SSU rRNA 806R gene primer greatly increases detection of SAR11 bacterioplankton. Aquat. Microb. Ecol. 2015;75:129–137. doi: 10.3354/ame01753. - DOI
    1. Parada AE, Needham DM, Fuhrman JA. Every base matters: assessing small subunit rRNA primers for marine microbiomes with mock communities, time series and global field samples. Environ. Microbiol. 2016;18:1403–1414. doi: 10.1111/1462-2920.13023. - DOI - PubMed
    1. Claesson MJ, et al. Comparison of two next-generation sequencing technologies for resolving highly complex microbiota composition using tandem variable 16S rRNA gene regions. Nucleic Acids Res. 2010;38:e200. doi: 10.1093/nar/gkq873. - DOI - PMC - PubMed
    1. Mende DR, Sunagawa S, Zeller G, Bork P. Accurate and universal delineation of prokaryotic species. Nat. Methods. 2013;10:881–884. doi: 10.1038/nmeth.2575. - DOI - PubMed
    1. Arumugam M, et al. Enterotypes of the human gut microbiome. Nature. 2011;473:174–180. doi: 10.1038/nature09944. - DOI - PMC - PubMed

Publication types

Substances