. 2019 Mar 4;10(1):1037.
doi: 10.1038/s41467-019-08960-1.

Essential and non-overlapping IL-2Rα-dependent processes for thymic development and peripheral homeostasis of regulatory T cells

Affiliations

Essential and non-overlapping IL-2Rα-dependent processes for thymic development and peripheral homeostasis of regulatory T cells

Kevin H Toomer et al. Nat Commun. .

Abstract

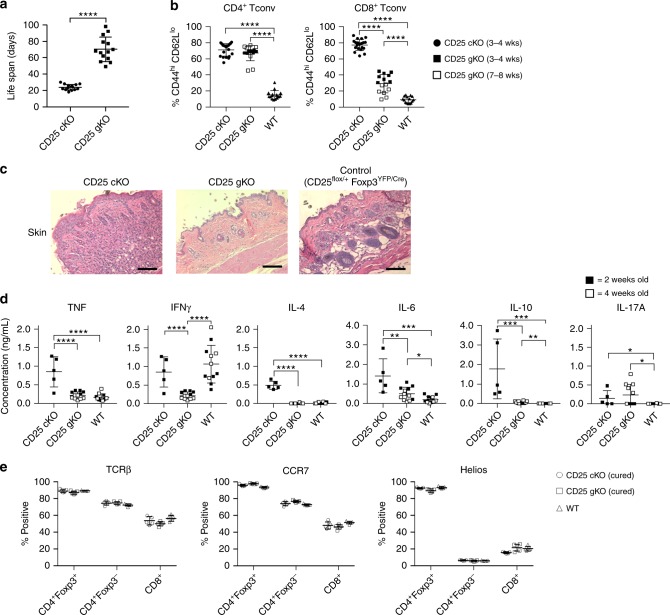
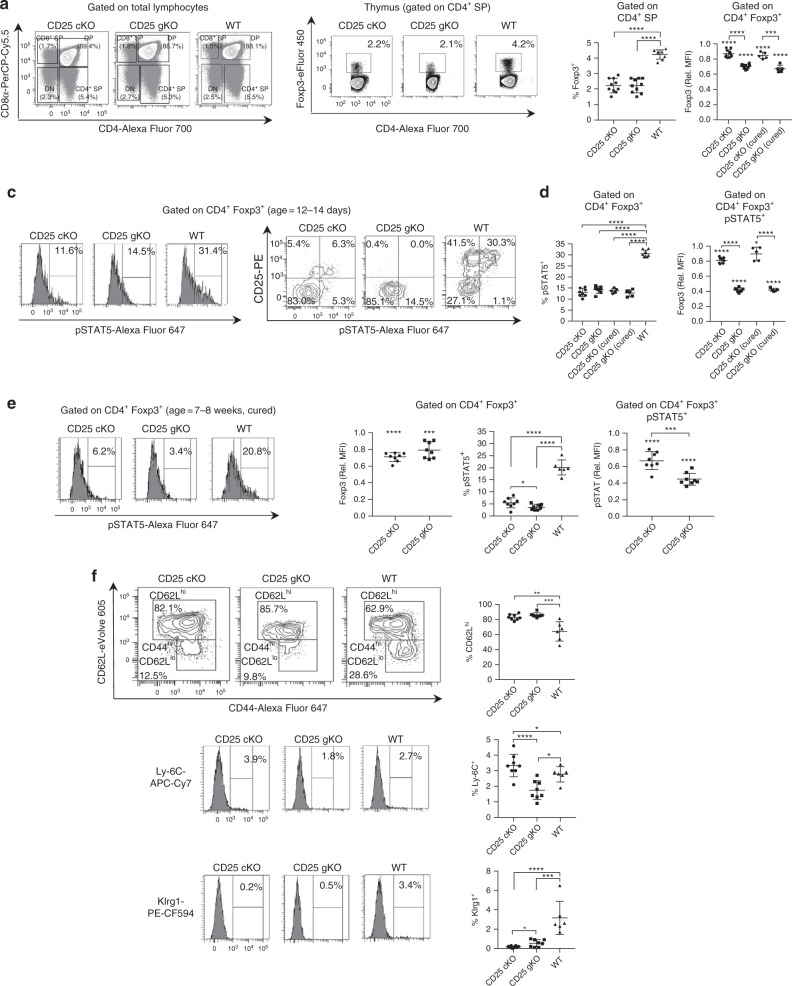
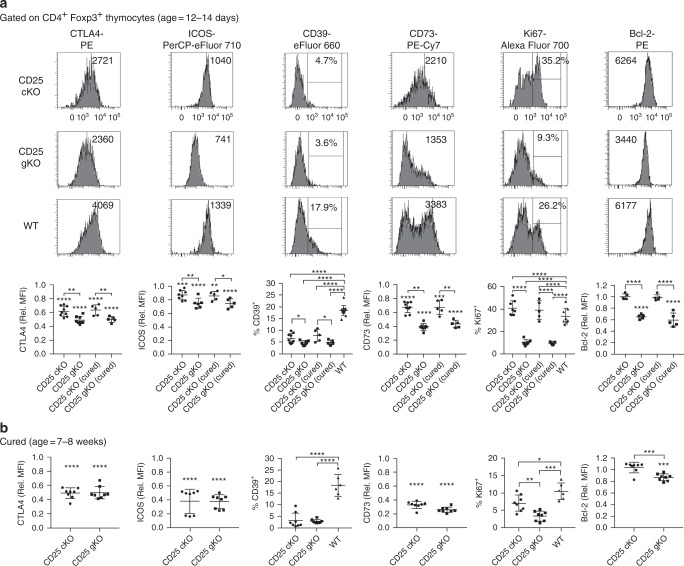
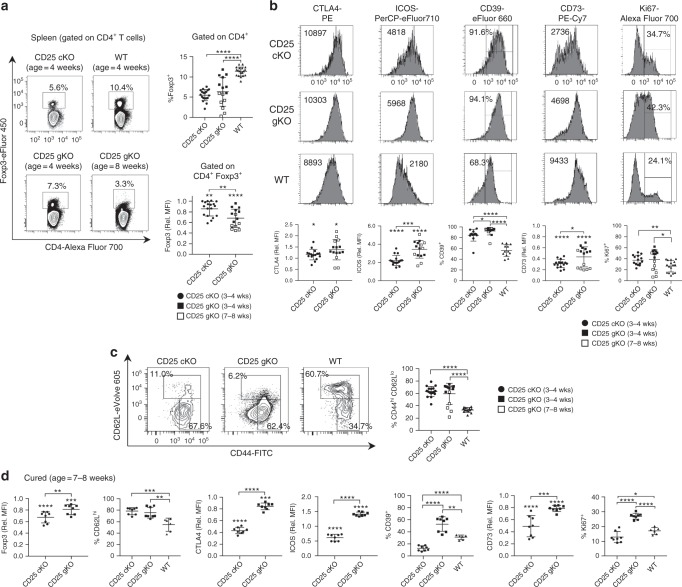
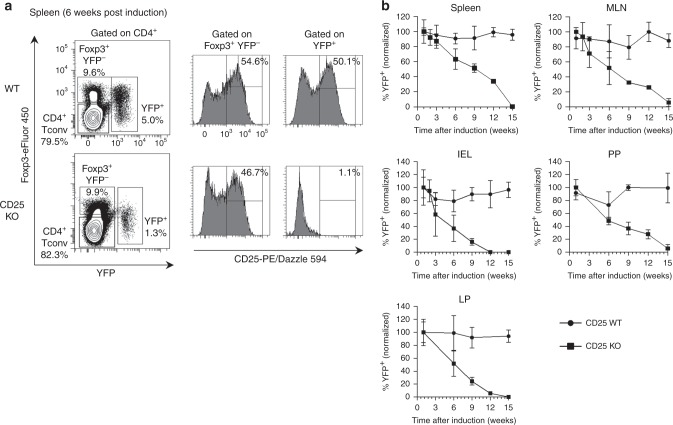
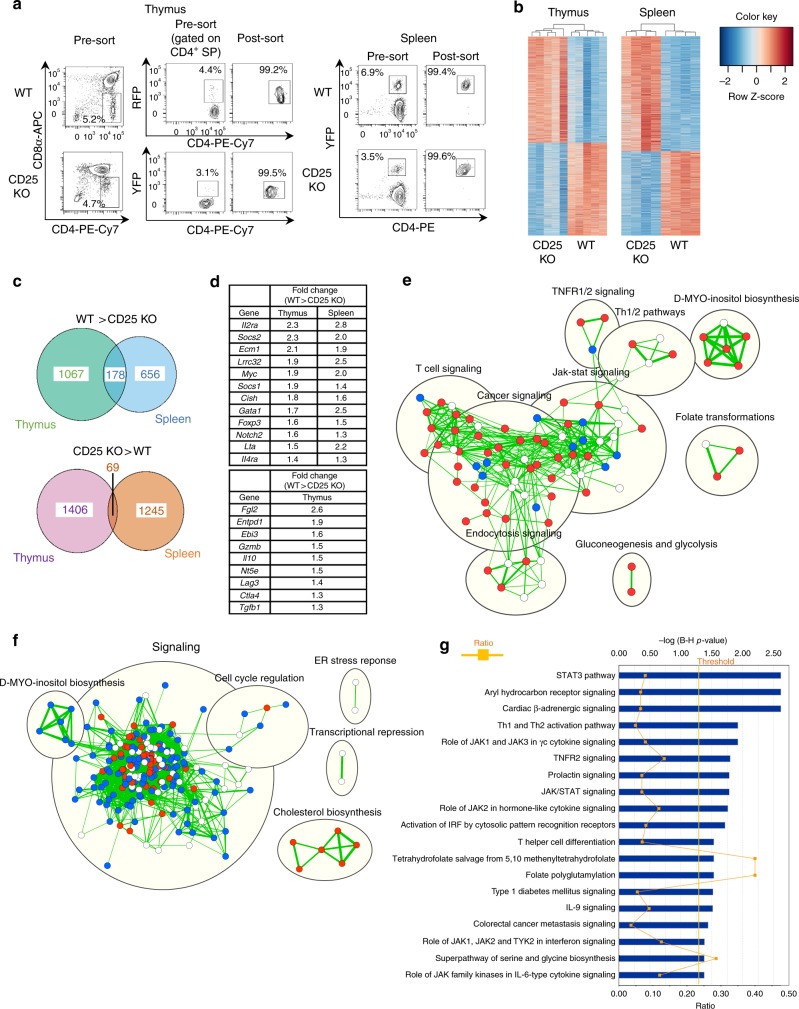
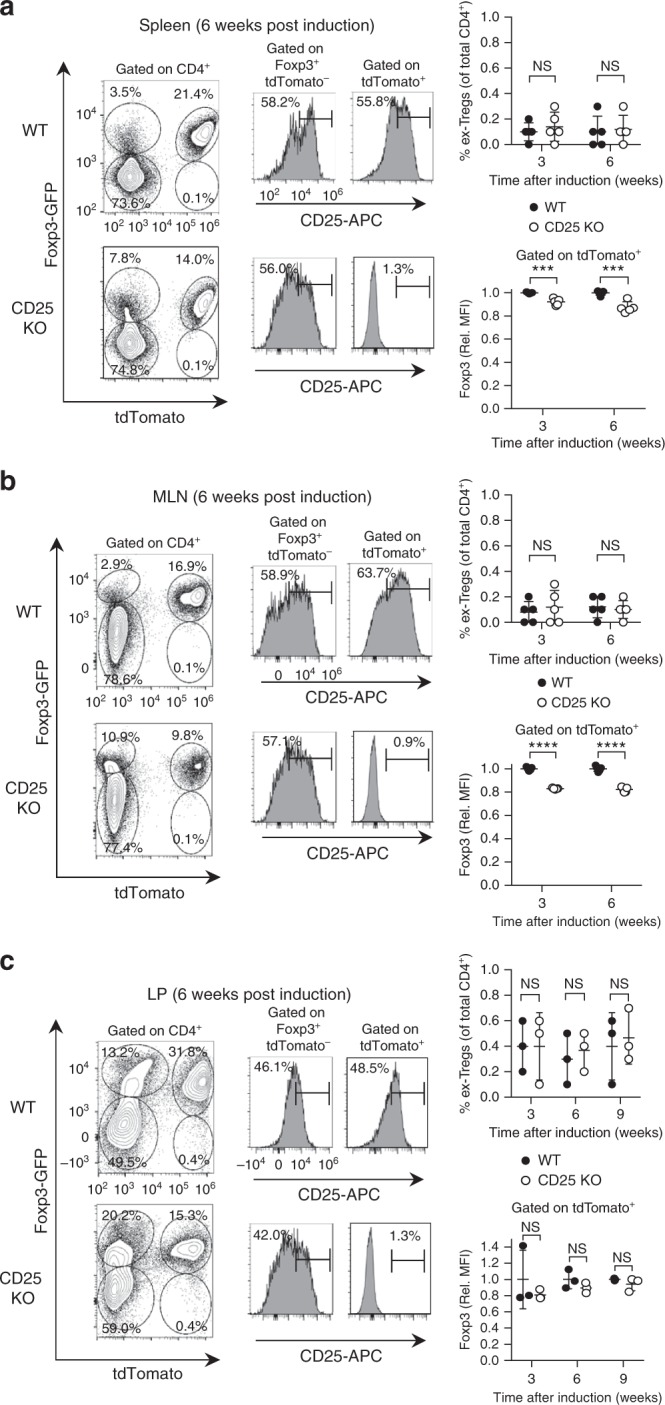
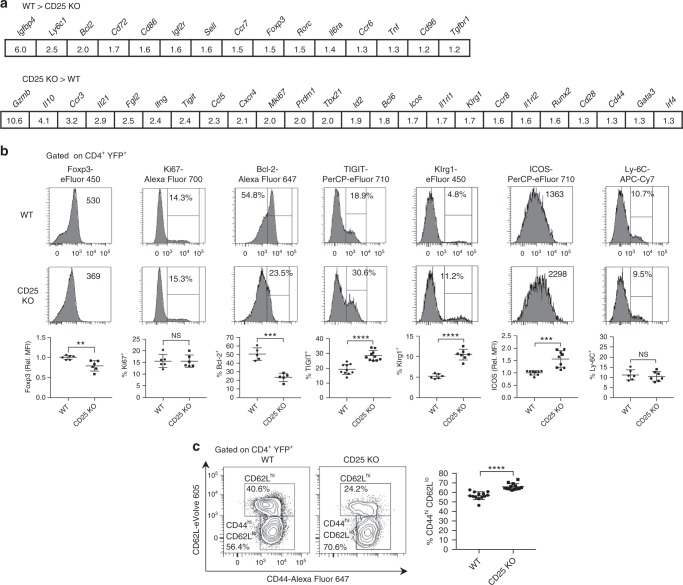
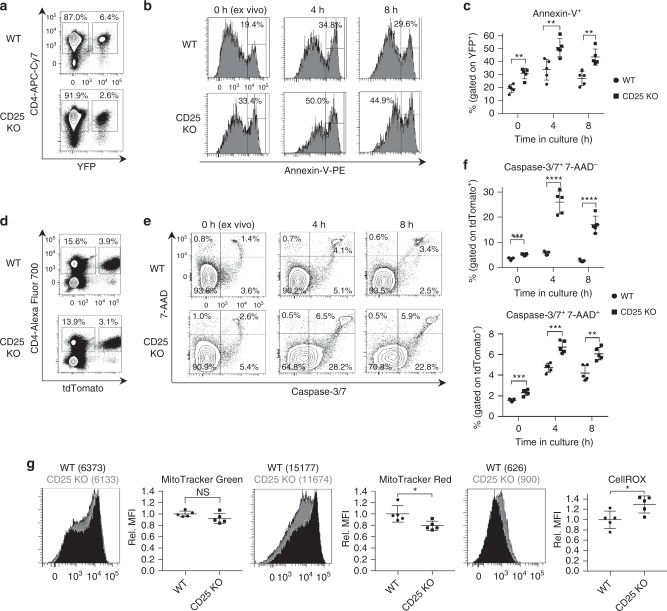
IL-2R signaling is essential for regulatory T cell (Treg) function. However, the precise contribution of IL-2 during Treg thymic development, peripheral homeostasis and lineage stability remains unclear. Here we show that IL-2R signaling is required by thymic Tregs at an early step for expansion and survival, and a later step for functional maturation. Using inducible, conditional deletion of CD25 in peripheral Tregs, we also find that IL-2R signaling is indispensable for Treg homeostasis, whereas Treg lineage stability is largely IL-2-independent. CD25 knockout peripheral Tregs have increased apoptosis, oxidative stress, signs of mitochondrial dysfunction, and reduced transcription of key enzymes of lipid and cholesterol biosynthetic pathways. A divergent IL-2R transcriptional signature is noted for thymic Tregs versus peripheral Tregs. These data indicate that IL-2R signaling in the thymus and the periphery leads to distinctive effects on Treg function, while peripheral Treg survival depends on a non-conventional mechanism of metabolic regulation.


Conflict of interest statement

The authors declare no competing interests.

Figures

Fig. 1
Fig. 1
Lethal autoimmunity in CD25 Treg-targeted conditional and CD25 germline knockout mice. a Lethal autoimmune disease occurs in both CD25flox/Foxp3-YFP/Cre mice (designated CD25cKO) and CD25gKO mice, and is accelerated in the former. Life span refers to time until animals died spontaneously or developed clinical complications for which euthanasia was indicated (n = 14 mice per genotype). b Percentages of CD4+ and CD8+ T conventional (Tconv) cells from the indicated mice expressing a CD44hi CD62Llo phenotype, evaluated by ex vivo flow cytometry (n = 15–20 mice per genotype). c Representative H&E-stained dorsal skin sections from the indicated mice (magnification ×200, scale bar: 100 μm). d After stimulation with anti-CD3/CD28, cytokine production by splenocytes from the indicated mice was determined by bead capture assay (n = 5–12 mice per genotype). e Thymic selection based on expression of TCRβ, CCR7, and Helios was evaluated among single positive subsets from the indicated mice at 12–14 days of age (n = 5 mice per genotype). Each point represents an individual mouse (a, b, d, e; mean ± SD). *p < 0.05, **p < 0.01, ***p < 0.001, ****p < 0.0001 (two-tailed Student’s t test). Data are pooled from (a, b, d, e) three independent experiments
Fig. 2
Fig. 2
Properties of thymic Treg precursors in CD25cKO and CD25gKO mice. a Representative contour plots showing gating strategy for thymocyte subpopulations from CD25flox/Foxp3-YFP/Cre (CD25cKO), CD25gKO, and WT mice. SP = single positive. DP double positive. DN double negative. b Representative contour plots showing Treg gating strategy among CD4+ SP thymocytes (left), with scatter plots for Foxp3 percentages and MFI (right). For MFI measurements, mice “cured” of autoimmunity through adoptive transfer of WT splenocytes were also evaluated (age = 12–14 days; n = 5–10 mice per group). c Representative histograms, contour plots, and gating strategy showing STAT5 phosphorylation and CD25 expression among CD4+ Foxp3+ thymocytes measured by ex vivo flow cytometry (age = 12–14 days). d Percentages and MFI for pSTAT5 among CD4+ Foxp3+ thymocytes (age = 12–14 days; n = 5–8 mice per group). e Representative histograms and scatter plots for Foxp3 levels (based on MFI) and pSTAT5 for host-derived CD4+ Foxp3+ thymocytes from “cured” adult mice (age = 7–8 weeks; n = 6–8 mice per group). f Representative contour plots/histograms (left) and scatter plots (right) showing expression of the cTreg/eTreg differentiation markers CD44, CD62L, Ly-6C, and Klrg1 among host-derived CD4+ Foxp3+ thymocytes from “cured” adult mice (age = 7–8 weeks; n = 6–8 mice per group). Rel. MFI = relative MFI normalized to CD25 WT controls. Each symbol represents an individual mouse (b, d, e, f; mean ± SD). *p < 0.05, **p < 0.01, ***p < 0.001, ****p < 0.0001. Symbols located directly above a single group of dots represent the comparison of that group against normalized WT control values (one sample t test); symbols located above brackets connecting two groups of dots represent inter-group comparisons (two-tailed Student’s t test). Data are representative of (a, b, c, e, f) or pooled from (b, d, e, f) three independent experiments
Fig. 3
Fig. 3
Abnormal programming of thymic Treg precursors in CD25cKO and CD25gKO mice. a Representative histograms (upper panels) and scatter plots (lower panels) showing expression of indicated markers, gated on CD4+ Foxp3+ thymocytes from CD25flox/Foxp3-YFP/Cre (CD25cKO) and CD25gKO mice (age = 12–14 days; n = 5–13 mice per group). b The indicated markers in (a) were evaluated in host-derived CD4+ Foxp3+ thymocytes from “cured” adult CD25cKO and CD25gKO mice (age = 7–8 weeks; n = 6–8 mice per group). Rel. MFI = relative MFI normalized to CD25 WT controls. Each symbol represents an individual mouse (a, b; mean ± SD). *p < 0.05, **p < 0.01, ***p < 0.001, ****p < 0.0001. Symbols located directly above a single group of dots represent the comparison of that group against normalized WT control values (one sample t test); symbols located above brackets connecting two groups of dots represent inter-group comparisons (two-tailed Student’s t test). Data are representative of (a) or pooled from (a, b) four independent experiments
Fig. 4
Fig. 4
Splenic CD4+ Foxp3+ T cells from CD25cKO and CD25gKO mice are skewed toward eTregs. a Representative contour plots (left) showing Foxp3 expression and gating strategy in splenic CD4+ T cells, with scatter plots (right) displaying Foxp3 expression as a proportion of total splenic CD4+ T cells and by mean fluorescence intensity (MFI) at the specified ages (n = 7–19 mice per group). b The indicated markers were evaluated in splenic CD4+ Foxp3+ T cells from CD25cKO, CD25gKO, and WT mice at the specified ages by ex vivo flow cytometry. Representative histograms (upper panels) and scatter plots (lower panels) are shown (n = 7–16 mice per group). c Representative contour plots (left) and scatter plot (right) showing the proportion of splenic CD4+ Foxp3+ T cells with a CD44hi CD62Llo eTreg phenotype in CD25cKO, CD25gKO, and WT mice at the specified ages (n = 7–17 mice per group). d Scatter plots showing expression of the indicated markers for host-derived splenic CD4+ Foxp3+ T cells from ‘cured’ mice (age 7–8 weeks; n = 6–8 mice per group). Rel. MFI = relative MFI normalized to CD25 WT controls. Each symbol represents an individual mouse (a, b, c, d; mean ± SD). *p < 0.05; **p < 0.01; ***p < 0.001; ****p < 0.0001. Symbols located directly above a single group of dots represent the comparison of that group against normalized WT control values (one sample t test); symbols located above brackets connecting two groups of dots represent inter-group comparisons (two-tailed Student’s t test). Data are representative of (a, b, c) or pooled from (a, b, c, d) three independent experiments
Fig. 5
Fig. 5
Impaired peripheral homeostasis of Tregs with selective CD25 deletion. a Representative contour plots and histograms showing splenocytes from CD25flox/Foxp3eGFP−Cre-ERT2/R26Y mice (shown as CD25 KO) and reporter controls, analyzed 6 weeks after tamoxifen induction. b Proportional abundance of YFP+ cells in lymphoid and non-lymphoid tissues analyzed at indicated time points after tamoxifen induction. YFP+ cell numbers were calculated as a percentage of total Tregs (the combined Foxp3+ and YFP+ populations) and normalized to an initial induction efficiency of 100% measured 1 week after tamoxifen induction. MLN mesenteric lymph nodes, PP Peyer’s patches, IEL intraepithelial lymphocytes of small intestine, LP  lamina propria of small intestine (n = 3 mice per time point; error bars ± SD). Data are representative of (a) or pooled from (b) three independent experiments
Fig. 6
Fig. 6
Distinctive transcriptional signatures in CD25-deficient thymic and peripheral Tregs. a Sorting strategy and purity of Foxp3+ Tregs FACS-purified from the thymus and spleen. Thymic Tregs were obtained from “cured” CD25flox/Foxp3-YFP/Cre (CD25cKO) mice at 3–4 weeks of age, with age-matched Foxp3/RFP reporter mice used as controls. Splenic Tregs were obtained from CD25flox/Foxp3eGFP−Cre-ERT2/R26Y mice and reporter controls 10–14 days after tamoxifen induction. b Set of differentially expressed (DE) transcripts in RNA-seq analysis of CD25 KO Tregs in thymus and spleen. DE transcripts were designated using a significance cutoff of false discovery rate (FDR) < 0.01, with each column representing an individual mouse (n = 5 for thymus; n = 4 for the spleen). c Venn diagrams showing overlap of genes from thymus and spleen that were downregulated (top) or upregulated (bottom) in CD25 KO Tregs. d Top: selected genes with reduced expression in CD25 KO Tregs from both thymus and spleen (FDR < 0.01 for all comparisons). Bottom: selected genes with reduced expression in CD25 KO Tregs from thymus only (FDR < 0.05 for all comparisons). e Ingenuity Pathway Analysis (IPA) pathway enrichment map for thymus. f IPA pathway enrichment map for the spleen. For pathway enrichment maps, pathways upregulated in CD25 KO Tregs are shown in blue, those downregulated in CD25 KO Tregs are shown in red, and pathways enriched without known direction are shown in white. Cutoffs for pathway selection were FDR < 0.1 for the thymus and FDR < 0.01 for the spleen, with p-value < 0.05 for both. g IPA conducted on DE genes with overlapping changes in the same direction for thymus and spleen. Pathways are listed in order of statistical significance, quantified on the top x-axis as the −log of p-values adjusted by the Benjamini–Hochberg (B-H) procedure. Cutoff for statistical significance is designated by the vertical line labeled “threshold.” “Ratio” values, quantified on the bottom x-axis, were calculated for each pathway by dividing the number of statistically significant genes in the data set by the total number of genes in the pathway
Fig. 7
Fig. 7
CD25 KO peripheral Tregs show only a modest decline in Foxp3 expression. Expression of GFP, tdTomato, and CD25 was evaluated by flow cytometry in the (a) splenic, (b) mesenteric lymph node (MLN), and (c) small intestinal lamina propria (LP) CD4+ T cells from CD25flox/Foxp3eGFP-Cre-ERT2/R26TD mice (shown as CD25 KO) and reporter controls. Representative contour plots and histograms are shown (left panels). Scatter plots display the proportion of GFP- tdTomato+ “ex-Tregs” in each tissue, expressed as a percentage of total CD4+ T cells (upper right panels), as well as GFP MFI among tdTomato+ Tregs from CD25flox/Foxp3eGFP-Cre-ERT2/R26TD mice and reporter controls (lower right panels). These parameters were evaluated in the spleen and MLN at 3 and 6 weeks post induction (n = 5 mice per group). In LP, the proportion of GFP tdTomato+ “ex-Tregs” and GFP MFI among tdTomato+ Tregs were examined at 3, 6, and 9 weeks post induction (n = 3 mice per group). Rel. MFI = relative MFI normalized to CD25 WT controls. Each symbol represents an individual mouse (a, b, c; mean ± SD). NS, not significant (p > 0.05), ***p < 0.001, ****p < 0.0001 (two-tailed Student’s t test). Data are representative of, or pooled from (a, b, c) three independent experiments
Fig. 8
Fig. 8
CD25 deficiency in peripheral Tregs initially favors survival of eTregs. a Selected immunological genes downregulated (top) or upregulated (bottom) in splenic CD25 KO Tregs from tamoxifen-induced CD25flox/Foxp3eGFP-Cre-ERT2/R26Y mice evaluated by RNA-seq. Statistical significance is FDR < 0.01 for all comparisons. b Expression of indicated markers in splenic YFP+ Tregs from CD25flox/Foxp3eGFP-Cre-ERT2/R26Y mice (shown as CD25 KO) and reporter controls was measured by ex vivo flow cytometry 10–14 days after tamoxifen induction (n = 5–10 mice per group). Representative histograms (upper panels) and scatter plots (lower panels) are shown. c Representative contour plots (left) and scatter plot (right) showing the proportion of splenic YFP+ Tregs with a CD44hi CD62Llo eTreg phenotype (n = 13 mice per group). Rel. MFI = relative MFI normalized to CD25 WT controls. Each symbol represents an individual mouse (b, c; mean ± SD). NS, not significant (p > 0.05), **p < 0.01, ***p < 0.001, ****p < 0.0001 (two-tailed Student’s t test). Data are representative of, or pooled from (b, c) three independent experiments
Fig. 9
Fig. 9
Increased apoptosis and mitochondrial dysfunction in CD25-deficient peripheral Tregs. a Representative contour plots and gating strategy for YFP+ Tregs among splenic CD4+ T cells bead-purified from CD25flox/Foxp3eGFP-Cre-ERT2/R26Y mice (shown as CD25 KO) and reporter controls 10–14 days after tamoxifen induction. b Representative histograms and (c) scatter plot showing Annexin-V staining, performed ex vivo and after 4 h and 8 h incubation in culture media alone (n = 5 mice per group). Cells are gated on the YFP+ population shown in (a). d Representative contour plots and gating strategy for tdTomato+ Tregs among splenic CD4+ T cells from CD25flox/Foxp3eGFP-Cre-ERT2/R26TD mice (shown as CD25 KO) and reporter controls evaluated 10–14 days after tamoxifen induction. e Representative contour plots and (f) scatter plots showing staining with caspase-3/7 enzyme substrate and 7-AAD (n = 5 mice per group). Cells are gated on the tdTomato+ population shown in (d). g Representative histograms and scatter plots of MFI data for tdTomato+ cells stained with MitoTracker Green, MitoTracker Red, and CellROX oxidative stress detection reagent (n = 5 mice per group). Rel. MFI = relative MFI normalized to CD25 WT controls. Each symbol represents an individual mouse (mean ± SD). NS, not significant (p > 0.05), *p < 0.05, **p < 0.01, ***p < 0.001, ****p < 0.0001 (two-tailed Student’s t test). Data are representative of (a, b, d, e, g) or pooled from (c, f, g) two independent experiments

References

    1. Fontenot JD, Rasmussen JP, Gavin MA, Rudensky AY. A function for interleukin 2 in Foxp3-expressing regulatory T cells. Nat. Immunol. 2005;6:1142–1151. doi: 10.1038/ni1263. - DOI - PubMed
    1. Feng Y, et al. Control of the inheritance of regulatory T cell identity by a cis element in the Foxp3 locus. Cell. 2014;158:749–763. doi: 10.1016/j.cell.2014.07.031. - DOI - PMC - PubMed
    1. Li X, Liang Y, LeBlanc M, Benner C, Zheng Y. Function of a Foxp3 cis-element in protecting regulatory T cell identity. Cell. 2014;158:734–748. doi: 10.1016/j.cell.2014.07.030. - DOI - PMC - PubMed
    1. Lio CW, Hsieh CS. A two-step process for thymic regulatory T cell development. Immunity. 2008;28:100–111. doi: 10.1016/j.immuni.2007.11.021. - DOI - PMC - PubMed
    1. Tai X, et al. Foxp3 transcription factor is proapoptotic and lethal to developing regulatory T cells unless counterbalanced by cytokine survival signals. Immunity. 2013;38:1116–1128. doi: 10.1016/j.immuni.2013.02.022. - DOI - PMC - PubMed

Publication types

MeSH terms

Substances