. 2019 Mar 4;10(1):1032.
doi: 10.1038/s41467-019-08991-8.

High-resolution structure determination of sub-100 kDa complexes using conventional cryo-EM

Affiliations

High-resolution structure determination of sub-100 kDa complexes using conventional cryo-EM

Mark A Herzik Jr et al. Nat Commun. .

Abstract

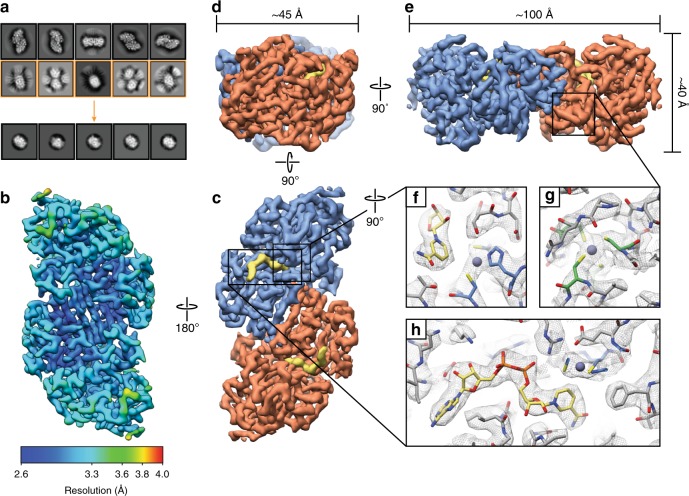
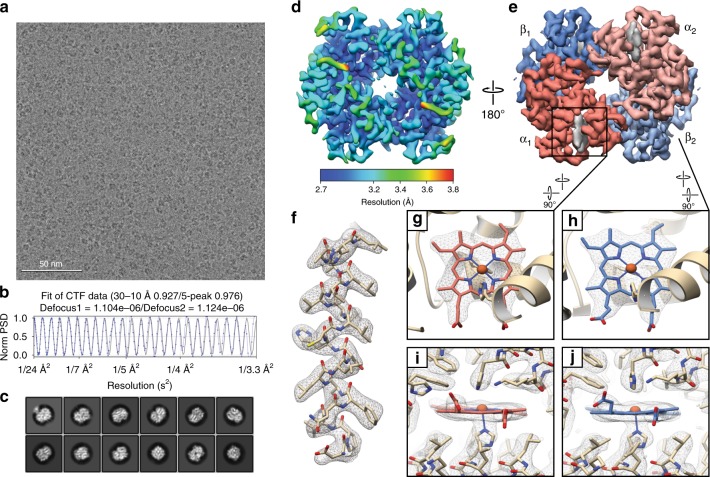
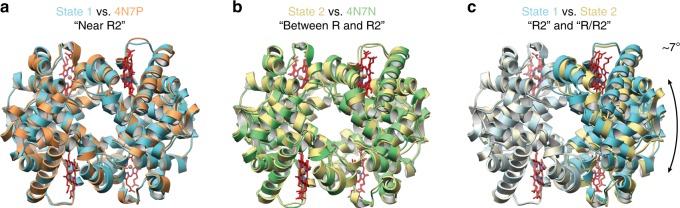
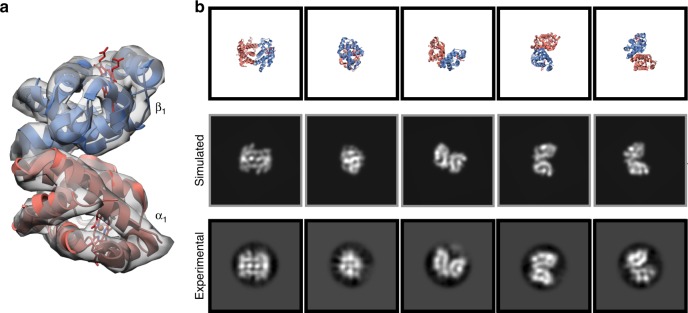
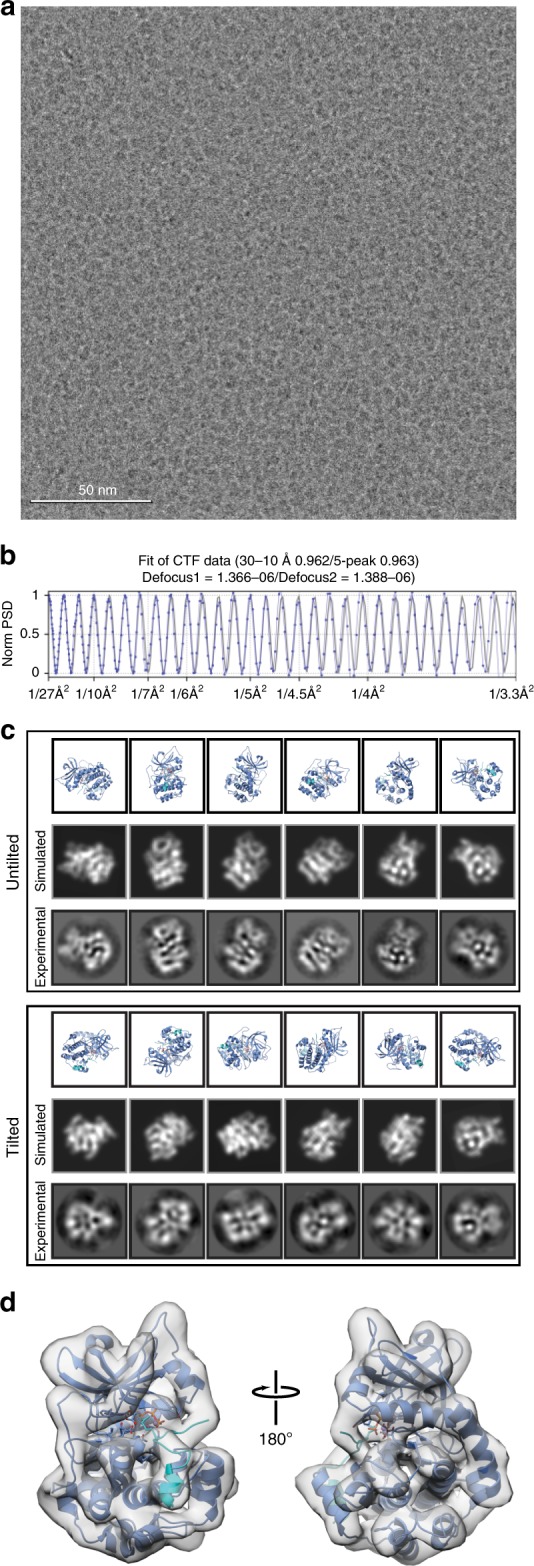
Determining high-resolution structures of biological macromolecules amassing less than 100 kilodaltons (kDa) has been a longstanding goal of the cryo-electron microscopy (cryo-EM) community. While the Volta phase plate has enabled visualization of specimens in this size range, this instrumentation is not yet fully automated and can present technical challenges. Here, we show that conventional defocus-based cryo-EM methodologies can be used to determine high-resolution structures of specimens amassing less than 100 kDa using a transmission electron microscope operating at 200 keV coupled with a direct electron detector. Our ~2.7 Å structure of alcohol dehydrogenase (82 kDa) proves that bound ligands can be resolved with high fidelity to enable investigation of drug-target interactions. Our ~2.8 Å and ~3.2 Å structures of methemoglobin demonstrate that distinct conformational states can be identified within a dataset for proteins as small as 64 kDa. Furthermore, we provide the sub-nanometer cryo-EM structure of a sub-50 kDa protein.


Conflict of interest statement

The authors declare no competing interests.

Figures

Fig. 1
Fig. 1
2.7 Å resolution cryo-EM reconstruction of 82 kDa horse liver alcohol dehydrogenase. a Representative reference-free 2D class averages of horse liver alcohol dehydrogenase (ADH). Particles comprising the 2D classes highlighted in yellow were subsequently further classified using a smaller soft circular mask (see methods). b Final cryo-EM reconstruction colored by estimated local resolution estimated with BSOFT. c-e Orthogonal views of the ADH EM density (colored by subunit) showing the disparity in particle dimensions. The segmented NADH EM density is shown in yellow. fh Zoomed-in views of the EM density (gray mesh) for the ADH active-site zinc, structural zinc site, and active site, respectively. Residues involved in coordinating the active-site zinc (blue), the structural site zinc (green) or interacting with NADH (yellow) are shown in stick representation. The zinc atoms are shown as purple spheres
Fig. 2
Fig. 2
2.8 Å resolution cryo-EM reconstruction of ~64 kDa human methemoglobin. a Representative motion-corrected electron micrograph of human methemoglobin (metHb) embedded in vitreous ice recorded at ~1.1 µm defocus (scale bar, 50 nm). b 1-dimensional plot of the contrast transfer function (CTF) Thon rings (black line) and the CTF estimated with CTFFIND4 (blue line). c Representative reference-free 2D class averages showing secondary structure elements. d, e Final ~2.8 Å resolution metHb cryo-EM density colored by local resolution (estimated using BSOFT) and subunit with the segmented EM density for the heme cofactors colored gray, respectively. f EM density (gray mesh) zoned 2 Å around an α-helix comprising residues 94–113 from the α subunit. gj EM density in the vicinity of the heme cofactors from subunit α1 and β2. Lower panels are 90° rotations of upper panels. Residues are shown in stick representation (colored wheat) and the heme cofactors are colored according to the subunit coloring in e. The heme iron atoms are shown as orange spheres
Fig. 3
Fig. 3
Multiple conformational states of metHb determined using single-particle cryo-EM. a Cartoon representation of metHb state 1 (~2.8 Å resolution, blue) superposed with PDB ID: 4N7P [10.2210/pdb4N7P/pdb] (chains A–D, orange). b Cartoon representation of metHb state 2 (~3.2 Å resolution, yellow) superposed with PDB ID: 4N7N [10.2210/pdb4N7N/pdb] (chains E-H, green). c Superposing the α1 and β1 subunits of states 1 and 2 emphasizes the difference between these two conformations as a ~7° rotation of the α2 and β2 subunits
Fig. 4
Fig. 4
2D classification yields classes of ~32 kDa hemoglobin αβ heterodimer. a Simulated EM density of the hemoglobin αβ heterodimer low-pass filtered to 8 Å resolution shown as a gray transparent surface. The αβ heterodimer atomic model is shown as ribbon cartoon and the hemes are shown as red sticks. b Views of the hemoglobin αβ heterodimer atomic model (top) and 2D projections of the simulated hemoglobin αβ heterodimer EM density (middle) corresponding to the class averages obtained from 2D classification (bottom) (see Fig. 2)
Fig. 5
Fig. 5
Towards a high-resolution cryo-EM reconstruction of the ~43 kDa isolable kinase domain of protein kinase A. a Representative motion-corrected electron micrograph of the catalytic subunit of protein kinase A bound to IP20 (iPKAc) embedded in vitreous ice recorded at ~1.3 µm defocus (scale bar, 50 nm). b 1-dimensional plot of the contrast transfer function (CTF) Thon rings (black line) and the CTF estimated with CTFFIND4 (blue line). c Views of the iPKAc atomic model (top, PDB ID: 1ATP [10.2210/pdb1ATP/pdb], blue cartoon) and 2D projections of the simulated iPKAc EM density (middle) corresponding to the class averages obtained from 2D classification (bottom). d Final ~6 Å iPKAc EM density shown as a transparent gray surface with the fitted atomic model (PDB ID: 1ATP [10.2210/pdb1ATP/pdb]) shown as a blue cartoon. ATP is shown as sticks and IP20 is colored light blue

References

    1. Cheng Y. Single-particle cryo-EM—how did it get here and where will it go. Science. 2018;361:876–880. doi: 10.1126/science.aat4346. - DOI - PMC - PubMed
    1. Nogales E, Scheres SHW. Cryo-EM: a unique tool for the visualization of macromolecular complexity. Mol. Cell. 2015;58:677–689. doi: 10.1016/j.molcel.2015.02.019. - DOI - PMC - PubMed
    1. Lander GC, et al. Complete subunit architecture of the proteasome regulatory particle. Nature. 2012;482:186–191. doi: 10.1038/nature10774. - DOI - PMC - PubMed
    1. Yan C, Wan R, Bai R, Huang G, Shi Y. Structure of a yeast activated spliceosome at 3.5 Å resolution. Science. 2016;353:904–911. doi: 10.1126/science.aag0291. - DOI - PubMed
    1. Khoshouei M, Radjainia M, Baumeister W, Danev R. Cryo-EM structure of haemoglobin at 3.2 Å determined with the Volta phase plate. Nat. Commun. 2017;8:16099. doi: 10.1038/ncomms16099. - DOI - PMC - PubMed

Publication types

MeSH terms