. 2019 Mar 4;10(1):1022.
doi: 10.1038/s41467-019-08944-1.

Atypical functional connectome hierarchy in autism

Affiliations

Atypical functional connectome hierarchy in autism

Seok-Jun Hong et al. Nat Commun. .

Abstract

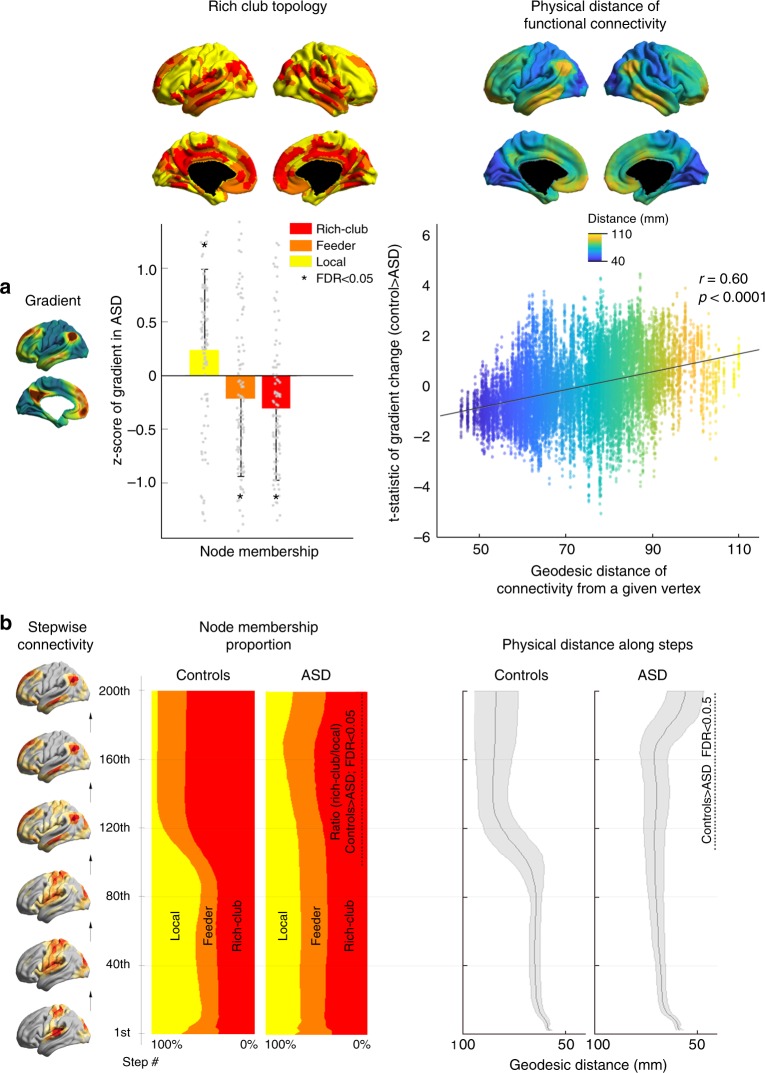
One paradox of autism is the co-occurrence of deficits in sensory and higher-order socio-cognitive processing. Here, we examined whether these phenotypical patterns may relate to an overarching system-level imbalance-specifically a disruption in macroscale hierarchy affecting integration and segregation of unimodal and transmodal networks. Combining connectome gradient and stepwise connectivity analysis based on task-free functional magnetic resonance imaging (fMRI), we demonstrated atypical connectivity transitions between sensory and higher-order default mode regions in a large cohort of individuals with autism relative to typically-developing controls. Further analyses indicated that reduced differentiation related to perturbed stepwise connectivity from sensory towards transmodal areas, as well as atypical long-range rich-club connectivity. Supervised pattern learning revealed that hierarchical features predicted deficits in social cognition and low-level behavioral symptoms, but not communication-related symptoms. Our findings provide new evidence for imbalances in network hierarchy in autism, which offers a parsimonious reference frame to consolidate its diverse features.


Conflict of interest statement

The authors declare no competing interests.

Figures

Fig. 1
Fig. 1
Connectome gradient mapping in autism spectrum disorders (ASD) and neurotypical controls. a The principal gradient in controls describes a continuous coordinate system that runs from unimodal (dark turquoise) regions one end to transmodal regions on the other end (sienna), peaking in the default mode network (DMN). Regions with similar connectivity patterns show similar coloring. In ASD, while the gradient is overall similar, one readily appreciates lower values in the DMN core. b Global histogram analysis confirmed that extreme values were suppressed in ASD compared to controls, while those in the mid-range increased. c Surface-wide statistical comparisons between controls and ASD, with increases/decreases in ASD shown in red/blue. Findings were obtained using surface-based linear models implemented in SurfStat. d Community-based z-score analysis of gradient score (with respect to controls) shows significant reductions primarily in DMN both spider (left) and joy (right) plots
Fig. 2
Fig. 2
Stepwise functional connectivity (SFC) analysis. SFC analysis combining three sensory seeds simultaneously (V1, A1, S1) mapped the human multimodal integration network in controls (left) and ASD (right). The number of connectivity steps increases moving up in the plot. In controls, transmodal DMN regions became selectively activated, after around 100–120 steps. In ASD, despite rapid initial activation of a rather extended territory, a selective DMN core activation did not occur in a comparable step range as in controls. The middle panel shows SFC findings stratified across four hierarchy levels, adapted from Mesulam and Margulies et al.. The bar represents a mean ± 1 SD of required connectivity steps. Statistical comparisons between groups using Student’s t-tests across these four levels emphasize faster SFC to sensory, dorsal attention, and salience networks in ASD compared to controls, but delayed SFC to the DMN
Fig. 3
Fig. 3
Integration of gradient and SFC findings. a Scatter plot of the first two connectivity embedding gradients in controls and ASD. Gradient 1 (y-axis) runs from primary sensorimotor (dark turquoise) to transmodal DMN (sienna). Gradient 2 (x-axis) separates somatomotor and auditory cortex from visual cortex. Triangular scattered points are colored with respect to established functional communities. Histograms on right show the point density in ASD (light red) and controls (gray), suggesting overall compression of the first gradient in ASD. b Post-hoc analysis, showing positional shifts of the four significant clusters from the surface-based analysis (See Figure 1; 1-PCC/PCU, 2-mPFC, 3-OT, 4-pMTG). c Stepwise functional connectivity (SFC) in gradient space. Points are colored with respect to cumulative steps when simultaneously seeding from V1, S1, and A1. Trajectories (sampled every 20th step) illustrate the direct SFC from the primary sensory seeds to transmodal DMN in controls (left). ASD show an initially more rapid transition; however, trajectories deflect from a straight path and do not reach the DMN, even after 200 steps. Histogram on the right show point densities, weighted by the cumulative SFC. See also Supplementary Movies 1–3
Fig. 4
Fig. 4
Relationship to rich-club and physical distance of functional connections. The top left a illustrates the results of the gradient comparisons and rich-club taxonomy, showing gradient reductions in feeder and rich-club nodes in ASD compared to controls (based on Student’s t-tests) but increases in local nodes. The box plot indicates the mean ± SD. The top right a shows the vertex-wise association of between-group differences in gradient scores (t-statistic of the map from Fig. 1b; shown on the y-axis) and the average geodesic distance of functional connections of a given vertex (x-axis). The positive association indicates that regions with long-range connections tend to show gradient reductions (Pearson correlation coefficient r = 0.6). The bottom left b panel shows the proportion of visited nodes as a function of SFC steps in controls and ASD, illustrating the lower proportion of active rich-club vs local nodes from 100–200 steps. The bottom right b shows significantly shorter average connectivity distances in autism at these higher steps, established using Student’s t-tests with multiple comparisons correction
Fig. 5
Fig. 5
Relation to ASD symptom severity. a A supervised learning algorithm with 5-fold cross-validation was trained on gradient and SFC features to predict total ADOS scores and subscores in individuals with ASD. Significant accuracy was achieved for total ADOS scale (shown) and subscales for social cognition and repetitive behavior/interest (permutation-tests; p < 0.05). b Selected features across 100 iterations of the cross-validation, showing frequently selected features in hot colors. Community-based stratification illustrates that most features were selected in visual, salience, and the DMN. c Prediction of subdomains (i.e., social cognition, communication, repetitive behavior/interest)

References

    1. Christensen DL, et al. Prevalence and characteristics of autism spectrum disorder among children aged 8 years–autism and developmental disabilities monitoring network, 11 sites, United States, 2012. Mmwr. Surveill. Summ. 2016;65:1–23. doi: 10.15585/mmwr.ss6503a1. - DOI - PMC - PubMed
    1. Happe F, Frith U. The weak coherence account: detail-focused cognitive style in autism spectrum disorders. J. Autism Dev. Disord. 2006;36:5–25. doi: 10.1007/s10803-005-0039-0. - DOI - PubMed
    1. Mottron L, Dawson M, Soulieres I, Hubert B, Burack J. Enhanced perceptual functioning in autism: An update, and eight principles of autistic perception. J. Autism Dev. Disord. 2006;36:27–43. doi: 10.1007/s10803-005-0040-7. - DOI - PubMed
    1. Baron-Cohen S, Leslie AM, Frith U. Does the autistic-child have a theory of mind. Cognition. 1985;21:37–46. doi: 10.1016/0010-0277(85)90022-8. - DOI - PubMed
    1. Sinha P, et al. Autism as a disorder of prediction. Proc Natl. Acad. Sci. USA. 2014;111:15220–15225. doi: 10.1073/pnas.1416797111. - DOI - PMC - PubMed

Publication types